> For the complete documentation index, see [llms.txt](https://docs.powermonitor.com.br/llms.txt). Markdown versions of documentation pages are available by appending `.md` to page URLs; this page is available as [Markdown](https://docs.powermonitor.com.br/en/power-monitor/auditoria/acoes-de-capacidade.md).
# Capacity Actions
Audit of every attempt to pause, resume, scale up, or scale down the SKU of a capacity, manually, by schedule, or by auto-scale, with the Capacity Units consumption at the time of the action and the p
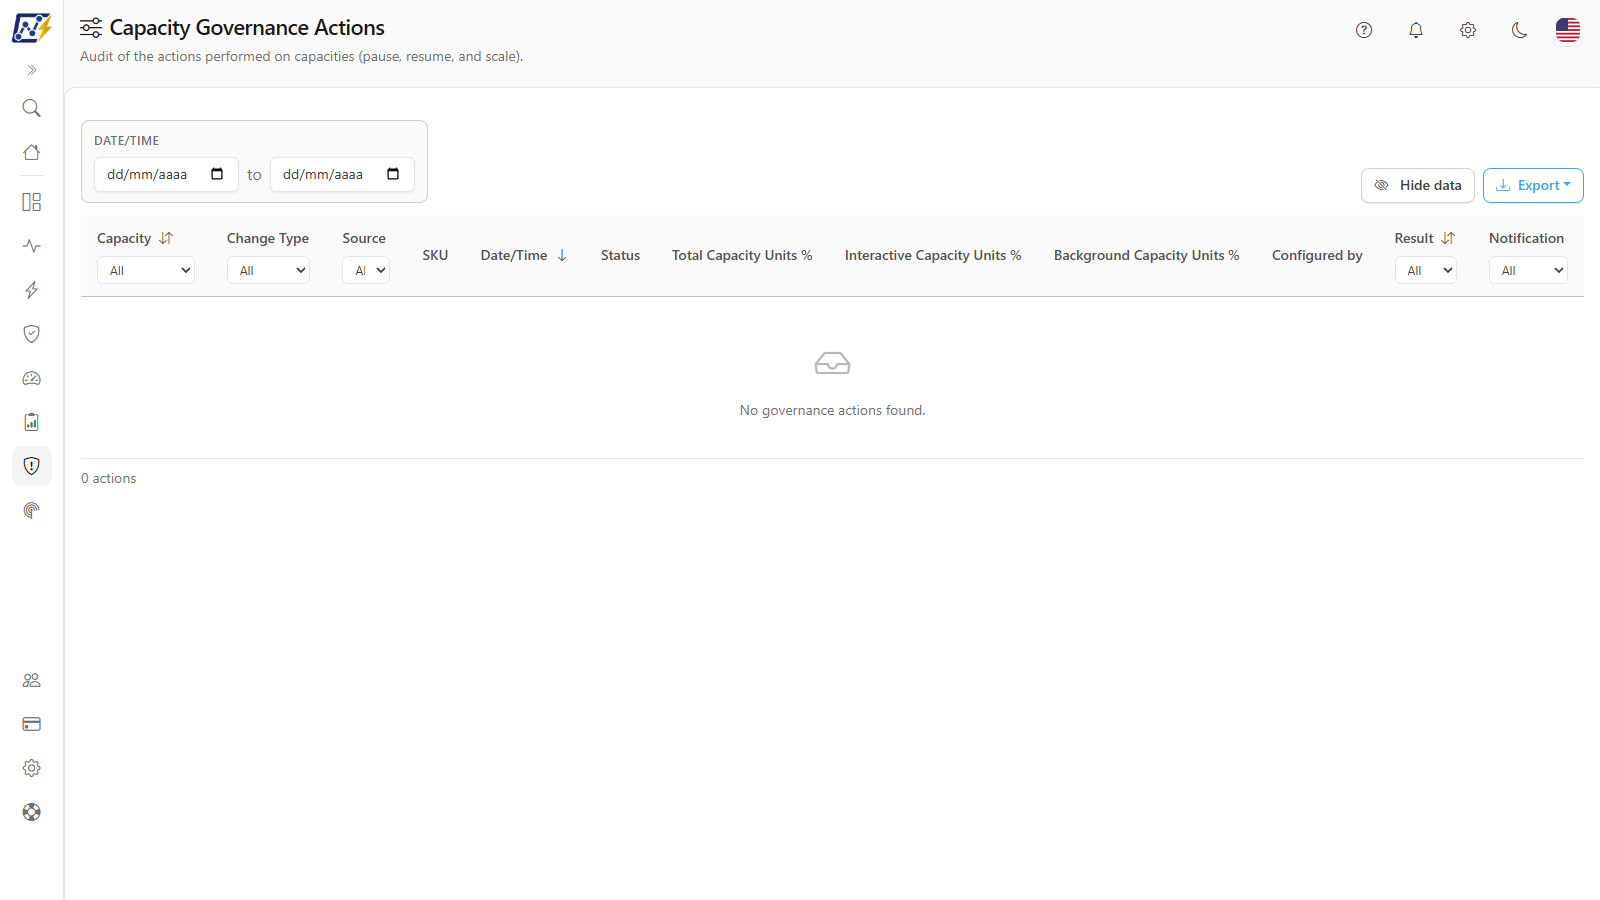
The **Capacity Actions** screen records **every attempt** at an action performed by Power Monitor on your Fabric/Power BI Embedded capacities (**pausing, resuming, scaling up, or scaling down the SKU**) whether manual, triggered by a schedule, or by auto-scale. For each action, you see who is responsible, what the **Capacity Units (CU)** consumption was at that moment, the result in Azure, and whether the email notification was sent.
**How to access:** *Audit › Capacity Actions* (also available in the **Capacities** menu). The page title is **Capacity Governance Actions**. **Exclusive to Administrators.**
List of actions on capacities with the consumption at the time of execution
## What it is for
* **FinOps**: prove that the pause schedules are saving money, and find out who turned a capacity back on outside business hours.
* **Unavailability investigation**: "why was the capacity paused during month-end closing?": see who paused it, when, and by which rule.
* **Evaluating auto-scale**: see the consumption that triggered each SKU increase or decrease and whether the action was executed.
* **Evidence of infrastructure changes** for audits.
## Features
### Period filter (Date/Time)
**What it is:** the date range of the displayed actions, in the **Date/Time** field above the table (start date and end date).
**What it is for:** restricting the investigation to a known window: for example, the month-end closing during which the capacity was paused.
Period filter above the table
**How to use:**
1. In the **Date/Time** field, choose the start date in the first selector.
2. Choose the end date in the second selector. The list is reloaded automatically.
3. To go back to the unfiltered view, click **Clear filters**.
**How it works:** the **Clear filters** button appears next to the period only when there is an active filter and removes all of them, including the period.
### Column filters
**What it is:** selection boxes in the header of the **Capacity**, **Change Type**, **Source**, **Result**, and **Notification** columns.
**What it is for:** quickly isolating one type of event: only the pauses of a capacity, only what auto-scale did, only the failures, or the notifications that did not arrive.
Filters in the column headers
**How to use:**
1. In the header of the desired column, open the selection box (the initial option is **All**).
2. Choose the value. The filters combine with each other and with the period.
| Filter (header) | Options |
| ---------------- | ------------------------------------------- |
| **Capacity** | All or one of the organization's capacities |
| **Change Type** | All, Pause, Resume, Scale up, Scale down |
| **Source** | All, Manual, Schedule, Auto-Scale |
| **Result** | All, Success, Failed |
| **Notification** | All, Not Applicable, Sent, Failed |
### Action list
**What it is:** the table with one row per action attempt on a capacity.
**What it is for:** seeing at a glance what happened, from which source, who is responsible, and how the capacity was being consumed at that instant.
| Column | Content |
| -------------------------------- | -------------------------------------------------------------------------------------------------------------------------------- |
| **Capacity** | Capacity name |
| **Change Type** | Pause, Resume, Scale up, or Scale down |
| **Source** | Manual, Schedule, or Auto-Scale |
| **SKU** | In scale changes, *previous SKU → target SKU*; in pause/resume, *previous state → new state* (for example, *Active → Suspended*) |
| **Date/Time** | Moment of execution |
| **Status** | Consumption situation of the capacity at the time of the action (table below) |
| **Total Capacity Units %** | Total CU consumption at the time of the action |
| **Interactive Capacity Units %** | Interactive portion |
| **Background Capacity Units %** | Background portion |
| **Configured by** | Who created the schedule or auto-scale rule that triggered the action; in manual actions, who clicked |
| **Result** | **Success** or **Failed** badge of the execution |
| **Notification** | Not Applicable, Sent, or Failed |
**Consumption status badges** (**Status** column; **Total Capacity Units %** uses the same color):
| Status | Total CU consumption |
| ------------- | ------------------------------------------------------- |
| **Idle** | below 20% |
| **Normal** | from 20% to less than 85% |
| **Saturated** | from 85% to less than 100% |
| **Critical** | 100% or more (SKU limit reached; *throttling* expected) |
**Special states:** with no results, *No governance actions found.* appears; if the query fails, *Failed to load capacity governance actions.* appears with the **Try again** button.
### Sorting, pagination, and shareable link
**What it is:** sorting by the **Capacity**, **Date/Time**, and **Result** titles, navigation through pages (10 actions by default, with the **Items per page** selector), and an address (URL) that saves the view.
**What it is for:** showing the most recent actions first (default), grouping by capacity, or bringing the failures together, and sending exactly that view to another administrator.
**How to use:**
1. Click the column title. The first click sorts in descending order and the second reverses it; the arrow next to the title indicates the direction.
2. Use the pagination in the footer to navigate. The total count appears as *{N} actions*. In the **Items per page** selector, choose **10**, **25**, **50**, or **100**; changing the number returns to the first page.
3. To share, copy the browser address and send it to another administrator.
**How it works:** the default is **Date/Time**, from newest to oldest. Filters, page, and sorting are saved in the page address, so reloading or opening the sent link shows the same view.
### Action details
**What it is:** the **Action Details** modal, opened by clicking a row (or selecting it with the keyboard and pressing Enter).
**What it is for:** seeing everything that was recorded about the attempt: people responsible, consumption sample used, message (on failures, the cause and how to fix it), state/SKU transition, and emails sent.
**How to use:**
1. Click the action row.
2. Read the fields. Close it with the **X**, the **Close** button, or by clicking outside the modal.
**Fields displayed** (fields with no value for that action do not appear):
| Field | Meaning |
| ------------------------------------------------------ | ------------------------------------------------------------------------------------------------------------------------ |
| **Capacity**, **Action**, **Source** | What was done, on which capacity, and from which source |
| **Schedule ID** | In schedule actions, the schedule that triggered the action |
| **Triggered By** | In manual actions, who clicked |
| **Configured By** | Who created the schedule or auto-scale rule |
| **Capacity Status** and CU percentages | Consumption at the time of the action |
| **Consumption Reading** | Time of the consumption sample used |
| **Execution Status** | Success or Failed |
| **Outcome** | *Executed* or *Already in Desired State* |
| **Message** | Reason for the action. On a failure, plain-language text: cause, how to fix it, technical detail and technical reference |
| **Previous State** / **New State** | Capacity state transition |
| **Previous SKU** / **Target SKU** | SKU transition (scaling) |
| **Executed At** | Date and time of execution |
| **Notify Platform Users** / **Notify Capacity Admins** | Who should be notified |
| **Notification Status** and **E-mails Sent** | Sending result and recipients (or *No e-mails sent*) |
### Hide data
**What it is:** the **Hide data** button, to the left of the **Export** button. Once turned on, it is renamed **Show data**.
**What it is for:** sharing the screen, taking a screenshot, or giving a demo without exposing the email addresses of the people who configured, triggered, or were notified about an action.
**How to use:** click **Hide data**. The email addresses in the **Configured by** column and, in the **Action Details** modal, the **Triggered By**, **Configured By**, and **E-mails Sent** fields are shown masked. To see the values again, click **Show data**.
**How it works:** the button is the same one used on the other Power Monitor screens: your choice applies to all of them and is remembered in this browser. The mask is visual only, a convenience for sharing the screen, and does not replace access control. Exported files are also masked while the button is on.
### Export
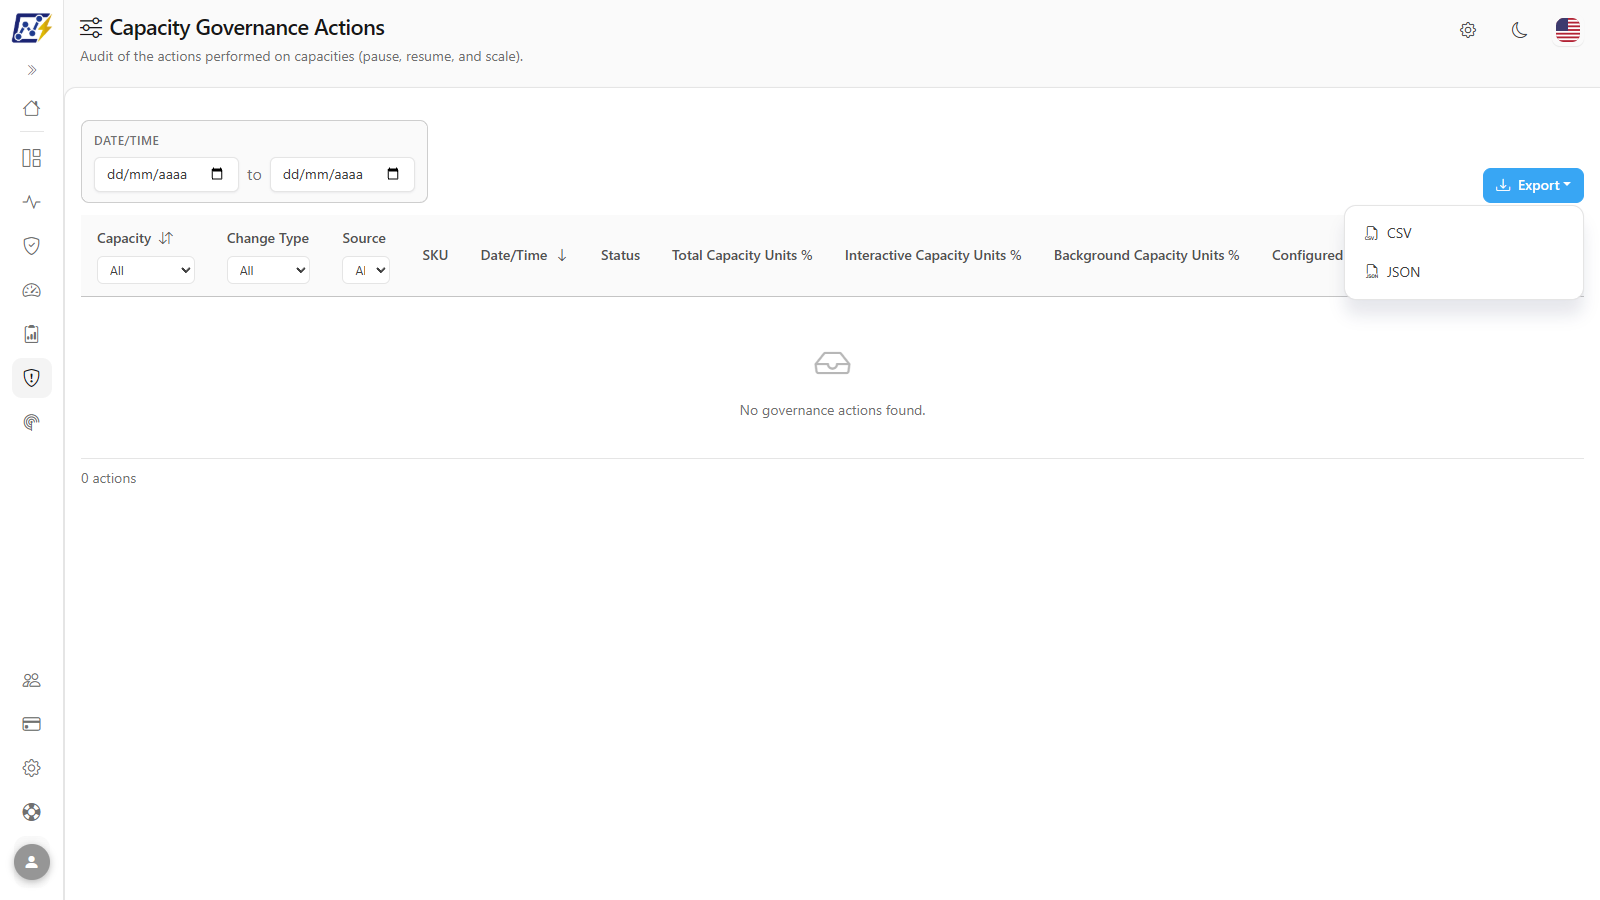
**What it is:** the **Export** button, to the right of the period filter, with the **CSV** and **JSON** options.
**What it is for:** attaching the evidence to an audit, a ticket, or a FinOps analysis outside the tool.
Export options
**How to use:**
1. Apply the desired filters and sorting.
2. Click **Export** and choose **CSV** or **JSON**.
3. The download starts automatically.
**How it works:** the file contains the filtered actions, in the same order as the screen, with up to 50,000 rows. With **Hide data** turned on, email addresses are masked in the file. If something goes wrong, *Failed to export data.* appears; if the file cannot be masked, it is not downloaded and *Could not mask the exported file. Show the data again or try once more.* appears.
## Rules and behavior
* **One row per attempt**, including failures and actions that did not need to be executed (*Already in Desired State*, for example, resuming a capacity that was already active).
* **People responsible.** *Triggered By* is filled in for manual actions; *Configured By*, for schedule and auto-scale actions, with the author of the rule **at the time of execution**: the record remains accurate even if the rule is edited or deleted later.
* **Consumption at the time of the action.** The most recent *Fabric Capacity Metrics App* sample from the **45 minutes** before the action is used. If there is no sample (metrics app not installed or consumption monitoring turned off for the capacity), the fields appear with "—"; the value is never estimated from older data.
* **Failures explained in plain language.** When an action fails, Power Monitor interprets the Azure response and turns it into a concise message, with no raw JSON, secrets or tokens. It recognizes the most common causes: missing Service Principal permission on the capacity, capacity, resource group or subscription not found, Azure call limit, another operation still running on the capacity, SKU unavailable in the region or Capacity Units quota exhausted, Azure timeout or unavailability, and invalid or expired credential. If the cause is not recognized, the message brings a short technical detail (up to 300 characters).
* **Failure e-mail and messages.** The e-mail for a capacity action that failed (and the Teams, Slack and Telegram cards, when the **Capacity Governance Actions** type is selected) always follows the same structure, written in Portuguese:
* a title, such as *Capacidade X: falha ao reduzir o SKU de F32 para F16* ("Capacity X: failed to reduce the SKU from F32 to F16"), and a sentence saying what did not complete, who triggered it (a user, a pause/resume schedule, a scheduled SKU change or Auto-Scale) and when;
* **What happened** (*O que aconteceu*): the classified cause;
* **How to fix** (*Como resolver*): one to three concrete steps;
* **Current state** (*Estado atual*): how the capacity is now (for example, *still active* or *the SKU is still F32*) and what happens on the next attempt: a schedule occurrence is not repeated automatically, Auto-Scale restarts its sustained-usage count and, for a manual action, you repeat the action in Governance › Capacities. On a timeout, the e-mail says it was not possible to confirm whether Azure applied the operation and asks you to check the capacity in the Azure Portal;
* **Technical detail** (*Detalhe técnico*): the error code, a short summary and the technical reference (correlation ID and time) to open a Microsoft ticket.
* **Execution in Azure.** Actions are executed by the Service Principal configured for the organization, with permission on the capacity resource in Azure. If the Service Principal is not configured, the attempt is recorded as a failure with the corresponding message.
* **Where actions are triggered.** Manual actions, schedules, and auto-scale rules are configured on the Governance capacities screen; this screen only records what happened.
* **Azure change history.** Changes made directly in the Azure portal (outside Power Monitor) do not appear here; check the capacity's **Change History** in [Governance › Infrastructure › Capacities](/en/power-monitor/governanca/infraestrutura/capacidades.md), which reads the Azure Activity Log.
## Step by step: common scenarios
Prerequisite for all steps: **Administrator** profile. Go to *Audit › Capacity Actions* (or through the **Capacities** menu). This screen only records the actions; to pause, resume, change the size (SKU), or create schedules and auto-scale rules, use [Governance › Infrastructure › Capacities](/en/power-monitor/governanca/infraestrutura/capacidades.md).
### How to find out who paused (or resumed) a capacity
Use it, for example, when a capacity was paused during month-end closing.
{% stepper %}
{% step %}
### Set the period
In the **Date/Time** field, above the table, enter the start date and the end date.
{% endstep %}
{% step %}
### Filter the capacity and the action
In the **Capacity** header, choose the capacity. In the **Change Type** header, choose **Pause** (or **Resume**).
{% endstep %}
{% step %}
### See the source and the person responsible
The **Source** column shows whether the action was **Manual**, by **Schedule**, or by **Auto-Scale**, and the **Configured by** column shows the person responsible (who created the rule or, in manual actions, who clicked).
{% endstep %}
{% step %}
### Open the detail
Click the row to see **Triggered By**, **Configured By**, the **Schedule ID**, the **Message**, and the state before and after the action.
{% endstep %}
{% endstepper %}
### How to evaluate whether auto-scale is acting at the right time
1. In the **Source** header, choose **Auto-Scale**.
2. Compare, on each row, the **Change Type** (*Scale up* or *Scale down*) with the **Status** and the **Total Capacity Units %** at the time of the action. A SKU increase with *Idle* status or a decrease with *Saturated* status deserves a review of the rule.
3. Open the detail to see **Consumption Reading** (the time of the consumption sample used) and the SKU transition (**Previous SKU** and **Target SKU**).
### How to find actions that failed
1. In the **Result** header, choose **Failed**.
2. Click each row and read the **Message** field. Instead of the raw Azure response, it brings the **cause** of the failure, **How to fix** (*Como resolver*), the **Technical detail** (code and a short summary) and, when available, the **Technical reference** to open a Microsoft ticket (for example, Service Principal not configured or without permission on the capacity resource).
3. Fix the cause and, if necessary, repeat the action in [Governance › Infrastructure › Capacities](/en/power-monitor/governanca/infraestrutura/capacidades.md).
### How to check whether the notifications were sent
1. In the **Notification** header, choose **Failed** (or **Sent**).
2. Open the detail: **Notify Platform Users** and **Notify Capacity Admins** show who should have been notified, and **E-mails Sent** lists the recipients.
3. To see the email itself (subject, error, provider), look for it in [Email Audit](/en/power-monitor/auditoria/auditoria-de-emails.md) by the same time.
## Frequently asked questions
The action appears as Success, but the capacity kept consuming background CU.
Background operations already in progress and Fabric *smoothing* may continue to be reflected in consumption for some time after the pause or SKU change.
The CU percentages appear with "—".
There was no Fabric Capacity Metrics App sample in the 45 minutes before the action, or consumption monitoring is turned off for that capacity. Actions recorded before this feature existed also have no consumption.
Someone paused the capacity through the Azure portal and it does not appear here.
This screen records only the actions performed by Power Monitor. For changes made directly in Azure, use the capacity's Change History in [Governance › Infrastructure › Capacities](/en/power-monitor/governanca/infraestrutura/capacidades.md).
## Related pages
* [Governance › Infrastructure › Capacities](/en/power-monitor/governanca/infraestrutura/capacidades.md): manual actions, schedules, auto-scale, and Azure history
* [Monitoring › Capacities](/en/power-monitor/monitoramento/capacidades.md): Capacity Units consumption
* [Email Audit](/en/power-monitor/auditoria/auditoria-de-emails.md): the notification emails sent
---
# Agent Instructions
This documentation is published with GitBook. GitBook is the documentation platform designed so that both humans and AI agents can read, navigate, and reason over technical content effectively. Learn more at gitbook.com.
## Querying This Documentation
If you need additional information that is not directly available in this page, you can query the documentation by asking a question.
Perform an HTTP GET request on the following URL with the `ask` and `goal` query parameters:
```
GET https://docs.powermonitor.com.br/en/power-monitor/auditoria/acoes-de-capacidade.md?ask=&goal=
```
`ask` is the immediate question: it should be specific, self-contained, and written in natural language.
`goal` is what the user is ultimately trying to achieve, the reason they need the answer. Sharing it helps GitBook give you a better, more relevant answer. A goal is most helpful when it describes the outcome the user wants rather than restating the question. For example, with `ask=how do I create an API token`, a goal like `automate deployments from our CI pipeline` lets GitBook tailor the answer to that use case.
The response will contain a direct answer to the question and relevant excerpts and sources from the documentation.
Use this mechanism when the answer is not explicitly present in the current page, you need clarification or additional context, or you want to retrieve related documentation sections.