> For the complete documentation index, see [llms.txt](https://docs.powermonitor.com.br/llms.txt). Markdown versions of documentation pages are available by appending `.md` to page URLs; this page is available as [Markdown](https://docs.powermonitor.com.br/en/power-monitor/auditoria/assinaturas-de-e-mail.md).
# E-mail Subscriptions
Find out which Power BI reports and dashboards have a scheduled e-mail subscription, how many subscribers each one has, how many are from an external domain, and review the history of subscription run
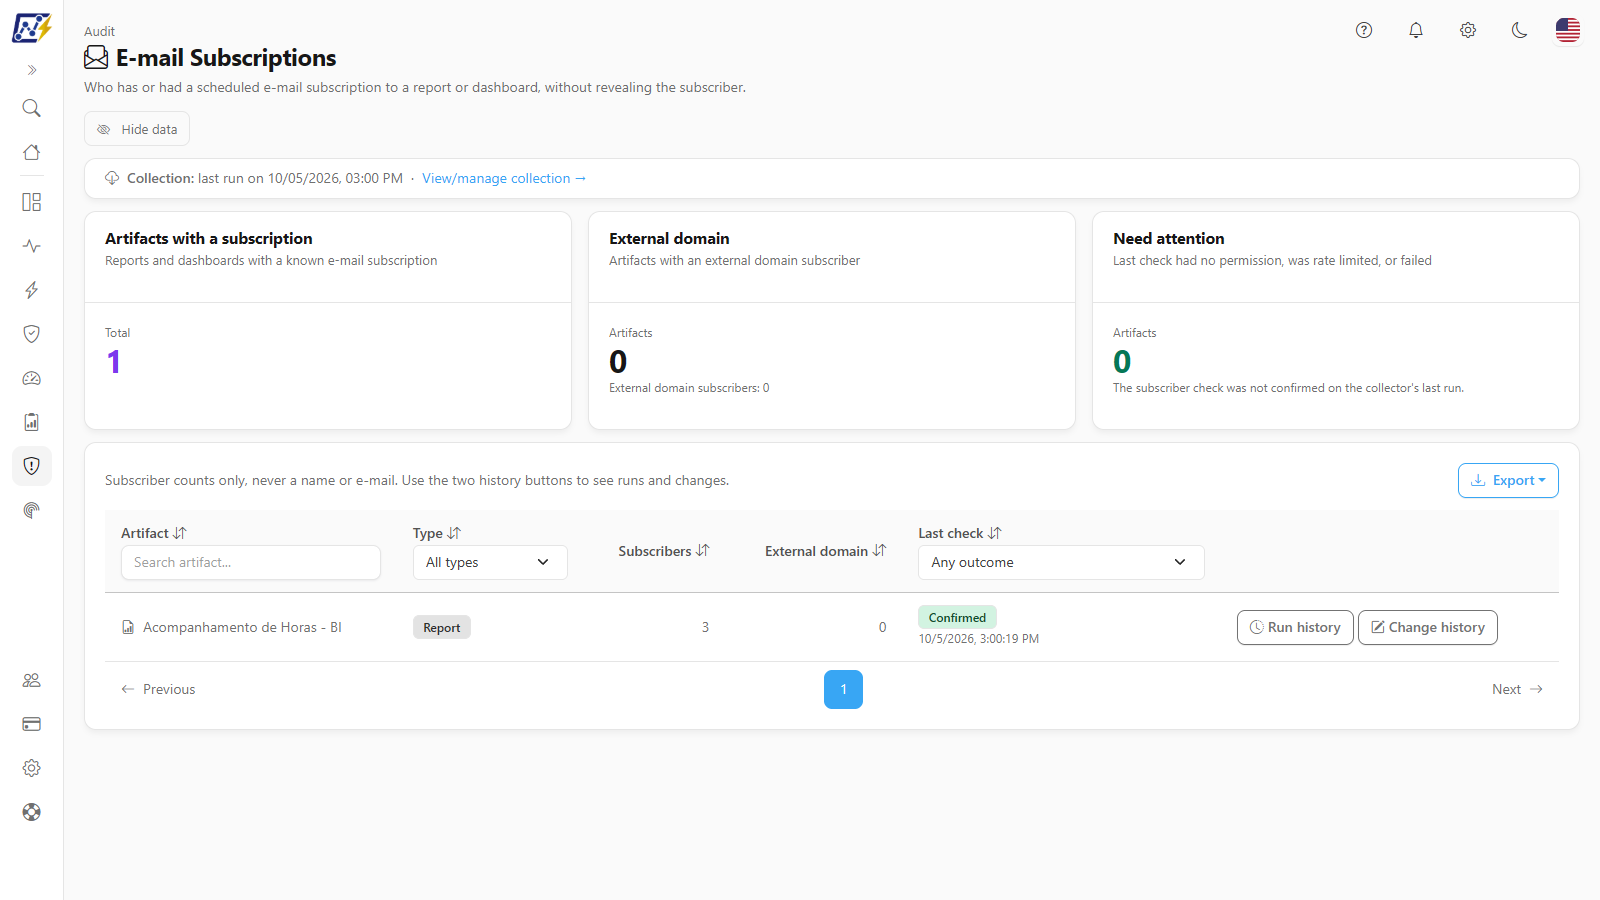
The **E-mail Subscriptions** screen lists the Power BI **reports** and **dashboards** that have (or had) a **scheduled e-mail subscription**: the Power BI *Subscribe* feature, which periodically sends a snapshot of the content by e-mail. For each artifact, the screen shows **how many subscribers** there are, **how many are from an external domain**, and the result of the last check. Two histories per row show **when the subscriptions were sent** and **who created, changed or deleted** each subscription.
The screen **never shows subscribers' names or e-mail addresses**, only counts (*Subscriber counts only, never a name or e-mail. Use the two history buttons to see runs and changes.*).
**How to access:** *Audit › E-mail Subscriptions*. Viewing is available to all profiles. The screen is read-only; the collection (**Run now**, **Pause** and the run history) is controlled in [Mapping › E-mail Subscriptions](/en/power-monitor/mapeamento/assinaturas-de-email.md), which is exclusive to **Administrators**. An administrator can block this page for specific users in [Users](/en/power-monitor/usuarios.md).
E-mail Subscriptions
## What it is for
An e-mail subscription delivers a report's content **outside Power BI**, into the recipient's inbox, without a new permission check on each send. Over time, subscriptions created for people who changed departments, for distribution lists or for **external addresses** go unnoticed.
This screen answers:
* **Which reports and dashboards are sent by e-mail**, and to how many people?
* **Are any of them sent outside the organization** (external domain)?
* **When** were the subscriptions sent, and **who** created, changed or deleted them?
Typical use cases: reviewing data leakage by e-mail (LGPD), cleaning up old subscriptions, investigating an improper send, and checking before turning off the tenant setting that allows subscriptions for external users (see [Tenant Settings](/en/power-monitor/governanca/tenant/configuracoes-do-tenant.md)).
## Features
### Artifacts with a subscription card
**What it is:** the first card (*Reports and dashboards with a known e-mail subscription*), with the **Total** number of artifacts in the list.
**What it is for:** knowing the size of the universe of content distributed by e-mail.
E-mail subscription indicators
**How it works:** the cards consider the entire list and **do not change** with the table filters. The total includes artifacts whose last check no longer found a subscription (**No subscription on last check**).
### External domain card
**What it is:** the *Artifacts with an external domain subscriber* card, with the number of **Artifacts** that have at least one external subscriber and the footer *External domain subscribers: {n}* (the sum of external subscribers across all artifacts).
**What it is for:** measuring how much content leaves the organization by e-mail.
**How to use it:** if the card is yellow (value greater than zero), sort the table by the **External domain** column (largest to smallest) to see the artifacts with the most external subscribers first.
**How it works:** each artifact's "home domain" is the most frequent e-mail domain among its subscribers; the other domains count as external. With few subscribers (for example, a single external subscriber), this classification may not reflect the organization's actual domain. Use the number as an indicator for review.
### Need attention card
**What it is:** the *Last check had no permission, was rate limited, or failed* card, with the number of **Artifacts** and the footer *The subscriber check was not confirmed on the collector's last run.*
**What it is for:** knowing whether the numbers on the screen are complete. An artifact in this situation may have subscribers that were not counted.
**How to use it:** if the card is red, filter the **Last check** column by **No permission to check**, **Rate limited** or **Check failed** to see which artifacts they are. See the reason in [Mapping › E-mail Subscriptions](/en/power-monitor/mapeamento/assinaturas-de-email.md) (**Collection runs** card › **View failures**, Administrators only). With zero artifacts, the card turns green.
### Filters and search
**What it is:** the filters in the table header: *Search artifact...* (**Artifact** column), **Type** (*All types*, **Report**, **Dashboard**) and **Last check** (*Any outcome* or one of the five outcomes).
**What it is for:** isolating dashboards, a specific report or the artifacts with a check problem.
Filters in the table header
**How to use it:**
1. In *Search artifact...*, type part of the report or dashboard name. The list is filtered right after you stop typing.
2. In **Type**, choose **Report** or **Dashboard**.
3. In **Last check**, choose an outcome (for example, **Confirmed**).
4. To clear, delete the search text and set the filters back to *All types* and *Any outcome*.
**How it works:** the filters are combined (all of them must be met) and each change takes the list back to the first page. The filters also define what is exported.
### Artifact list
**What it is:** the table with one report or dashboard per row, 10 per page by default (the **Items per page** selector in the footer offers 10, 25, 50 and 100).
**What it is for:** seeing, for each artifact, the reach of its subscriptions and the status of the last check.
Artifacts with an e-mail subscription
| Column | Content |
| ------------------- | --------------------------------------------------------------------------------------------------- |
| **Artifact** | Type icon and name of the report or dashboard (*Not provided* when the name could not be retrieved) |
| **Type** | **Report** or **Dashboard** |
| **Subscribers** | Number of recipients across all of the artifact's subscriptions |
| **External domain** | How many of these recipients are from an external domain (highlighted when greater than zero) |
| **Last check** | Badge with the result of the last check and, below it, the date and time of the check |
| (actions) | **Run history** and **Change history** buttons |
**Last check outcomes:**
| Badge | Meaning |
| ---------------------------------------- | ------------------------------------------------------------------------------------------------------------ |
| **Confirmed** (green) | Power BI confirmed subscription(s) on the artifact; the counts are up to date |
| **No subscription on last check** (gray) | The artifact no longer has a subscription (it was deleted) or the artifact no longer exists |
| **No permission to check** (red) | The Service Principal does not have permission to query the subscriptions |
| **Rate limited** (yellow) | Power BI rejected the query due to the admin API call limit; it will be checked again in the next collection |
| **Check failed** (red) | Error in the query; it will be checked again in the next collection |
**How to use it:**
1. Click a column title (**Artifact**, **Type**, **Subscribers**, **External domain** or **Last check**) to sort; click again to reverse. **Last check** sorts by the check outcome. When the screen opens, the list is sorted by the date of the last check, from most recent to oldest.
2. Use the pagination below the table to navigate.
**How it works:** when the check is not confirmed (no permission, rate limited or failed), that artifact's counts appear as zero until the next successful check. With no artifacts, *No artifact with an e-mail subscription found* is displayed.
### Run history
**What it is:** the **Run history** button on the row, which opens a modal with the artifact name and the list of **sends** of its subscriptions (**Subscription run**).
**What it is for:** confirming whether and when the content was sent by e-mail, and whether the sends succeeded.
**How to use it:**
1. On the artifact's row, click **Run history**.
2. Read each entry: operation, date and time, **By** (the account associated with the send in the activity log) and the **Success** or **Failure** badge.
3. Close it with the **X**, the **Esc** key or by clicking outside the modal.
**How it works:**
* The entries come from the Power BI/Fabric activity log collected by Power Monitor, in chronological order (oldest to most recent). The available period is the same one retained in [Events Overview](/en/power-monitor/auditoria/geral-de-eventos.md).
* When the log does not report the result, the badge is displayed as **—**.
* With no events, *No event found for this artifact.* is displayed. If the query fails, *Could not load the history right now.* is displayed with the **Try again** button.
### Change history
**What it is:** the **Change history** button on the row, which opens the same modal with the **Subscription created**, **Subscription changed** and **Subscription deleted** operations.
**What it is for:** knowing **who** created, edited or deleted an artifact's subscriptions and **when**, for example to find the person responsible for a subscription with an external recipient.
**How to use it:**
1. On the artifact's row, click **Change history**.
2. Read the operation, the date and time and, under **By**, who made the change.
3. Close the modal.
**How it works:** **By** identifies who **created, changed or deleted** the subscription, never the subscribers. Operations that Power Monitor does not recognize appear as **Unknown operation**. The other rules are the same as for **Run history**.
### Hide data
**What it is:** the **Hide data** button, next to **Export**. Once on, it shows **Show data**.
**What it is for:** sharing the screen, recording demos or taking screenshots without exposing people.
**How to use:** click **Hide data**: the identifier of whoever made each change in the **Change history** (the **By** field) are masked on screen and in exported files. To see the values again, click **Show data**. If the file cannot be masked, the download is stopped and the screen warns *Could not mask the exported file. Show the data again or try once more.* The choice is saved in the browser and applies to the other screens that have the button. It is a presentation convenience, not an access control.
### Export
**What it is:** the **Export** button, above the table, with the **CSV** and **JSON** options.
**What it is for:** recording the subscription survey for an access review or sharing it with the security team.
**How to use it:**
1. Apply the filters you want.
2. Click **Export** and choose **CSV** or **JSON**.
**How it works:** the file contains **all** filtered rows (not only the visible page), in the current sort order. The CSV includes **Artifact**, **Type**, **Subscribers**, **External domain**, **Last check** and **Last checked at**. No subscriber data is exported. The button is disabled when the list is empty.
### Collection
**What it is:** the **Collection** line, at the top of the screen, which shows the status of the last subscription check run (*last run on \[date]*, *running since \[date]*, *last run on \[date], failed* or *no run recorded*). For Administrators, it includes the **View/manage collection →** link.
**What it is for:** confirming at a glance that the daily check is running and going straight to the page that controls the collection, for example to check a newly created subscription right away or to investigate why an artifact ended up in **Need attention**.
**How to use (Administrator):**
1. Click **View/manage collection →** to open [Mapping › E-mail Subscriptions](/en/power-monitor/mapeamento/assinaturas-de-email.md).
2. Click **Run now**. Follow the **Run in progress** badge; to stop it, use **Pause** and then **Resume**.
3. When the run shows as **Completed**, come back to this screen and reload the page to see the updated list.
**How it works:** other profiles see only the status, without the link. The check is daily and automatic, at 10:00 (Brasília time). To respect the call limit of your tenant's Power BI admin API, the collection waits about **25 seconds** between one artifact and the next; with many artifacts, the run can take several minutes. The run history (**Trigger**, **Started**, **Finished**, **Duration**, **Status**, **Items processed**, **Failures** and **Error**) is on the Mapping page, not on this screen.
### Error state
**What it is:** when the screen cannot load, an error card is displayed in place of the content: *Finish the installation to use this audit* (Service Principal not configured, with the **Go to Settings** button for Administrators) or *Could not load the audit*.
**How to use it:** click **Try again**.
## Rules and behavior
* **How artifacts are found:** the collection searches the Power BI/Fabric activity log for the **last 30 days** for e-mail subscription **creation** and **change** events. Each report or dashboard with these events is checked in the Power BI admin API, which returns the subscriptions and recipients. Artifacts whose most recent event in the period is the **deletion** of a subscription are no longer checked (the row keeps the result of the last check performed).
* **Prerequisite:** activity event collection must be enabled in [Settings › Audit](/en/power-monitor/configuracoes/auditoria.md). Without it, no artifact is found.
* **Limitation:** a subscription created or changed **before** the 30 days checked, and not changed since then, only appears if it has already been checked in a previous collection. The list is a survey based on recent activity, not a complete inventory of all subscriptions in the tenant.
* **Required permission:** the same Power BI read-only admin API permission used by the scans. Without it, artifacts appear as **No permission to check**. See [Additional Permissions](/en/power-monitor/configuracoes/permissoes-adicionais.md).
* **Frequency:** daily, at **10:00** (Brasília time, UTC-3), for organizations with a Service Principal configured. The **Run now** button in [Mapping › E-mail Subscriptions](/en/power-monitor/mapeamento/assinaturas-de-email.md) lets you check immediately.
* **Privacy:** subscriber names and e-mail addresses are neither stored nor displayed by Power Monitor; only the counts. In the histories, **By** shows who performed the operation, according to the activity log.
* **Dates** are displayed in your browser's time zone.
{% hint style="warning" %}
The histories show the account of whoever created, changed or deleted subscriptions. When exporting or sharing screenshots of this screen, treat this information with the same care you would give customer data.
{% endhint %}
## How to use: common tasks
### How to find content sent by e-mail outside the organization
{% stepper %}
{% step %}
### Read the External domain card
In *Audit › E-mail Subscriptions*, see how many artifacts have an external subscriber and the total number of external subscribers.
{% endstep %}
{% step %}
### Sort by the External domain column
Click the **External domain** title until the list is sorted from largest to smallest.
{% endstep %}
{% step %}
### Find out who is responsible
On the artifact's row, click **Change history** and see, under **By**, who created or changed the subscription.
{% endstep %}
{% step %}
### Handle it in Power BI
With the person responsible, review the subscription in Power BI (the report's or dashboard's **Subscribe** menu) and remove the improper recipients. To prevent new cases, assess the tenant setting for subscriptions to external users in [Tenant Settings](/en/power-monitor/governanca/tenant/configuracoes-do-tenant.md).
{% endstep %}
{% endstepper %}
### How to check whether a subscription is being sent
1. Find the artifact with *Search artifact...*.
2. Click **Run history** and check the most recent **Subscription run** entries and the **Success** or **Failure** badge.
### How to resolve artifacts in "Need attention"
1. Filter the **Last check** column by **No permission to check**, **Rate limited** or **Check failed**.
2. In [Mapping › E-mail Subscriptions](/en/power-monitor/mapeamento/assinaturas-de-email.md), on the **Collection runs** card, click **View failures** on the most recent run to read the reason (Administrators only).
3. **No permission:** confirm the Service Principal's admin API permission. **Rate limited** or **Failed:** wait for the next collection or, if you are an Administrator, click **Run now** in [Mapping › E-mail Subscriptions](/en/power-monitor/mapeamento/assinaturas-de-email.md) later.
## Frequently asked questions
Why doesn't the screen show who receives the subscriptions?
For privacy reasons, Power Monitor stores and displays only the number of subscribers and of external domain subscribers. To see the recipients, open the subscription in Power BI itself.
I created a subscription and it does not appear.
The subscription is found through the creation event in the activity log. Wait for the next activity event collection and the daily subscription check (10:00, Brasília time); an Administrator can bring the check forward with **Run now** in [Mapping › E-mail Subscriptions](/en/power-monitor/mapeamento/assinaturas-de-email.md), once the creation event has already been collected.
An artifact appears with 0 subscribers.
Check the badge under **Last check**. **No subscription on last check** indicates that the subscription was deleted (or the artifact no longer exists). **No permission to check**, **Rate limited** and **Check failed** indicate that the count could not be confirmed in that check.
Does the screen show a workspace column?
No. The screen identifies the artifact by name and type. To find the workspace, search for the artifact in [Reports](/en/power-monitor/governanca/relatorios.md) or [Dashboards](/en/power-monitor/governanca/relatorios/dashboards.md).
## Related pages
* [Audit](/en/power-monitor/auditoria.md)
* [Events Overview](/en/power-monitor/auditoria/geral-de-eventos.md)
* [Direct Sharing](/en/power-monitor/auditoria/compartilhamento-direto.md)
* [Mapping › E-mail Subscriptions](/en/power-monitor/mapeamento/assinaturas-de-email.md) (manual collection and run history)
* [Tenant Settings](/en/power-monitor/governanca/tenant/configuracoes-do-tenant.md)
* [Settings › Audit](/en/power-monitor/configuracoes/auditoria.md)
* [Additional Permissions](/en/power-monitor/configuracoes/permissoes-adicionais.md)
---
# Agent Instructions
This documentation is published with GitBook. GitBook is the documentation platform designed so that both humans and AI agents can read, navigate, and reason over technical content effectively. Learn more at gitbook.com.
## Querying This Documentation
If you need additional information that is not directly available in this page, you can query the documentation by asking a question.
Perform an HTTP GET request on the following URL with the `ask` and `goal` query parameters:
```
GET https://docs.powermonitor.com.br/en/power-monitor/auditoria/assinaturas-de-e-mail.md?ask=&goal=
```
`ask` is the immediate question: it should be specific, self-contained, and written in natural language.
`goal` is what the user is ultimately trying to achieve, the reason they need the answer. Sharing it helps GitBook give you a better, more relevant answer. A goal is most helpful when it describes the outcome the user wants rather than restating the question. For example, with `ask=how do I create an API token`, a goal like `automate deployments from our CI pipeline` lets GitBook tailor the answer to that use case.
The response will contain a direct answer to the question and relevant excerpts and sources from the documentation.
Use this mechanism when the answer is not explicitly present in the current page, you need clarification or additional context, or you want to retrieve related documentation sections.