> For the complete documentation index, see [llms.txt](https://docs.powermonitor.com.br/llms.txt). Markdown versions of documentation pages are available by appending `.md` to page URLs; this page is available as [Markdown](https://docs.powermonitor.com.br/en/power-monitor/auditoria/eventos-da-aplicacao.md).
# Application Events
Audit trail of Power Monitor itself: sign-ins, pages accessed, installation and consents, configuration changes and privacy operations made in your organization.
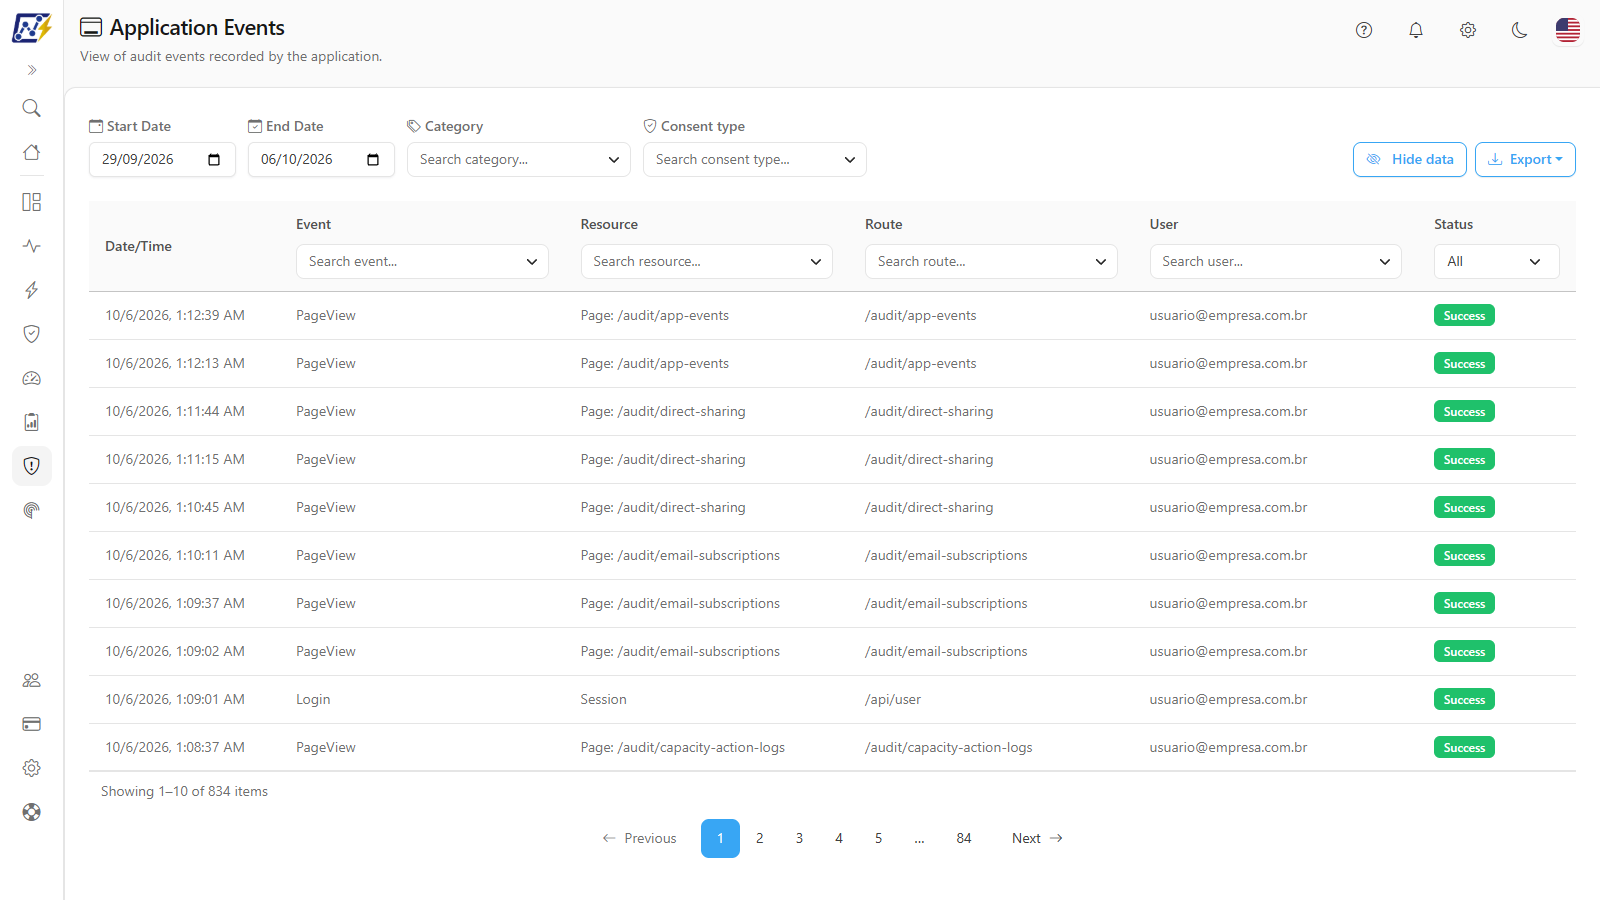
The **Application Events** screen records what the users of your organization did **inside Power Monitor**: who signed in to the platform, which pages they accessed, who did the installation and gave each consent, and which settings they changed (users, profiles, monitoring, notifications, metrics source, Service Principal, Power Embedded integration, audit collection, performance assessments, AI settings). It also records, in the privacy category, who turned on behavioral risk and who queried that data. It is the audit of the governance tool itself.
**How to access:** *Audit › Application Events*. Available to all profiles (read-only).
Events recorded by Power Monitor itself
## What it is for
* **Tracking configuration changes**: who turned off monitoring of a gateway, who changed the capacity metrics source, who changed the Power Embedded integration key.
* **User management**: who created, changed, or deleted users and who assigned profiles.
* **Tool adoption**: which users access Power Monitor and which pages they use.
* **Investigation**: reconstructing a user's sequence of actions (the export also includes the IP, the HTTP method, the failure reason, and the trace identifier of each event).
## Features
### Period filter (Start Date and End Date)
**What it is:** the **Start Date** and **End Date** fields, above the table.
**What it is for:** delimiting the window in which the change or access happened.
Period and export
**How to use:**
1. In **Start Date**, choose the first day (default: 7 days ago).
2. In **End Date**, choose the last day (default: today).
3. The list is updated automatically and goes back to the first page.
**How it works:** the day is considered in full, in your browser's time zone. To restore the default period, reload the page.
### Category and Consent type filters
**What it is:** two multi-select fields with search, next to the dates: **Category** (*Search category...*) and **Consent type** (*Search consent type...*).
**What it is for:** quickly separating **installation and consent** events, which prove who accepted the terms and who clicked each permission, from the rest.
Category and Consent type filters
**How to use:**
1. Click **Category** and select one or more categories (for example, *Consent* for permission consents, *Onboarding* for the installation, *Configuration* for Service Principal changes and *Privacy* for privacy operations). The options are the categories that exist in your organization's events.
2. To see only one consent type, use **Consent type** and select, for example, *Graph*, *PowerBi*, *TeamsApp*, *PowerBiDataset*, *Fabric* or *AzureCost*. The filter lists the resource identifiers of the events, which in consents correspond to the type of the permission.
3. To select all visible options at once, click **Select all** (when all of them are selected, the link becomes **Deselect all**).
4. To remove the selection, click the **X** next to the field.
**How it works:** the category and consent type lists are loaded in full when the screen opens. When you open the field, all options are already there, and the text typed in **Search...** filters the list instantly. **Select all** only selects the visible options, so it respects the search. If loading the lists fails, the field goes back to searching on the server. Each change refreshes the event list and returns to the first page. Both filters also apply to the export.
### Event, Resource, Route, and User filters
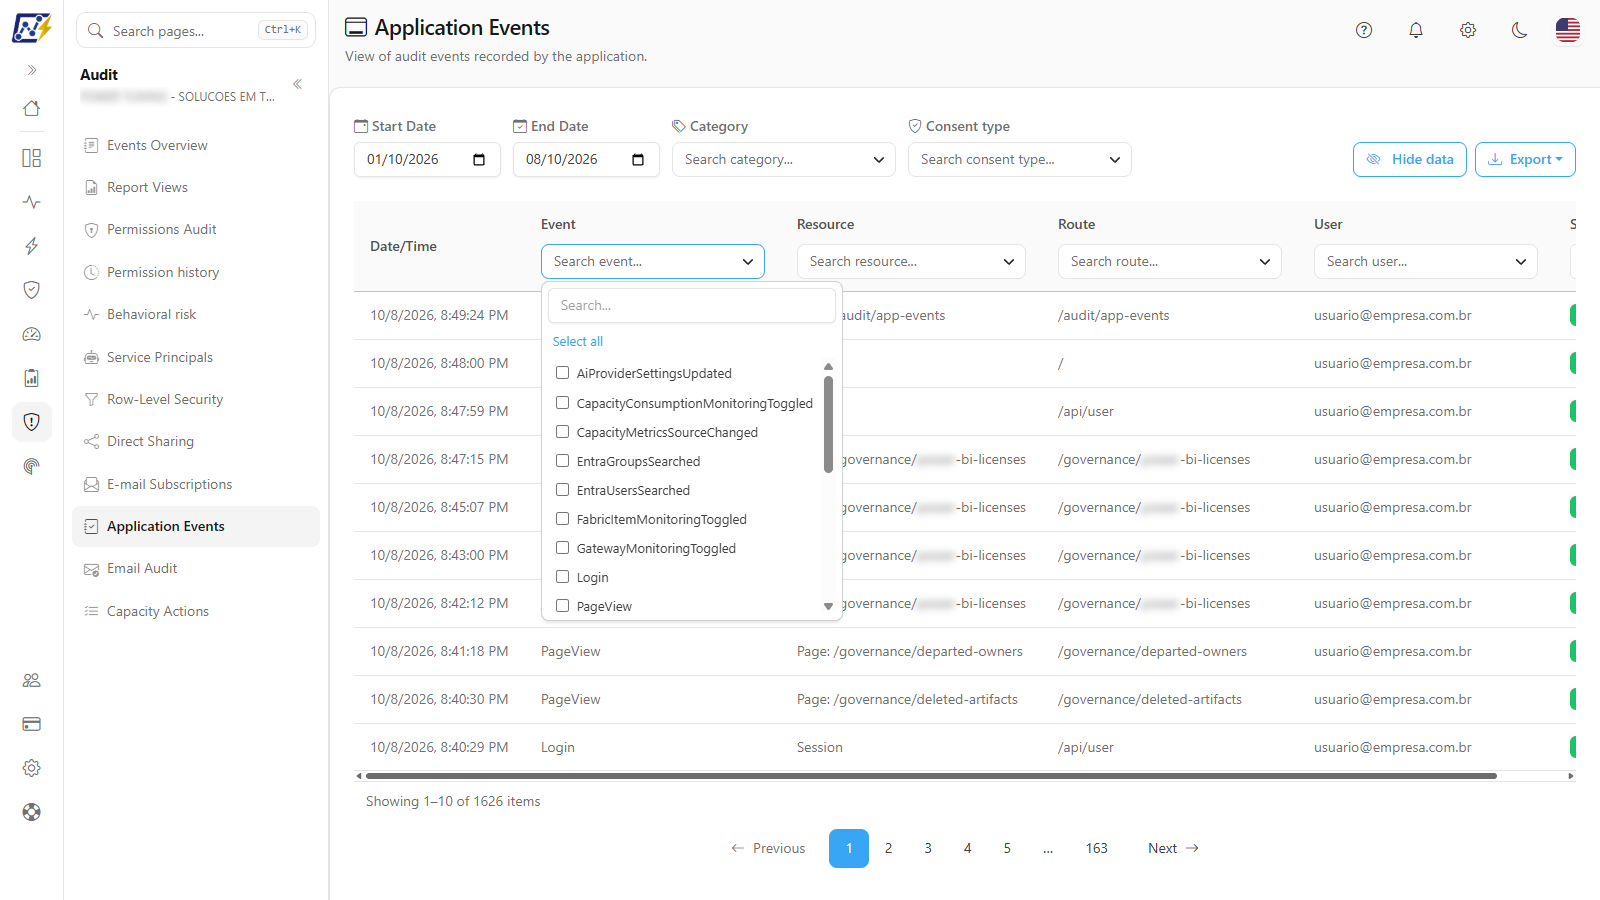
**What it is:** multi-select fields with search, in the header of the **Event**, **Resource**, **Route**, and **User** columns.
**What it is for:** isolating a type of change (for example, `GatewayMonitoringToggled`), everything a person did, or who opened a certain page.
Multi-select with search in the Event header
**How to use:**
1. Click the header field (*Search event...*, *Search resource...*, *Search route...*, or *Search user...*).
2. In **Event**, the full list of events is already shown when you open the field: type in the **Search...** box to filter it instantly and use **Select all** to select all visible options. In **Resource**, type from 1 character; in **Route** and **User**, from 2.
3. Select one or more options. The field then shows *{N} selected*.
4. To remove the selection, click the **X** next to the field.
**How it works:** the **Event** list is loaded in full when the screen opens (if loading fails, the field goes back to searching on the server from 1 character). **Resource**, **Route** and **User** search on the server. All of them only offer values that exist in your organization's events. Each change updates the list and goes back to the first page. This screen **does not have** a *Clear filters* button: remove each filter with the **X**.
### Status filter
**What it is:** the **Status** box in the header of the last column, with the options **All**, **Success**, and **Failed**.
**What it is for:** seeing only the actions that were not completed (for example, denied change attempts).
**How to use:** choose **Failed** (or **Success**). To go back, choose **All**. The reason for each failure is available in the export (*Failure reason* column).
### Event list
**What it is:** the table with one event per row, from newest to oldest, with 10 events per page by default (**Items per page** selector: 10, 25, 50 or 100) and the footer *Showing {from}–{to} of {total} items*.
**What it is for:** reconstructing the sequence of what happened in Power Monitor, who signed in, what they opened, and what they changed.
| Column | Content |
| ------------- | ----------------------------------------------------------------------------------------------------------------------------------------- |
| **Date/Time** | Moment of the event, in your time zone |
| **Event** | Event type (table below) |
| **Resource** | Type of affected resource (for example, `Page`, `Session`, `User`, `GatewayMonitoring`), followed by the resource identifier when present |
| **Route** | Page or address accessed |
| **User** | Email of the person who performed it |
| **Status** | Green **Success** or red **Failed** badge |
**How it works:** the columns cannot be sorted and the rows do not open a detail; use the pagination in the footer to navigate and the export to see the additional fields.
#### Main events recorded
| Event | When it is recorded |
| ------------------------------------------------------------------------------------------------------------------------------------------------------------------- | ------------------------------------------------------------------------------------------------------------------------------------------------------------------------------------------------------ |
| `Login` | User signed in to the platform |
| `PageView` | User opened a Power Monitor page |
| `UserCreated`, `UserUpdated`, `UserDeleted` | User registration, change, or deletion (including workspace scope) |
| `UserProfileAssigned` | Profile assigned to a user |
| `SemanticModelMonitoringToggled`, `GatewayMonitoringToggled`, `FabricItemMonitoringToggled`, `CapacityConsumptionMonitoringToggled`, `MonitoringScanSettingToggled` | Turning monitoring and collections on/off |
| `SemanticModelRefreshRetryConcurrencyChanged` | Change to the concurrency of refresh retries |
| `CapacityMetricsSourceChanged` | Change to the capacity metrics source |
| `NotificationSettingToggled` | Change to notification recipients |
| `PowerEmbeddedApiKeyUpdated` | Change to the Power Embedded integration key |
| `ScheduleChanged` | Change to the collection of audit events |
| `PerformanceAssessmentAiSuggestionGenerated` | Generation of an AI suggestion in a performance assessment |
| AI configuration events | Changes to the organization's AI settings |
| `OrganizationCreated`, `TermsOfUseAccepted` | Creation of the organization and acceptance of the terms of use during installation (category *Onboarding*) |
| `AutomaticBillingConsentAccepted`, `AutomaticBillingConsentRefused` | Acceptance or refusal of the automatic billing consent after the trial period (*Onboarding*) |
| `PermissionConsentRequested`, `PermissionGranted` | Permission consent requested in the installation wizard and permission granted in Additional Permissions; the **Consent type** (for example, *Graph*, *PowerBi*) is stored in the resource (*Consent*) |
| `ServicePrincipalCredentialsChanged`, `ServicePrincipalChanged`, `ServicePrincipalSecretChanged`, `SecurityGroupChanged`, `ServicePrincipalNameChanged` | Installation or change of the Service Principal, its secret, security group or name (the secret is never stored) |
| `BehaviorRiskScoringChanged`, `BehaviorRiskNetworkSignalsChanged`, `BehaviorRiskViewed` | Turning behavioral risk and network signals on or off, and every query to the ranking or to a person's history (*Privacy*) |
### Hide data
**What it is:** the **Hide data** button, next to **Export**. When on, user e-mails (the **User** column) and the e-mails that appear in **Resource** and **Route** are masked on screen and in exports, useful for sharing screenshots without exposing identities. The choice is saved in the browser and applies to the other screens with the button.
### Export
**What it is:** the **Export** button, to the right of the date fields, with the **CSV** and **JSON** options.
**What it is for:** investigating in detail (IP, HTTP method, failure reason) or keeping evidence of who changed what.
**How to use:**
1. Set the period and the header filters, the export uses exactly the same filters.
2. Click **Export** and choose **CSV** or **JSON**.
3. Open the downloaded file.
**How it works:** the file (up to 50,000 rows) includes, in addition to the screen's columns, the category, the type and the identifier of the resource, the HTTP method, the IP, the failure reason, and the trace identifier (*TraceId*). If the audit storage is unavailable, the export is not generated and *Failed to export data.* appears.
## Rules and behavior
* **Real-time recording.** Events are stored at the moment of the action; there is no periodic collection.
* **Partial data.** If the audit storage is temporarily unavailable, the screen shows the **Partial data** notice and displays what is possible; in this case, the export is not generated.
* **Scope.** The screen shows the events of the entire organization (it is not filtered by workspace scope).
* **Error and initial setup pages** (not found, not authorized, installation) do not generate `PageView`.
## Step by step: common scenarios
All the steps start from *Audit › Application Events* and are available to any profile (the screen is read-only).
### How to find out who changed a setting
Use it, for example, to find out who turned off monitoring of a gateway or changed the capacity metrics source.
{% stepper %}
{% step %}
### Adjust the period
Set **Start Date** and **End Date** covering the likely moment of the change.
{% endstep %}
{% step %}
### Filter the event
In the **Event** header, type part of the name (for example, `Gateway` or `Toggled`) and select the corresponding event type, such as `GatewayMonitoringToggled` (see the **Main events recorded** table, in [Event list](#event-list)).
{% endstep %}
{% step %}
### Identify the author
The **User** column shows who made the change, the **Date/Time** column shows when, and the **Resource** column shows the type and identifier of the changed item. The **Status** column indicates whether the change was completed (**Success**) or not (**Failed**).
{% endstep %}
{% endstepper %}
### How to follow what a user did on the platform
1. In the **User** header, type at least 2 characters of the email and select the user.
2. Adjust the period.
3. Read the sequence of events: `Login` (sign-in to the platform), `PageView` (pages opened, with the **Route**), and the configuration change events.
### How to see who accessed a Power Monitor page
1. In the **Event** header, select `PageView`.
2. In the **Route** header, type at least 2 characters of the page address (for example, `audit` or `settings`) and select the desired routes.
3. The **User** column shows who opened the page and when.
## Frequently asked questions
I want to know who changed a monitoring setting.
Filter the **Event** by the corresponding type (for example, `GatewayMonitoringToggled`) and adjust the period. The **User** column shows who made the change.
I want to prove who accepted the terms of use or gave a permission consent.
Filter **Category** by *Onboarding* (for `TermsOfUseAccepted` and organization creation) or by *Consent* (for `PermissionConsentRequested` and `PermissionGranted`) and, if you want, **Consent type** (for example, *Graph*). The **User** column shows who did it and **Date/Time** when.
The difference between this screen and Events Overview.
[Events Overview](/en/power-monitor/auditoria/geral-de-eventos.md) shows what happens in **Power BI/Fabric** (Microsoft data). This screen shows what happens **in Power Monitor**.
## Related pages
* [Events Overview](/en/power-monitor/auditoria/geral-de-eventos.md)
* [Behavioral risk](/en/power-monitor/auditoria/risco-comportamental.md)
* [Users](/en/power-monitor/usuarios.md)
* [Settings](/en/power-monitor/configuracoes.md)
---
# Agent Instructions
This documentation is published with GitBook. GitBook is the documentation platform designed so that both humans and AI agents can read, navigate, and reason over technical content effectively. Learn more at gitbook.com.
## Querying This Documentation
If you need additional information that is not directly available in this page, you can query the documentation by asking a question.
Perform an HTTP GET request on the following URL with the `ask` and `goal` query parameters:
```
GET https://docs.powermonitor.com.br/en/power-monitor/auditoria/eventos-da-aplicacao.md?ask=&goal=
```
`ask` is the immediate question: it should be specific, self-contained, and written in natural language.
`goal` is what the user is ultimately trying to achieve, the reason they need the answer. Sharing it helps GitBook give you a better, more relevant answer. A goal is most helpful when it describes the outcome the user wants rather than restating the question. For example, with `ask=how do I create an API token`, a goal like `automate deployments from our CI pipeline` lets GitBook tailor the answer to that use case.
The response will contain a direct answer to the question and relevant excerpts and sources from the documentation.
Use this mechanism when the answer is not explicitly present in the current page, you need clarification or additional context, or you want to retrieve related documentation sections.