> For the complete documentation index, see [llms.txt](https://docs.powermonitor.com.br/llms.txt). Markdown versions of documentation pages are available by appending `.md` to page URLs; this page is available as [Markdown](https://docs.powermonitor.com.br/en/power-monitor/auditoria/geral-de-eventos.md).

# Events Overview

All Power BI and Fabric activity events in your tenant, views, edits, deletions, sharing, refreshes, Copilot, and administration, with filters by category, operation, user, and city.

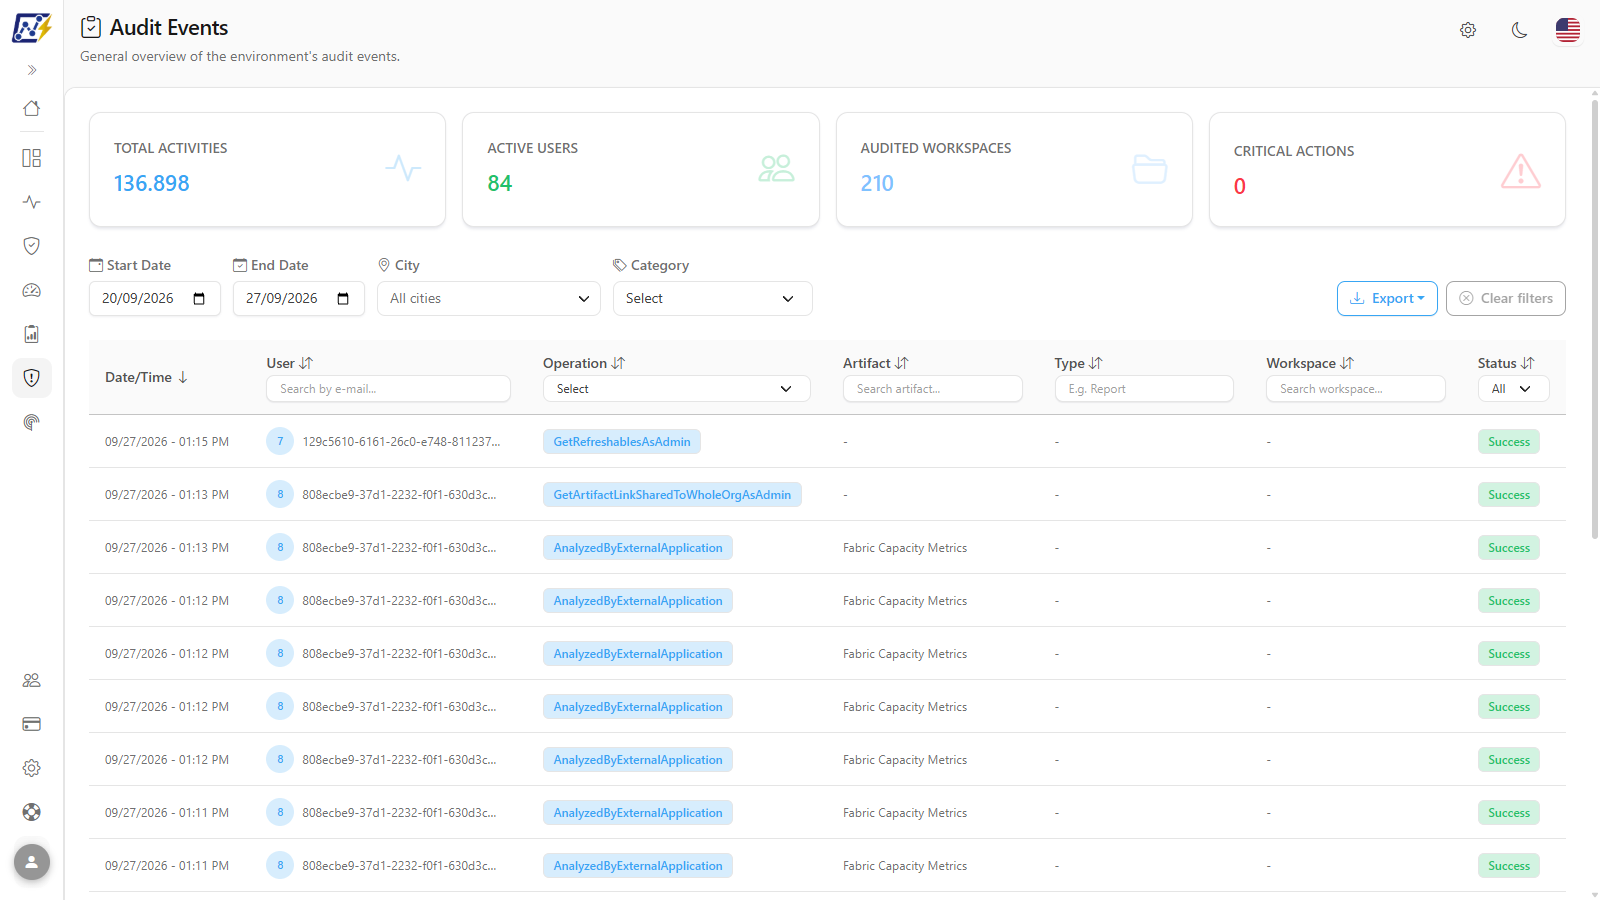
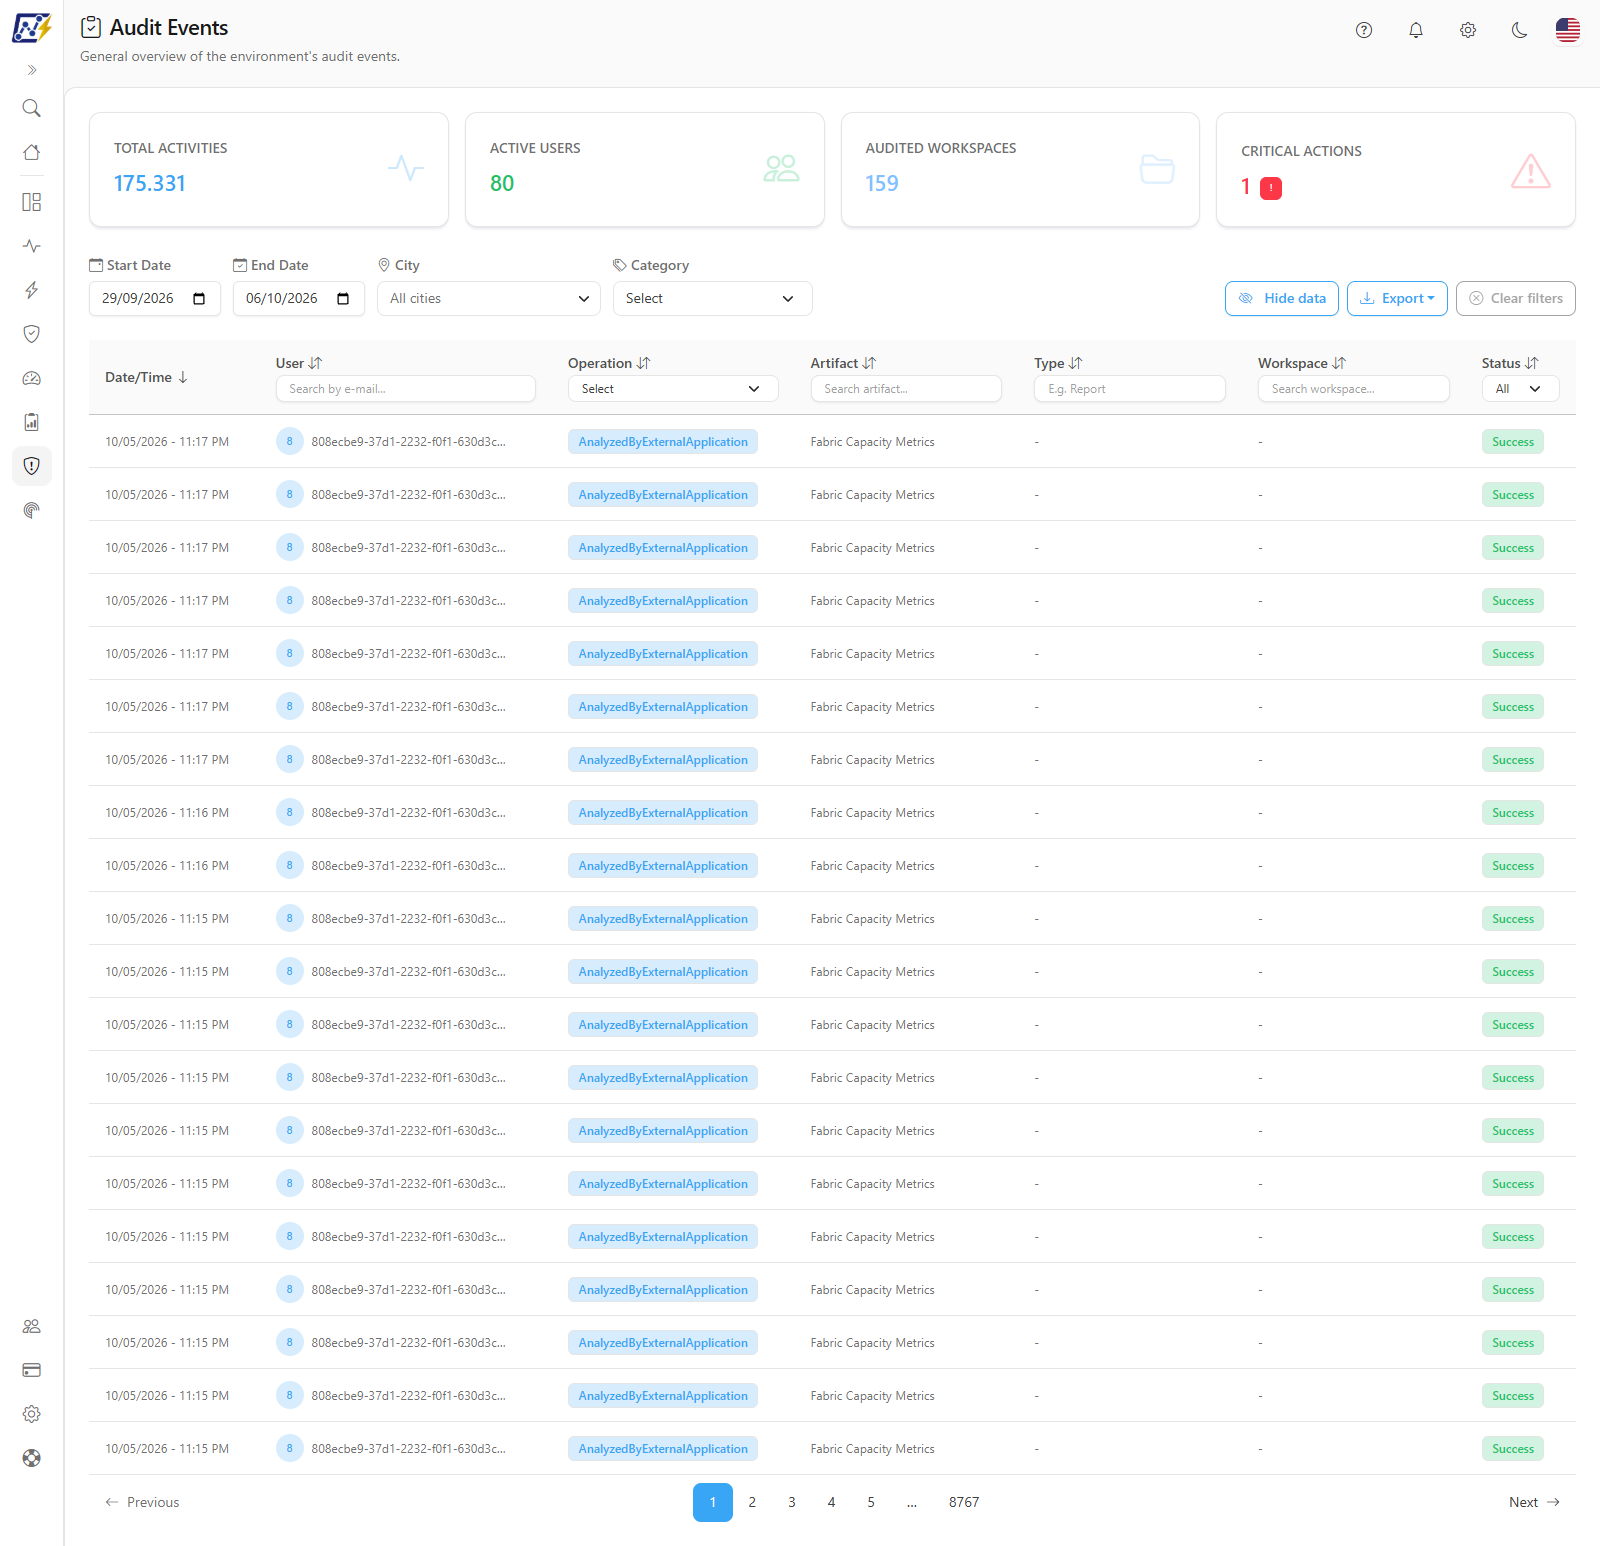
The **Events Overview** screen is the complete audit trail of your Power BI/Fabric environment: every activity event (*Activity Event*) recorded by Microsoft (who opened a report, who edited or deleted a model, who shared or exported data, who ran a refresh, who used Copilot, who changed a workspace or capacity setting) with date, user, artifact, workspace, result, and technical metadata.

**How to access:** *Audit › Events Overview*. The page title is **Audit Events**. Available to all profiles (read-only).

<figure><picture><source srcset="/files/vYj1SeQZzz2fVxSYvtUj" media="(prefers-color-scheme: dark)"><img src="https://3938213054-files.gitbook.io/~/files/v0/b/gitbook-x-prod.appspot.com/o/spaces%2FH2bFRBmIfyK3kwVKbldl%2Fuploads%2Fgit-blob-e7cb631670e77e94a96d87dd7baf76e88b59692f%2Fpm-auditoria-geral-de-eventos-en.png?alt=media" alt="Audit Events screen with the KPIs, the filters, and the list of events"></picture><figcaption><p>KPIs, filters, and list of activity events</p></figcaption></figure>

## What it is for

* **Incident investigation**: "who deleted this report?", "who changed the scheduled refresh of this model?".
* **Security and compliance**: track data exports, sharing, model downloads, and changes to group members.
* **AI usage**: see who is using Copilot and data agents.
* **Administration audit**: changes to workspaces, gateways, capacities, and Git integrations.

## Features

### Activity KPIs

**What it is:** four cards at the top: **Total Activities**, **Active Users**, **Audited Workspaces**, and **Critical Actions**.

**What it is for:** sizing the activity of the filtered period before going down to the list (for example, how many people worked on a workspace in the last week).

<figure><picture><source srcset="/files/sp5W0CEWIZV7JI1JaVnV" media="(prefers-color-scheme: dark)"><img src="https://3938213054-files.gitbook.io/~/files/v0/b/gitbook-x-prod.appspot.com/o/spaces%2FH2bFRBmIfyK3kwVKbldl%2Fuploads%2Fgit-blob-83a74b763b227cf7ad0eabe08f1bf8e13e4c8283%2Fpm-auditoria-geral-de-eventos-kpis-en.png?alt=media" alt="Total Activities, Active Users, Audited Workspaces, and Critical Actions cards"></picture><figcaption><p>Activity KPIs for the period</p></figcaption></figure>

| KPI                    | Meaning                                                                                                                                                                                                                                      |
| ---------------------- | -------------------------------------------------------------------------------------------------------------------------------------------------------------------------------------------------------------------------------------------- |
| **Total Activities**   | Number of events that match the filters                                                                                                                                                                                                      |
| **Active Users**       | Distinct users in these events                                                                                                                                                                                                               |
| **Audited Workspaces** | Distinct workspaces in these events                                                                                                                                                                                                          |
| **Critical Actions**   | Events of sensitive operations: deleting a report, model, dataflow, or capacity; taking over a model; sharing a workspace as administrator; adding or removing group members; exporting data; sharing a report; downloading a semantic model |

**How it works:** the KPIs are recalculated with each filter change: except for the **City** filter, which only restricts the list. If you clear the **Start Date**, the KPIs consider at most the 90 days before the **End Date**.

### Critical Actions shortcut

**What it is:** the **Critical Actions** card also works as a filter button.

**What it is for:** doing a quick security review (deletions, exports, sharing as administrator, and changes to group members) without needing to know the technical name of each operation.

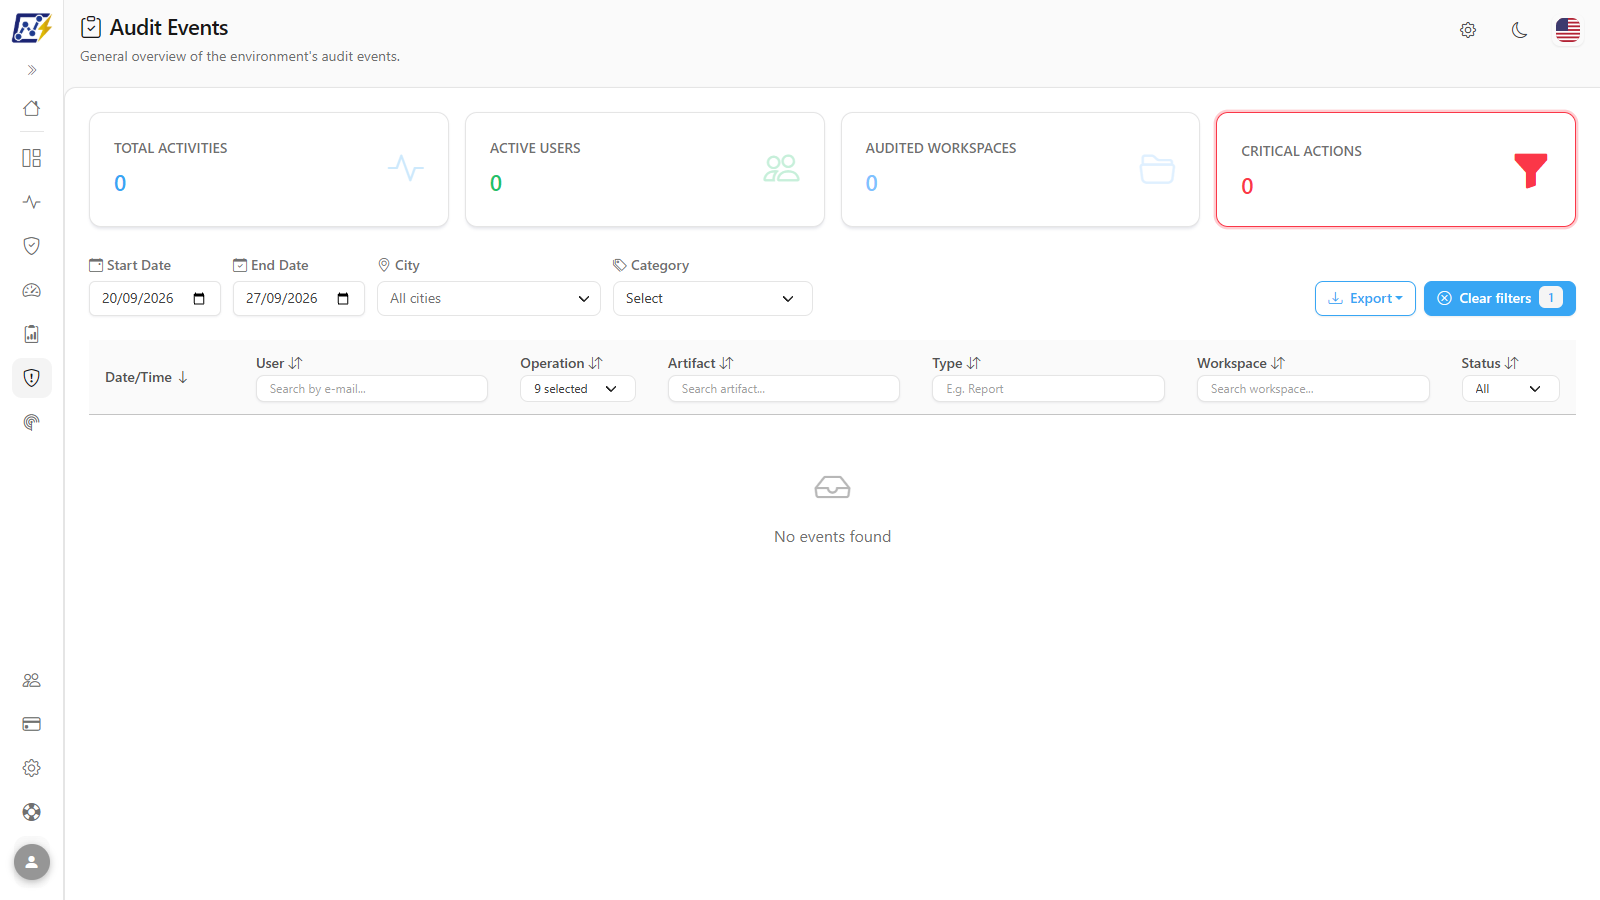
<figure><picture><source srcset="/files/URHDPgHpQ6lLGDJb1OtV" media="(prefers-color-scheme: dark)"><img src="https://3938213054-files.gitbook.io/~/files/v0/b/gitbook-x-prod.appspot.com/o/spaces%2FH2bFRBmIfyK3kwVKbldl%2Fuploads%2Fgit-blob-5aa566596552ca367df7238dc7d9b58d508e1182%2Fpm-auditoria-geral-de-eventos-acoes-criticas-en.png?alt=media" alt="Critical Actions card highlighted with the funnel icon, the Operation filter with the critical operations selected, and the Clear filters button with a counter"></picture><figcaption><p>Critical Actions shortcut active: the Operation filter now contains only the critical operations</p></figcaption></figure>

**How to use:**

1. Click the **Critical Actions** card. The **Operation** filter now contains the critical operations (replacing any operation that was selected) and the card is highlighted with a funnel.
2. To also include report sharing and model downloads, open the **Operation** filter and select `ShareReport` and `DownloadDataset` (the card is no longer highlighted, because the selection is no longer exactly that of the shortcut).
3. To go back to the full list, click the card again while it is highlighted. If you changed the operation selection, a new click reapplies the shortcut; in that case, use **Clear selection** in the **Operation** filter or **Clear filters**.

**How it works:** in the list, critical operations appear with a red badge.

{% hint style="info" %}
The filter applied by the card includes deletions (report, model, dataflow, and capacity), taking over a model, sharing a workspace as administrator, adding or removing group members, and exporting data. Report sharing (`ShareReport`) and semantic model downloads (`DownloadDataset`) are included in the card's count, but not in the filter: to see them, select these operations in the **Operation** filter.
{% endhint %}

### Period (Start Date and End Date)

**What it is:** the **Start Date** and **End Date** fields in the filter bar.

**What it is for:** investigating a specific interval: by default, the screen opens with the last 7 days.

<figure><picture><source srcset="/files/u7d0CYhgbi2AwehMm3zI" media="(prefers-color-scheme: dark)"><img src="https://3938213054-files.gitbook.io/~/files/v0/b/gitbook-x-prod.appspot.com/o/spaces%2FH2bFRBmIfyK3kwVKbldl%2Fuploads%2Fgit-blob-d9698b5aef7fd610e5c962c60ed2edf76d74938b%2Fpm-auditoria-geral-de-eventos-barra-filtros-en.png?alt=media" alt="Filter bar with Start Date, End Date, City, Category, Clear filters, and Export"></picture><figcaption><p>Filter bar</p></figcaption></figure>

**How to use:**

1. Click **Start Date** and select the first day.
2. Click **End Date** and select the last day.
3. The KPIs and the list are recalculated automatically.

**How it works:** the calendars only allow dates within the period already collected. The day is considered in full (until 23:59:59), in your browser's time zone. Rules:

* **Default period:** the screen opens with the last 7 days up to today and keeps that period even when the collection has not yet brought events from the last few hours; the most recent events remain visible as soon as they arrive.
* **Automatic adjustment:** only a date that **you chose** is adjusted to the available period (for example, a Start Date before the first collected day becomes that first day).
* **Sorting:** changing the dates **does not change the sorting**. The list keeps the current order (by default, **Date/Time** from newest to oldest); to see the oldest first, click the **Date/Time** column title.

### Category filter

**What it is:** the **Category** selector in the filter bar, with the 10 event categories.

**What it is for:** reducing the list to one type of activity (for example, only **Governance and Administration** or only **AI and Collaboration**) without knowing the technical name of the operations.

<figure><picture><source srcset="/files/UVo4bRslUAGugYPHCErn" media="(prefers-color-scheme: dark)"><img src="https://3938213054-files.gitbook.io/~/files/v0/b/gitbook-x-prod.appspot.com/o/spaces%2FH2bFRBmIfyK3kwVKbldl%2Fuploads%2Fgit-blob-2f40d906ff6f8e5d381c2293f80a4900a028f089%2Fpm-auditoria-geral-de-eventos-filtro-categoria-en.png?alt=media" alt="Category selector open with the categories selected"></picture><figcaption><p>Category filter</p></figcaption></figure>

**How to use:**

1. Click the **Category** field (it shows **Select** when there is no selection).
2. Click the desired categories. The field then shows *{N} selected* and the list is updated with each click.
3. To undo, click the **X** (**Clear selection**) next to the *Filter by category* title.

**How it works:** with categories selected, the **Operation** filter lists only the operations of these categories; operations already selected that do not belong to the new categories are automatically deselected. The categories related to the selected operations get a chain icon (*Category related to the selected operations*).

| Category                          | Example operations                                                                    |
| --------------------------------- | ------------------------------------------------------------------------------------- |
| **Viewing**                       | View report, view dashboard, Analyze in Excel                                         |
| **Data Sources**                  | Update data source credentials                                                        |
| **Datasets**                      | Create model, refresh data, configure scheduled refresh                               |
| **Reports**                       | Create, export, and share report                                                      |
| **Dataflows**                     | Create dataflow, request dataflow refresh                                             |
| **Fabric Engineering**            | Lakehouse, Warehouse, Notebook, Spark                                                 |
| **Artifacts and Files**           | Artifact reads, file deletion, folders                                                |
| **Governance and Administration** | Workspace, gateway, and capacity administration; Git/ALM; gateway data sources        |
| **AI and Collaboration**          | Copilot, data agents, embed token, goals and scorecards                               |
| **Other**                         | Any operation not classified in the previous ones, including new Microsoft operations |

### Operation filter

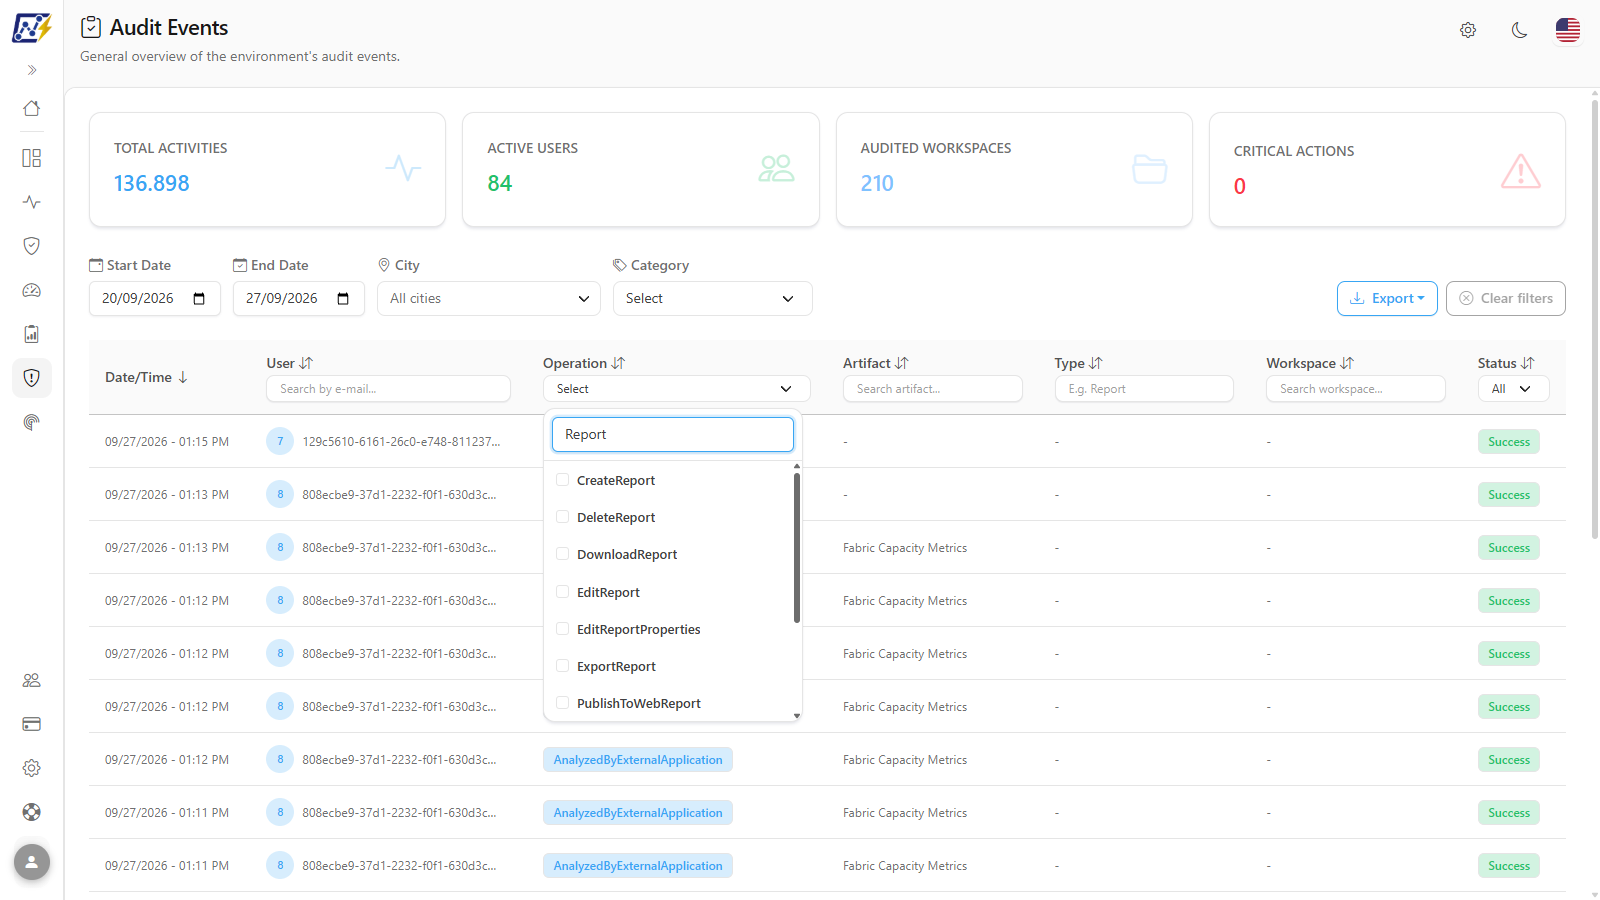
**What it is:** the selector in the **Operation** column header, with search across all operations already recorded in your tenant.

**What it is for:** going straight to a known operation, such as `DeleteReport`, `ExportReport`, or `ShareReport`.

<figure><picture><source srcset="/files/2PM5DGhFNmpTLc291Srt" media="(prefers-color-scheme: dark)"><img src="https://3938213054-files.gitbook.io/~/files/v0/b/gitbook-x-prod.appspot.com/o/spaces%2FH2bFRBmIfyK3kwVKbldl%2Fuploads%2Fgit-blob-6507d094b29e91a3029b132ea95579a257eb3e4e%2Fpm-auditoria-geral-de-eventos-filtro-operacao-en.png?alt=media" alt="Operation selector open with the search and the operations found"></picture><figcaption><p>Operation filter with search</p></figcaption></figure>

**How to use:**

1. In the **Operation** column header, click the **Select** field.
2. Type part of the name in **Search operation...**.
3. Click one or more operations. The list is updated with each click.
4. To undo, click the **X** (**Clear selection**) next to the search.

**How it works:** opening the Operation selector closes the Category selector, and vice versa; clicking outside closes both.

### City filter

**What it is:** the **City** multi-select (*All cities*) in the filter bar, based on the geolocation of the source IP of each event.

**What it is for:** investigating access from a specific or unusual location.

**How to use:**

1. Click **City**.
2. Search for and select one or more cities.
3. The list shows only events whose IP was geolocated in these cities.

**How it works:** the City filter does **not** change the KPIs or the export. Private IPs or IPs not yet resolved have no city and do not appear when the filter is active.

### Text and Status filters

**What it is:** text boxes in the **User** (*Search by e-mail...*), **Artifact** (*Search artifact...*), **Type** (*E.g. Report*), and **Workspace** (*Search workspace...*) headers, and the **Status** list (All, Success, Failure).

**What it is for:** answering "what did this person do?" or "what happened to this report?".

**How to use:**

1. In the column header, type part of the text. The search is applied as you type, with no search button.
2. In **Status**, choose **All**, **Success**, or **Failure**.
3. Combine as many filters as you want: they are all applied together.

**How it works:** when you reach this screen through a shortcut from another screen that carries the workspace name in the address, the **Workspace** filter comes already filled in.

### Clear filters

**What it is:** the **Clear filters** button, in the filter bar, with the number of active filters.

**What it is for:** going back to the full list for the period with one click.

**How to use:** click **Clear filters**. User, operation, category, artifact, type, workspace, status, and city are removed; the selected period is kept.

**How it works:** the dates are not included in the button's count. The button is disabled when there are no active filters.

### Event list

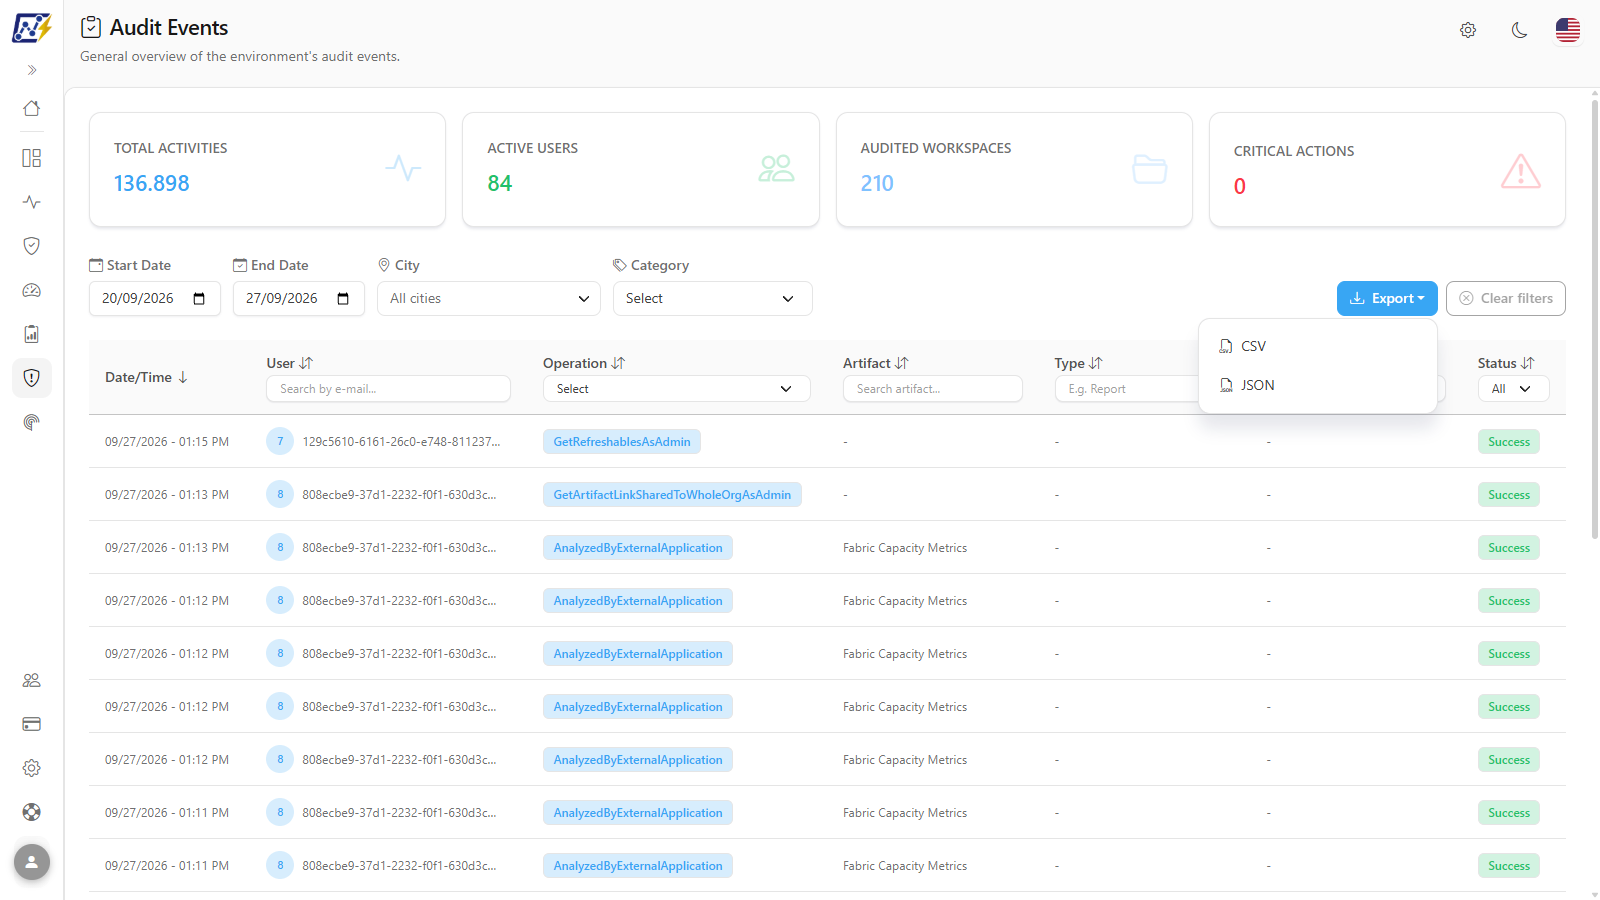
**What it is:** the table with one event per row, 20 events per page by default, with the **Previous** and **Next** buttons and the **Items per page** selector (10, 25, 50 or 100); changing the number returns to the first page.

**What it is for:** seeing who did what, on which item and workspace, and with what result.

| Column        | Content                                                                                                                                                                                                                                      |
| ------------- | -------------------------------------------------------------------------------------------------------------------------------------------------------------------------------------------------------------------------------------------- |
| **Date/Time** | Date and time of the event, in your time zone                                                                                                                                                                                                |
| **User**      | Email of the person who performed it. In accesses via **Power Embedded** (made by the Service Principal), the **real user** resolved by the integration is displayed, with a person-with-check icon and the Service Principal in the tooltip |
| **Operation** | Name of the Microsoft operation (e.g., `ViewReport`, `ExportReport`); critical operations with a red badge                                                                                                                                   |
| **Artifact**  | Name of the affected item                                                                                                                                                                                                                    |
| **Type**      | Item type                                                                                                                                                                                                                                    |
| **Workspace** | Workspace of the item                                                                                                                                                                                                                        |
| **Status**    | Success or Failure                                                                                                                                                                                                                           |

**How to use sorting:** click the title of any column. The first click sorts in descending order; the second reverses it. The arrow next to the title indicates the current column and direction. The default sorting is **Date/Time**, from newest to oldest.

### Event details

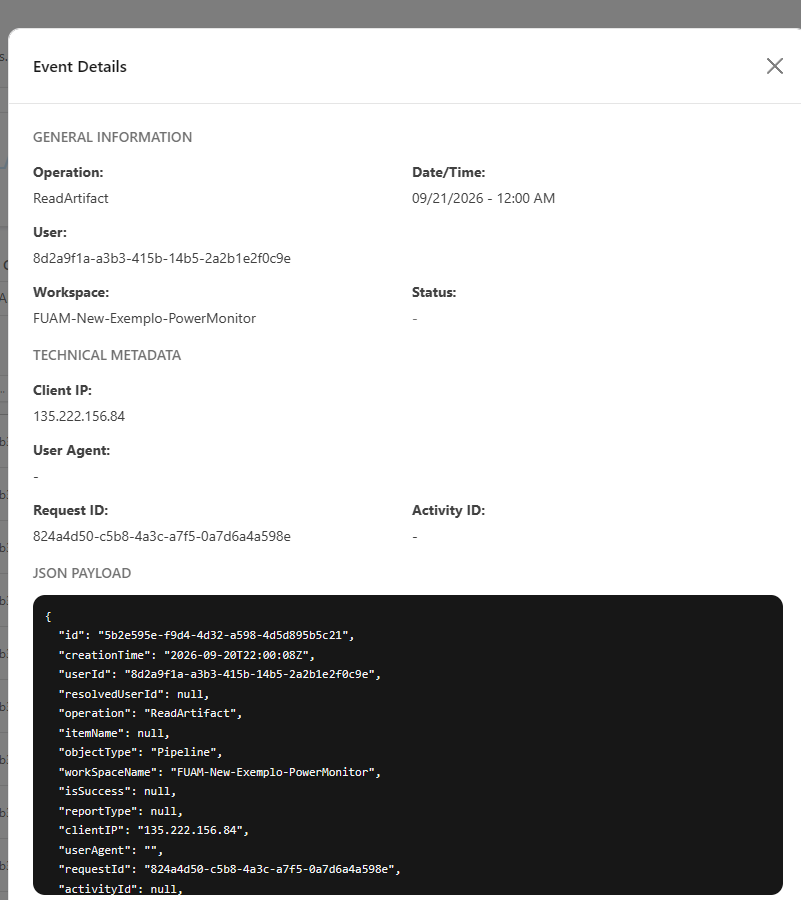
**What it is:** the **Event Details** modal, opened by clicking anywhere on the row.

**What it is for:** getting the complete evidence of an event: IP, browser, identifiers, and the original Microsoft JSON.

<figure><picture><source srcset="/files/vZl2E4SMrdhTWk66LO0a" media="(prefers-color-scheme: dark)"><img src="https://3938213054-files.gitbook.io/~/files/v0/b/gitbook-x-prod.appspot.com/o/spaces%2FH2bFRBmIfyK3kwVKbldl%2Fuploads%2Fgit-blob-6b25b6e9b192eba115db90ac87373c66a738df68%2Fpm-auditoria-geral-de-eventos-detalhe-en.png?alt=media" alt="Event Details panel with general information, technical metadata, and JSON payload"></picture><figcaption><p>Event details</p></figcaption></figure>

**How to use:**

1. Click the event row.
2. Read the sections:
   * **General Information**: operation, date/time, user (with the Service Principal, when the user was resolved via Power Embedded), workspace, and status;
   * **Technical Metadata**: **Client IP**, **User Agent**, **Request ID**, and **Activity ID**;
   * **JSON Payload**: all the fields of the event.
3. Close it with the **X** in the header or by clicking outside the modal.

### Hide data

**What it is:** the **Hide data** button, next to **Export**. Once on, it shows **Show data**.

**What it is for:** sharing the screen, recording demos or taking screenshots without exposing people.

**How to use:** click **Hide data**: the identity of users (the **User** column, the detail panel and the identifiers shown in tooltips) are masked on screen and in exported files. To see the values again, click **Show data**. If the file cannot be masked, the download is stopped and the screen warns *Could not mask the exported file. Show the data again or try once more.* The choice is saved in the browser and applies to the other screens that have the button. It is a presentation convenience, not an access control.

### Export

**What it is:** the **Export** button, in the filter bar, with the **CSV** and **JSON** options.

**What it is for:** attaching the audit trail to an investigation or analyzing large volumes outside the tool.

<figure><picture><source srcset="/files/CjJRkKObLw2YkAwvA1M8" media="(prefers-color-scheme: dark)"><img src="https://3938213054-files.gitbook.io/~/files/v0/b/gitbook-x-prod.appspot.com/o/spaces%2FH2bFRBmIfyK3kwVKbldl%2Fuploads%2Fgit-blob-9d7449f94eeb919721530c1880e4398f942ce23c%2Fpm-auditoria-geral-de-eventos-exportar-en.png?alt=media" alt="Export menu open with CSV and JSON"></picture><figcaption><p>Export options</p></figcaption></figure>

**How to use:**

1. Set the period, category, operations, and other filters.
2. Click **Export** and choose **CSV** or **JSON**. The button shows a loading indicator while the file is generated.
3. The download starts automatically. If something goes wrong, *Failed to export data.* appears.

**How it works:** the export uses the same filters as the screen, **except City**, with up to **50,000 rows** per file. The file is generated as a continuous stream by the server, so large exports do not freeze the browser.

## Rules and behavior

* **Collection.** Events are collected from the Power BI/Fabric admin API **three times a day (at 01:23, 08:23, and 18:23 (Brasília time, UTC-3)**) incrementally: each run continues from where the previous one stopped, with a 60-minute overlap so as not to miss events that Microsoft publishes with a delay. If a window fails, the progress does not advance and the next run redoes that stretch.
* **Enablement.** Collection is controlled in *Settings › Audit › Collection Frequency* (new organizations already start with collection enabled). Administrators can trigger a manual collection and track the run in *Mapping › Audit*.
* **Initial history.** The Microsoft API keeps events for a limited period; in the first collection, Power Monitor fetches up to **27 days** back. From then on, the history is kept in Power Monitor.
* **Discarded noise.** Internal data source credential queries made by the Power BI service itself during refreshes are not stored, nor are the reads and analyses made by **Power Monitor's own Service Principal** during scans. The same event types, when performed by a real user, are kept.
* **Geolocation.** The source IP of each event is resolved to country, state, city, and provider by an external geolocation service (only the IP address is queried). New IPs are resolved every hour and the result is cached for 90 days. Private IPs or IPs not yet resolved have no city and **do not appear** when the City filter is active.
* **The City filter does not apply to the KPIs or to the export**: it only restricts the list.
* **KPIs without a start date.** If you clear the Start Date, the KPIs consider at most the 90 days before the End Date.
* **Power Embedded.** When the Power Embedded integration is configured in *Settings › Audit*, report accesses made by the embed Service Principal are cross-referenced with the Power Embedded audit to show the end user.
* **Workspace scope.** You see only events from the workspaces you can view.

## Step by step: common scenarios

All the steps below start from *Audit › Events Overview* and are available to any profile. You will see only the events from the workspaces in your scope. If an administrator blocked this page for your user in [Users](/en/power-monitor/usuarios.md), it disappears from the menu and direct access through the address leads to the **Not allowed** screen. If the screen itself displays **Access Denied**, the server refused the query for your user: talk to an administrator.

### How to find out who deleted a report

{% stepper %}
{% step %}

### Adjust the period

Set **Start Date** and **End Date** covering the likely moment of the deletion.
{% endstep %}

{% step %}

### Filter the operation

In the **Operation** header, search for and select `DeleteReport` (or click the **Critical Actions** card, which includes report deletion).
{% endstep %}

{% step %}

### Filter the artifact

Type the report name in the **Artifact** filter (*Search artifact...*).
{% endstep %}

{% step %}

### Open the detail

Click the event to see the user, the IP, the user agent, and the complete payload. Use **Export › CSV** to attach the evidence.
{% endstep %}
{% endstepper %}

### How to identify the real user of an access via Power Embedded

Prerequisite: the Power Embedded integration configured by an administrator in *Settings › Audit*.

1. In the **User** column, look for the person-with-check icon next to the email: it indicates that the user was resolved via Power Embedded.
2. Hover over the icon to see the Service Principal that made the call (*User resolved via Power Embedded, SP: …*).
3. Open the event detail: below the user, the line *Service Principal: …* appears.

## Frequently asked questions

<details>

<summary>Recent events do not appear yet.</summary>

Collection runs at 01:23, 08:23, and 18:23 (Brasília time, UTC-3), and Microsoft itself may take some time to make the events available. If you need them sooner, ask an administrator to run *Mapping › Audit*.

</details>

<details>

<summary>The list shows events, but the KPIs are zero.</summary>

Check the Start Date. Without a start date, the KPIs consider at most the 90 days before the End Date.

</details>

<details>

<summary>The user appears as a GUID.</summary>

It is a Service Principal (application). If the access was made via Power Embedded and the integration is configured, Power Monitor displays the real user instead of the GUID.

</details>

<details>

<summary>Why did the export bring more rows than the list filtered by city?</summary>

The City filter is applied only to the list on the screen; the export and the KPIs consider the other filters.

</details>

## Related pages

* [Report Views](/en/power-monitor/auditoria/visualizacoes-de-relatorios.md): only view events, with country and city
* [Report Access Dashboard](/en/power-monitor/dashboards/dashboard-de-visualizacoes.md)
* [Settings › Audit](/en/power-monitor/configuracoes/auditoria.md): enabling collection and the Power Embedded integration
* [Mapping](/en/power-monitor/mapeamento.md)


---

# Agent Instructions
This documentation is published with GitBook. GitBook is the documentation platform designed so that both humans and AI agents can read, navigate, and reason over technical content effectively. Learn more at gitbook.com.

## Querying This Documentation
If you need additional information that is not directly available in this page, you can query the documentation by asking a question.

Perform an HTTP GET request on the following URL with the `ask` and `goal` query parameters:

```
GET https://docs.powermonitor.com.br/en/power-monitor/auditoria/geral-de-eventos.md?ask=<question>&goal=<user_goal>
```

`ask` is the immediate question: it should be specific, self-contained, and written in natural language.
`goal` is what the user is ultimately trying to achieve, the reason they need the answer. Sharing it helps GitBook give you a better, more relevant answer. A goal is most helpful when it describes the outcome the user wants rather than restating the question. For example, with `ask=how do I create an API token`, a goal like `automate deployments from our CI pipeline` lets GitBook tailor the answer to that use case.

The response will contain a direct answer to the question and relevant excerpts and sources from the documentation.

Use this mechanism when the answer is not explicitly present in the current page, you need clarification or additional context, or you want to retrieve related documentation sections.