> For the complete documentation index, see [llms.txt](https://docs.powermonitor.com.br/llms.txt). Markdown versions of documentation pages are available by appending `.md` to page URLs; this page is available as [Markdown](https://docs.powermonitor.com.br/en/power-monitor/auditoria/risco-comportamental.md).
# Behavioral risk
Daily, explainable score from 0 to 100 that points to changes in each person's usage behavior compared with their own history. Feature with organization opt-in (already on in new installations), exclu
The **Behavioral risk** screen calculates, once a day, a **score from 0 to 100 per person**, comparing their activity in Power BI/Fabric with **the person's own history**. The goal is to point out behavior changes that **deserve a conversation or a review**: a spike in exports, an account that comes back after months idle, access from distant places in a short time.
**How to access:** menu *Audit › Behavioral risk*.
**Who can use it:** **Administrators only**. The item does not appear in the menu for other profiles, the route is blocked and the server refuses calls from anyone who is not an administrator. Because the feature handles personal data about monitoring people, it depends on the organization opt-in. In organizations created from October 7, 2026 onwards, scoring is already **on** (with network signals off); in earlier organizations, it comes **off** and only starts calculating after an Administrator turns it on.
{% hint style="warning" %}
**An investigation signal, not a verdict.** The score points to behavior changes. It does not prove misconduct and must not be used alone for decisions about people. Several factors are approximations (the log does not say, for example, whether a share is external, and IP geolocation can be wrong). The legal basis, purpose, necessity and communication to the monitored people are the **responsibility of your organization** before turning the feature on.
{% endhint %}
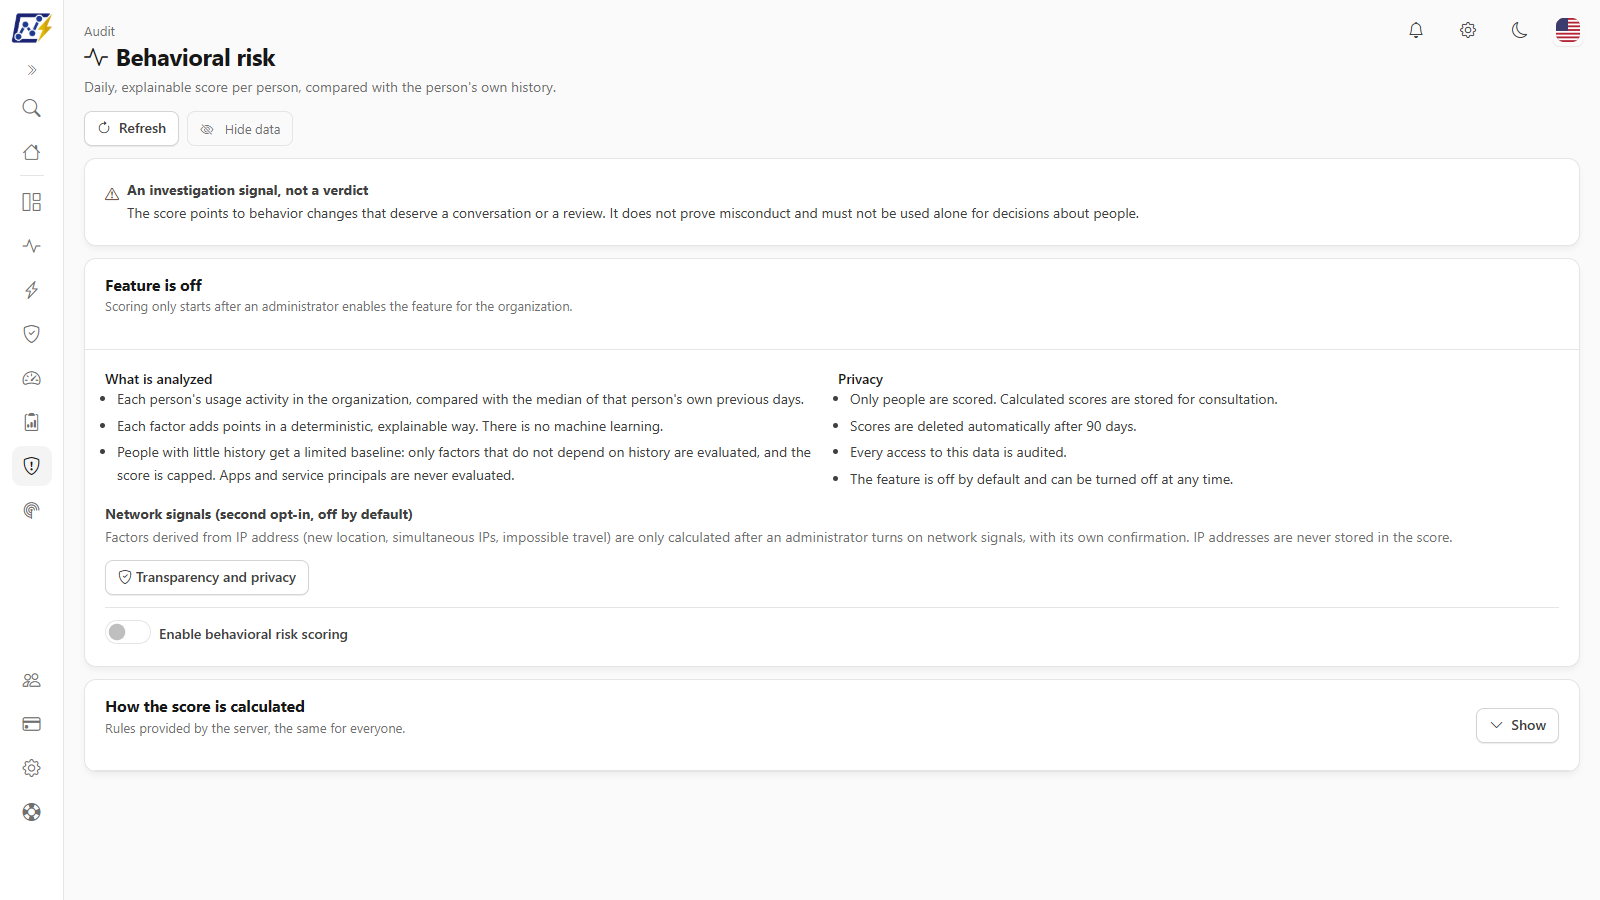
Audit › Behavioral risk
## What it is for
* **Prioritize** the attention of the security team: which people, on the latest calculated day, had the most relevant behavior changes.
* **Understand why**: each score comes with the list of factors that compose it, with points, the day's value and the baseline.
* **Track the evolution** of a person over the last days.
## Turning the feature on (organization opt-in)
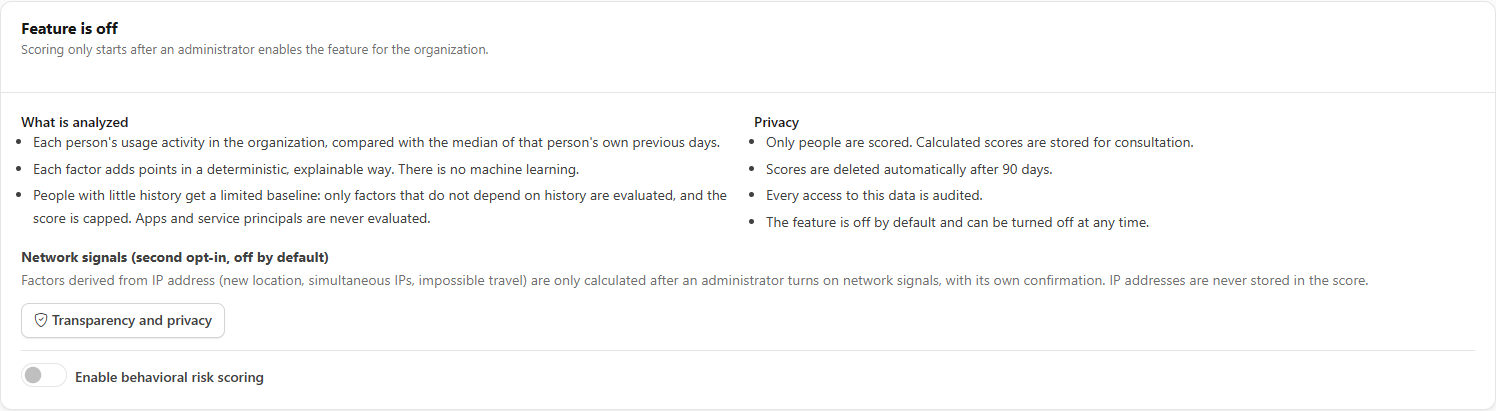
While the feature is off, the screen shows the **Feature is off** card (*Scoring only starts after an administrator enables the feature for the organization*):
Feature is off: organization opt-in
* **What is analyzed:** each person's usage activity in the organization, compared with the median of **that person's own** previous days; each factor adds points in a deterministic, explainable way (**there is no machine learning**); people with little history get a **limited baseline**, with a score cap; **apps and Service Principals are never evaluated**.
* **Privacy:** only people are scored; calculated scores are stored for consultation and are **deleted automatically after 90 days**; **every access to this data is audited**; the feature can be turned off at any time.
* **Network signals (second opt-in, off by default):** factors derived from IP address (new location, simultaneous IPs, impossible travel) are only calculated after the administrator turns on network signals, with its own confirmation. **IP addresses are never stored in the score.**
* The **Transparency and privacy** button opens the full transparency text (what is collected, purpose, who sees it, factors and thresholds, retention, absence of automated decisions, review and contestation and the organization's responsibility).
To turn it on, check **Enable behavioral risk scoring** and confirm in **Enable behavioral risk?** (*The system will start calculating and storing scores per person, and access to them will be audited. The first results appear after the first closed day.*). The opt-in can also be turned on or off in *Settings › Monitoring*, in the **Audit, security and compliance** section: the **Active/Inactive** switch on the **Behavior risk** card opens the same confirmation and does not change the network signals.
To turn it off, use **Disable** at the top of the screen. The daily calculation stops running, but scores already stored are **not erased right away**: they are removed by the 90-day retention.
## Screen components (feature on)
### Feature settings
The **Feature settings** card (*Organization opt-ins. Each one is saved and audited separately*) brings the **Network signals (IP-derived factors)** switch and the **Transparency and privacy** button. Turning network signals on or off asks for its own confirmation. With the signals **off**, IP factors are left out of the calculation, **which does not mean nothing was found**.
### Indicators and chart
| Item | What it shows |
| ------------------------------------------------------------------ | --------------------------------------------------------------------------------------------------- |
| **People with high or critical risk on the latest calculated day** | Count |
| **People with medium risk on the latest calculated day** | Count |
| **Latest calculated day** | The date of the last calculation |
| **People by severity, per day** | Column chart. *Only days with stored scores appear. A day without a column does not mean zero risk* |
Before the first calculation, the screen says: *The calculation runs daily; the first results appear after the first closed day.*
### Top scores
The **Top scores** ranking of the day (default: the latest calculated) has the filters **Minimum severity** (**All**, **Low**, **Medium**, **High**, **Critical**) and **Day**, and is paginated (20 people per page). The **Refresh** button in the header reloads the screen.
| Column | Content |
| ------------------- | ---------------------------------------------------------------------------------------------------------------------------------- |
| **Person** | The person's name and key, with the day's highlight sentence (for example, *Main factor of the day: ...*). Masked by **Hide data** |
| **Score** | From 0 to 100, with a bar |
| **Trend (14 days)** | Mini chart of the last 14 days and the 7-day max. *A day without a point had no stored score* |
| **Severity** | **Low**, **Medium**, **High** or **Critical** |
| **Type** | **Member** or **Guest** |
| **Calculated at** | When the score was calculated |
In addition, each row can show signals such as **Changed since yesterday** (*Yesterday: N*, change, new factors and factors that dropped out), **Limited baseline** and **Floor N** (see below). The **More actions** menu offers **View history** and **Copy key**. The **Export** button (CSV or JSON) takes the loaded page, with the identity columns flagged.
### A person's risk history
**View history** opens a drawer with the person's **Daily score** chart and, for the chosen day, the factor table:
| Column | Content |
| -------------------- | --------------------------------------------------------------------------------------------------------------------- |
| **Factor** | What was observed |
| **Points** | How much the factor added |
| **Value / baseline** | The day's value against the person's usual median (counts, except for off-hours activity, where they are percentages) |
The operations involved, the indication of **limited by correlation with another factor (damping)** and the **floor applied**, when there is one, also appear. A day without a point is **not zero risk**: no score was stored (below the minimum or not enough history). Days stored before **model v2** are not directly comparable with the current ones, because the calculation rule changed.
## How the score is calculated
The collapsible **How the score is calculated** card (*Rules provided by the server, the same for everyone*) shows the current methodology. In practical terms:
* **Deterministic and explainable.** It does not use machine learning. The score ranges from 0 to 100.
* **Comparison with their own history.** Each person is compared with the **median of their own previous 28 days** (active days only), separating weekdays from weekends when there is enough history. Business hours: 07:00 to 20:00, Monday to Friday, in the organization's time zone.
* **Limited baseline.** **7 active days** of history are needed for the full comparison. With fewer, only factors that do not depend on a baseline are evaluated and the score has a **cap of 59**, unless a floor applies. If no factor fires, **there is no score** (never a guess).
* **Who is evaluated.** People only. Apps, Service Principals, "Power BI Service", access through Power BI Embedded and accounts with a service account pattern or machine regularity are excluded.
* **When it runs.** Once a day, after the tenant day closes, for the previous full day.
* **What is stored.** Only scores of **10** or more are stored, for **90 days**.
### Factors
Each factor has a **points ceiling**. Factors that depend on a baseline only light up above an absolute floor: someone with low volume who doubles their activity triggers nothing.
| Factor | Ceiling | What it observes |
| --------------------------------- | ------- | ---------------------------------------------------------------------------------------------------- |
| Activity volume | 20 | Events of the day well above the person's usual |
| Export and sharing | 25 | Exporting, downloading, printing or sharing well above the usual |
| Off-hours activity | 15 | A share of the day outside business hours much larger than usual |
| New access location (*uses IP*) | 15 | Country or city not seen in the previous 30 days |
| Workspace breadth | 10 | Distinct workspaces in the day well above the usual |
| Destructive actions | 15 | Artifact deletions and risky administrative actions |
| First access to labeled content | 10 | Reports with a sensitivity label accessed for the first time in 30 days |
| Reactivation after inactivity | 20 | A person idle for weeks who returns with intense activity |
| Simultaneous IPs (*uses IP*) | 10 | Views from 2 or more different IPs within the same 5-minute window |
| Impossible travel (*uses IP*) | 15 | Consecutive accesses at a distance and speed incompatible with real travel |
| Labeled content egress | 20 | Export of a report with a sensitivity label that the person had not exported in the previous 30 days |
| First risky administrative action | 10 | A type of administrative action the person had not performed in the previous 90 days |
Factors marked **uses IP** only exist with **network signals** turned on; without them they appear as **Disabled**, and that does not mean absence of risk. The labeled-content factors only exist if the organization has labeled reports in the inventory.
### Damping and floors
* **Damping:** factors that measure the same behavior are not added twice. Volume and breadth add at most 25 points together; the three IP-derived factors add at most 25 points together.
* **Floors:** serious combinations guarantee a minimum score, even if the sum of factors was lower, and are explained in the factor list: **reactivation together with export (10 or more operations), deletions (5 or more) or a first-time risky administrative action on the same day** (minimum 30), **export 5 times above the usual and with at least 30 operations in the day** (30), **2 or more impossible-travel episodes together with an export spike** (60) and **3 or more exports of labeled reports new to the person together with the first access to labeled content** (60).
### Severity
| Severity | Score |
| ------------ | ---------- |
| **Low** | below 30 |
| **Medium** | 30 to 59 |
| **High** | 60 to 79 |
| **Critical** | 80 or more |
{% hint style="info" %}
The names and descriptions of the factors come from the server and may appear in Portuguese on the screen.
{% endhint %}
## Rules and behavior
* **Transparency and audit:** turning the feature on and off, changing network signals and **every query** to the list and to a person's history are recorded in [Application Events](/en/power-monitor/auditoria/eventos-da-aplicacao.md) (category *Privacy*), with who queried, without the content.
* **No automated decision:** no alert, e-mail, block or sanction comes from the score. The screen only lists.
* **Scope:** the view is of the whole organization, regardless of the administrator's workspace scope.
* **Stored data:** the person's e-mail (UPN) and name are stored in clear text next to the score for up to 90 days; the protection is restricted access for Administrators and the **Hide data** button, which masks name and key on screen and in exports. From the IP, only country codes and counts are stored, never the address, city or browser.
* **Retention:** 90 days.
* **Execution limits:** per organization and per execution, the calculation evaluates up to 5,000 people (the most active of the day). Above that, the least active are not scored.
* **Turning off does not erase:** disabling the feature stops new calculations, but does not erase what was already stored.
* The calculation can also be paused in *Settings › Monitoring*, in the **Behavioral risk scoring** scan, which does **not** replace the organization opt-in: without the opt-in, nobody is scored.
* **New installations:** organizations created from October 7, 2026 onwards start with the opt-in on and the network signals off. Existing organizations do not change.
## Step by step
### How to investigate a high score
{% stepper %}
{% step %}
### Open the ranking
In *Audit › Behavioral risk*, see **Top scores** and filter **Minimum severity › High**.
{% endstep %}
{% step %}
### See why
Click **View history** on the person's row and read the day's factor table: what added points, the day's value and the baseline.
{% endstep %}
{% step %}
### Cross with the log
In [Events Overview](/en/power-monitor/auditoria/geral-de-eventos.md), filter the user and the day to see the real operations.
{% endstep %}
{% step %}
### Talk before concluding
Treat the score as a starting point: validate with the person and their management before any measure.
{% endstep %}
{% endstepper %}
### How to turn the feature on (Administrator)
1. Confirm with legal and the data protection officer (DPO) the legal basis and the communication to the monitored people.
2. In *Audit › Behavioral risk*, read **Transparency and privacy**.
3. Check **Enable behavioral risk scoring** and confirm.
4. If the organization decides to use IP-based factors, separately turn on **Network signals**, with its own confirmation.
5. Wait for the first closed day: results appear from then on.
## Frequently asked questions
The screen is empty after turning it on. Is that right?
Yes. The calculation runs once a day over the previous closed day, so the first results appear after the first closed day. Only people with a score of 10 or more are stored.
Why does a person with little activity appear with a limited score?
They have fewer than 7 active days of history. Only factors that do not depend on a baseline are evaluated and the score is capped at 59, unless a floor applies.
The IP factors appear as "Disabled".
Network signals are not turned on. They require a second opt-in, with its own confirmation. Disabled does not mean nothing was found.
Can I use the score to sanction someone?
You should not. The score is an investigation signal, not a verdict, and several of its inputs are approximations. Use it only as a starting point for a human analysis.
Can a regular user see this screen?
No. Only Administrators see the menu item and access the screen and the data.
## Related pages
* [Audit](/en/power-monitor/auditoria.md)
* [Events Overview](/en/power-monitor/auditoria/geral-de-eventos.md)
* [Application Events](/en/power-monitor/auditoria/eventos-da-aplicacao.md)
* [Permission history](/en/power-monitor/auditoria/historico-de-permissoes.md)
* [Privacy and compliance](/en/power-monitor/governanca/conformidade/privacidade-e-conformidade.md)
* [Settings › Monitoring](/en/power-monitor/configuracoes/monitoramento.md)
---
# Agent Instructions
This documentation is published with GitBook. GitBook is the documentation platform designed so that both humans and AI agents can read, navigate, and reason over technical content effectively. Learn more at gitbook.com.
## Querying This Documentation
If you need additional information that is not directly available in this page, you can query the documentation by asking a question.
Perform an HTTP GET request on the following URL with the `ask` and `goal` query parameters:
```
GET https://docs.powermonitor.com.br/en/power-monitor/auditoria/risco-comportamental.md?ask=&goal=
```
`ask` is the immediate question: it should be specific, self-contained, and written in natural language.
`goal` is what the user is ultimately trying to achieve, the reason they need the answer. Sharing it helps GitBook give you a better, more relevant answer. A goal is most helpful when it describes the outcome the user wants rather than restating the question. For example, with `ask=how do I create an API token`, a goal like `automate deployments from our CI pipeline` lets GitBook tailor the answer to that use case.
The response will contain a direct answer to the question and relevant excerpts and sources from the documentation.
Use this mechanism when the answer is not explicitly present in the current page, you need clarification or additional context, or you want to retrieve related documentation sections.