> For the complete documentation index, see [llms.txt](https://docs.powermonitor.com.br/llms.txt). Markdown versions of documentation pages are available by appending `.md` to page URLs; this page is available as [Markdown](https://docs.powermonitor.com.br/en/power-monitor/auditoria/service-principals.md).

# Service Principals

All applications (Service Principals) with direct permission on workspaces, items, gateways and connections in your environment, highlighting third-party write and administrator access.

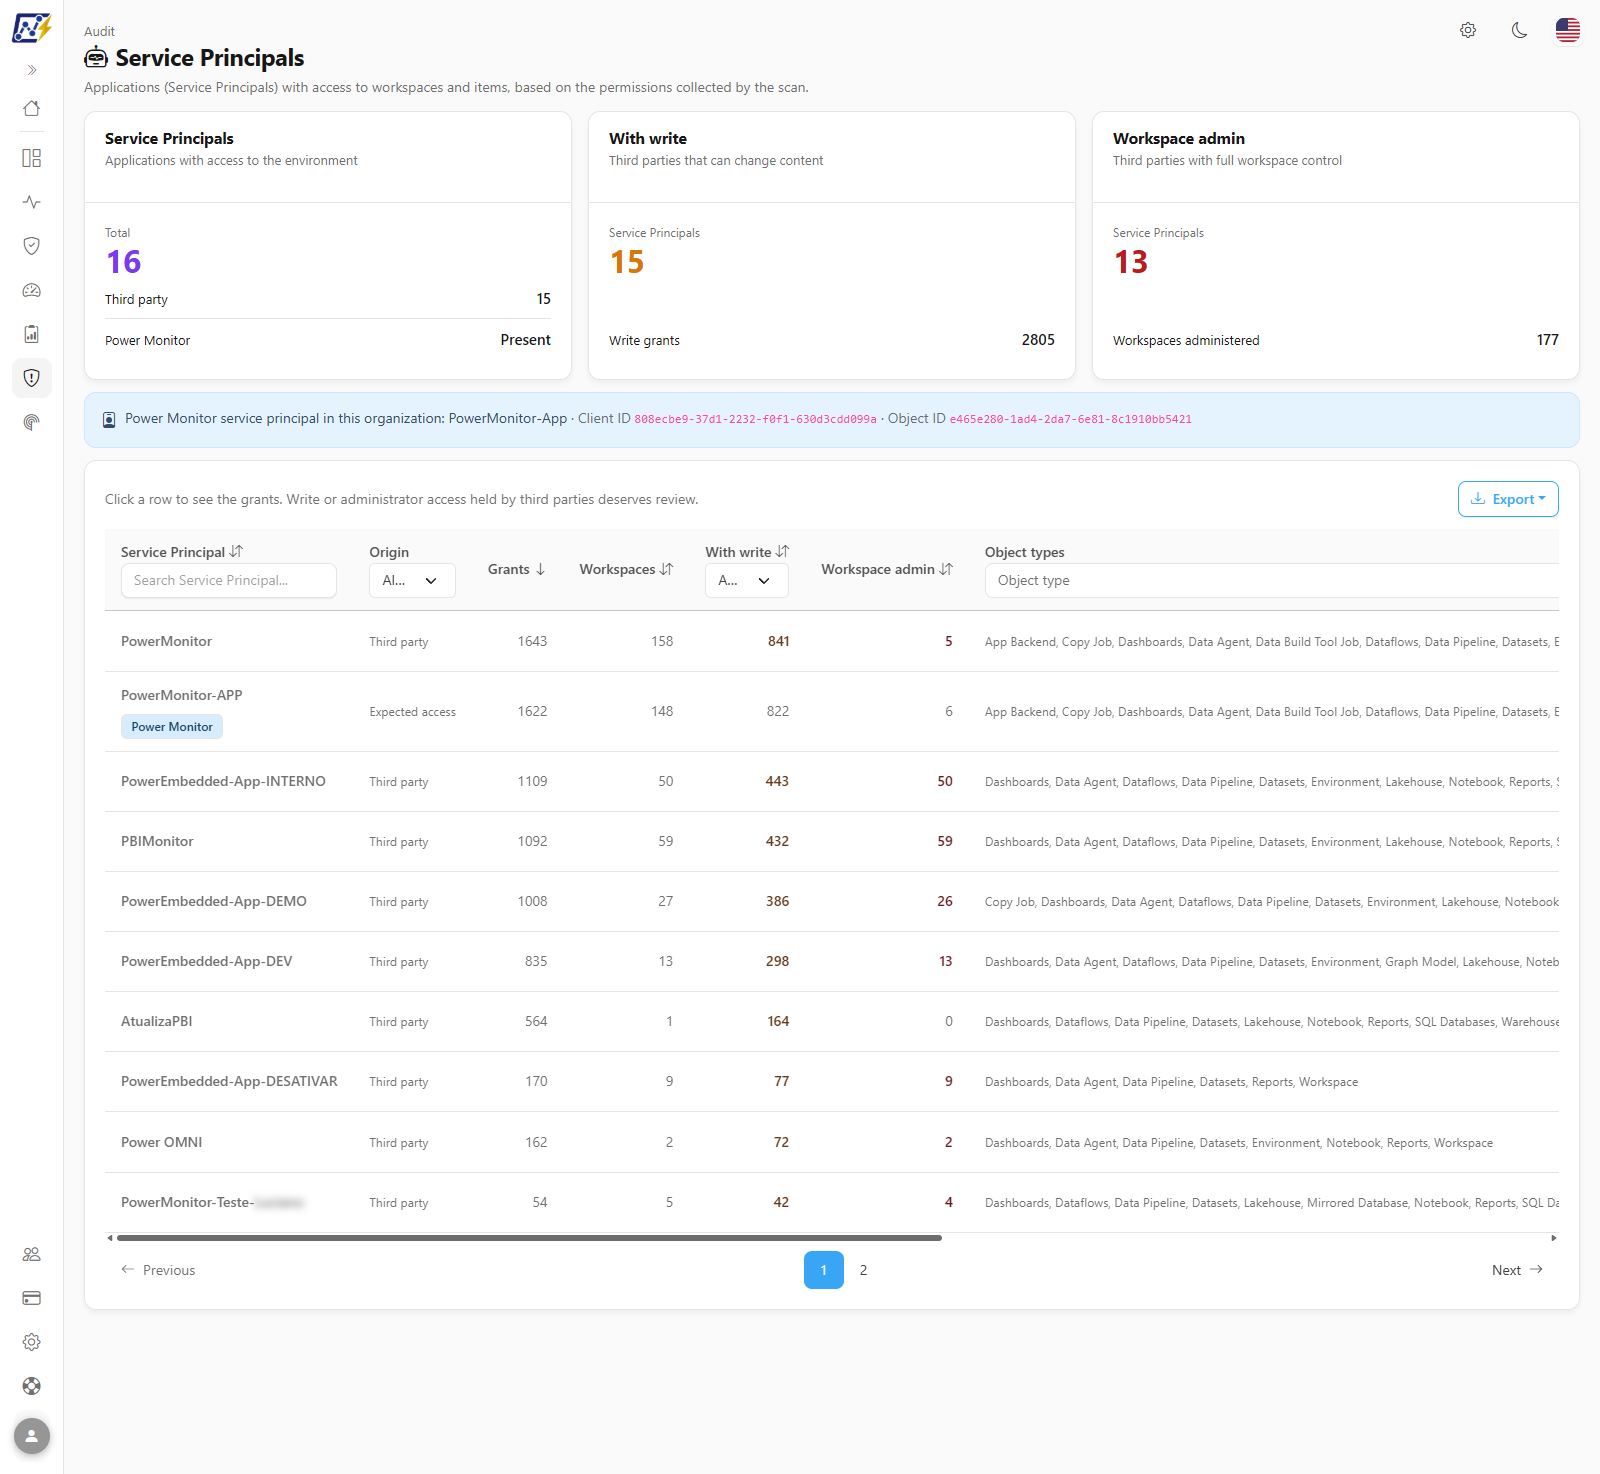
The **Service Principals** screen lists all **applications** (Microsoft Entra ID Service Principals and Service Principal profiles) that have **direct permission** on some object in your environment, based on the permissions collected by the scan. For each application, it shows how many grants it has, in how many workspaces, how many of them allow write access and how many workspaces it administers. Power Monitor's own Service Principal is identified and excluded from the findings, because its access is expected by the installation.

**How to access:** *Audit › Service Principals*. Available to all profiles (you do not need to be an Administrator). The screen is read-only: there are no write actions.

<figure><picture><source srcset="/files/IoIDnFk23tCiDy7xdp4a" media="(prefers-color-scheme: dark)"><img src="https://3938213054-files.gitbook.io/~/files/v0/b/gitbook-x-prod.appspot.com/o/spaces%2FH2bFRBmIfyK3kwVKbldl%2Fuploads%2Fgit-blob-8caccb8e524891ffb04bee73f5ccf1f33c28ef28%2Fpm-auditoria-service-principals-en.png?alt=media" alt="Service Principals screen with the three indicator cards, the Power Monitor identity notice and the list of applications"></picture><figcaption><p>Applications with access to the environment, highlighting write access and workspace administration</p></figcaption></figure>

## What it is for

Applications with access to Power BI and Fabric (third-party tools, automations, CI/CD pipelines, embedding integrations) tend to accumulate permissions over time and are rarely included in the access reviews done for people. This screen answers:

* **Which applications have access to my environment, and to what?**
* **Which third-party applications can change content** (write access) or **administer workspaces** (full control, including permissions)?
* **Which one is the Power Monitor Service Principal**, and is its access coming through a direct grant or through the installation's security group?

Typical use cases: periodic review of application access, decommissioning an old integration, investigating an unknown application and verifying the principle of least privilege for service accounts.

{% hint style="info" %}
The data comes from the **same source** as the [Permissions Audit](/en/power-monitor/auditoria/auditoria-de-permissoes.md). This screen is an application-focused view: it groups direct permissions by Service Principal and calculates the risk indicators. To see the full access path (including through groups and through workspaces), use the Permissions Audit.
{% endhint %}

## Features

### Indicator cards

**What it is:** three cards at the top: **Service Principals**, **With write** and **Workspace admin**.

**What it is for:** knowing in seconds how many applications have access to the environment and how many third-party applications can change content or administer workspaces.

<figure><picture><source srcset="/files/if4EeV3gToJM2Gzvh2P8" media="(prefers-color-scheme: dark)"><img src="https://3938213054-files.gitbook.io/~/files/v0/b/gitbook-x-prod.appspot.com/o/spaces%2FH2bFRBmIfyK3kwVKbldl%2Fuploads%2Fgit-blob-4da67d17063fc51b654b3bbd17f5f3807f5c09ee%2Fpm-auditoria-service-principals-cards-en.png?alt=media" alt="Service Principals, With write and Workspace admin cards"></picture><figcaption><p>Indicators of applications with access</p></figcaption></figure>

| Card                   | Main number                                                                                                                            | Card details                                                                                                               |
| ---------------------- | -------------------------------------------------------------------------------------------------------------------------------------- | -------------------------------------------------------------------------------------------------------------------------- |
| **Service Principals** | **Total** number of applications with access to the environment, including Power Monitor's                                             | **Third party**: total excluding the Power Monitor Service Principal. **Power Monitor**: *Present* or *Absent* in the list |
| **With write**         | Number of **third-party** Service Principals with at least one write grant (card turns yellow when greater than zero)                  | **Write grants**: sum of the write grants of these applications                                                            |
| **Workspace admin**    | Number of **third-party** Service Principals that are administrators of at least one workspace (card turns red when greater than zero) | **Workspaces administered**: sum of the workspaces in which these applications are administrators                          |

**How to use:** read the cards when you open the screen. If **With write** or **Workspace admin** are highlighted, filter the list by the **With write** column (see below) to see which applications they are.

**How it works:** the cards consider **all** loaded Service Principals and do not change with the list filters. "Third party" (on the cards and in the list) means any application that is **not** the Power Monitor Service Principal, including applications created by your own organization.

### Power Monitor identity notice

**What it is:** the banner below the cards with *Power Monitor service principal in this organization: {name}*, followed by the **Client ID** and the **Object ID**.

**What it is for:** identifying, without opening the settings, which application is Power Monitor's own, and whether its access comes through a direct grant or through the installation's security group.

<figure><picture><source srcset="/files/IZUoSYCGeQBd5Ejba3vx" media="(prefers-color-scheme: dark)"><img src="https://3938213054-files.gitbook.io/~/files/v0/b/gitbook-x-prod.appspot.com/o/spaces%2FH2bFRBmIfyK3kwVKbldl%2Fuploads%2Fgit-blob-9f292099852d73fd589fdec23e5425ae978a49b4%2Fpm-auditoria-service-principals-aviso-identidade-en.png?alt=media" alt="Notice with the name, Client ID and Object ID of the Power Monitor Service Principal"></picture><figcaption><p>Power Monitor identity notice</p></figcaption></figure>

* **Blue notice:** the Power Monitor Service Principal was found among the collected direct permissions and is marked in the list.
* **Yellow notice:** no direct grant for it was collected. This is normal when Power Monitor's access comes from the **installation's security group** (permissions granted to a group do not appear on this screen; the group appears in the [Permissions Audit](/en/power-monitor/auditoria/auditoria-de-permissoes.md)).

**Partial read:** if the environment has more than 50,000 direct permissions, the message *Partial read: the audit stopped at the limit of 50,000 permissions read. Numbers and the list may be incomplete.* also appears. In that case, treat the numbers as a minimum.

### List search and filters

**What it is:** the filters in the list headers: *Search Service Principal...* (**Service Principal** column), **Origin**, **With write** and **Object types**.

**What it is for:** isolating third-party applications, those with write or administration access, or those that access a given object type (for example, gateways and connections).

<figure><picture><source srcset="/files/VAx2u8H3fp4Kok25yLvU" media="(prefers-color-scheme: dark)"><img src="https://3938213054-files.gitbook.io/~/files/v0/b/gitbook-x-prod.appspot.com/o/spaces%2FH2bFRBmIfyK3kwVKbldl%2Fuploads%2Fgit-blob-fd72e01744e5273c3b95bba517ade5945cedd73a%2Fpm-auditoria-service-principals-filtros-en.png?alt=media" alt="List header with the search, Origin, With write and Object types"></picture><figcaption><p>Search and filters in the list header</p></figcaption></figure>

**How to use:**

1. In *Search Service Principal...*, type part of the name or identifier. The list is filtered as you type.
2. In **Origin**, choose *All origins*, **Third party** or **Power Monitor**.
3. In **With write**, choose *Any access*, **With write** (at least one write grant) or **Workspace admin** (administers at least one workspace).
4. In **Object types**, click the *Object type* field, search and select one or more types. The list shows the applications with a grant on **at least one** of the selected types; the field's **X** clears all selections.
5. To clear, delete the search, set **Origin** back to *All origins* and **With write** back to *Any access*, and use the **X** in **Object types**.

**How it works:** each filter change takes the list back to the first page. The filters do not change the cards.

### Service Principals list

**What it is:** the table with one application per row, 10 per page by default (the **Items per page** selector in the footer offers 10, 25, 50 and 100), with the tip *Click a row to see the grants. Write or administrator access held by third parties deserves review.* above it.

**What it is for:** comparing applications by volume and by access risk.

| Column                | Content                                                                                                                                                        | Sortable |
| --------------------- | -------------------------------------------------------------------------------------------------------------------------------------------------------------- | -------- |
| **Service Principal** | Application name. Power Monitor's gets the **Power Monitor** badge                                                                                             | Yes      |
| **Origin**            | **Third party** or **Expected access** (the Power Monitor Service Principal)                                                                                   | No       |
| **Grants**            | Number of objects (workspaces, items, gateways, connections) on which the application has direct permission                                                    | Yes      |
| **Workspaces**        | Number of distinct workspaces involved in these grants                                                                                                         | Yes      |
| **With write**        | Grants that allow changing content or administering. Highlighted (yellow) when the application is third-party and the value is greater than zero               | Yes      |
| **Workspace admin**   | Number of workspaces in which the application has the **Admin** role. Highlighted (red) when the application is third-party and the value is greater than zero | Yes      |
| **Object types**      | Object types on which the application has a grant (Workspace, Report, Dataset, Lakehouse, Gateway etc.)                                                        | No       |
| (actions)             | **Details** button, which opens the application's grants                                                                                                       | —        |

**How to use sorting:** click the header of a sortable column (the first click sorts from highest to lowest) and click again to reverse. When opened, the list is sorted by **Grants**, from highest to lowest. Use the pagination in the footer to navigate.

**Special states:** when no application matches the filters (or the environment has none), *No Service Principals with access found* is displayed. If the query fails, *Could not load the audit* is displayed with the **Try again** button.

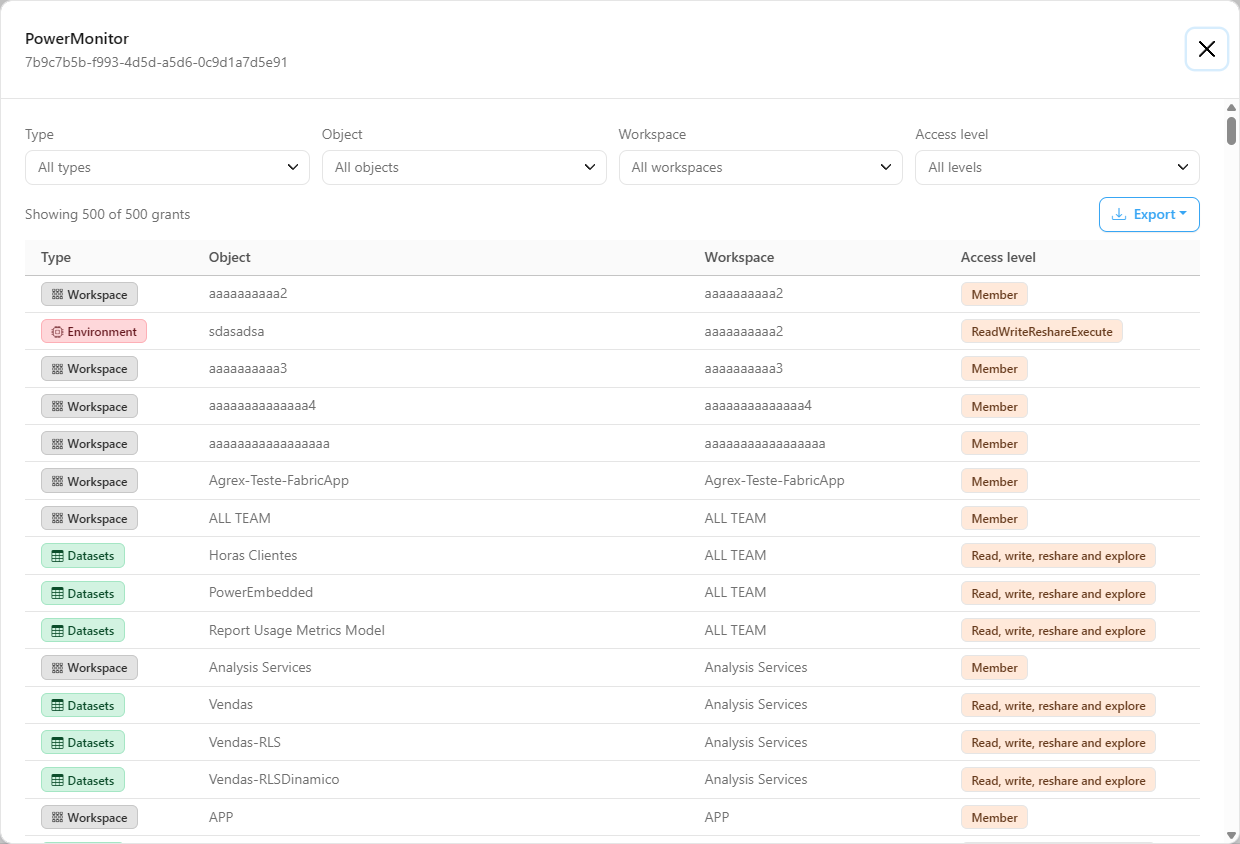
### Grants modal

**What it is:** the window opened when you click a row or the **Details** button, with the application name as the title and the identifier right below it.

**What it is for:** seeing exactly which objects the application has access to and at what level: write and administration grants come first.

<figure><picture><source srcset="/files/MoxhLrdi5y6FDaSMFFCT" media="(prefers-color-scheme: dark)"><img src="https://3938213054-files.gitbook.io/~/files/v0/b/gitbook-x-prod.appspot.com/o/spaces%2FH2bFRBmIfyK3kwVKbldl%2Fuploads%2Fgit-blob-13834fdbf5facf248d05e858414d83f975969edc%2Fpm-auditoria-service-principals-modal-concessoes-en.png?alt=media" alt="Grants modal of a Service Principal with the Type, Object, Workspace and Access level filters and the list of grants"></picture><figcaption><p>Grants of a Service Principal, with write and administration at the top</p></figcaption></figure>

**How to use:**

1. Click the application's row (or **Details**).
2. Use the **Type**, **Object**, **Workspace** and **Access level** filters: click the field, search and select the options. The counter *Showing {shown} of {total} grants* indicates how many match the filters.
3. To return to the full list, click **Clear filters** (shown only when a filter is active).
4. Close it with the **X**, the **Esc** key or by clicking outside the modal.

**How it works:**

* The filter options are taken from the application's own grants. Within a filter, selected options are combined (any of them); across different filters, all must be met.
* The table has the **Type**, **Object**, **Workspace** and **Access level** columns. Write or administration grants come first (with the access level in yellow), followed by the others, ordered by workspace and object. Gateways and connections are shown with an empty workspace (*-*).
* For the Power Monitor Service Principal, a notice says *This is Power Monitor's own Service Principal. Its access is expected by the installation.*
* The modal lists up to 500 grants per application. Beyond that, *{count} more grants not listed (limit per Service Principal). See all of them in Permissions Audit.* is displayed.

### Export (list and grants)

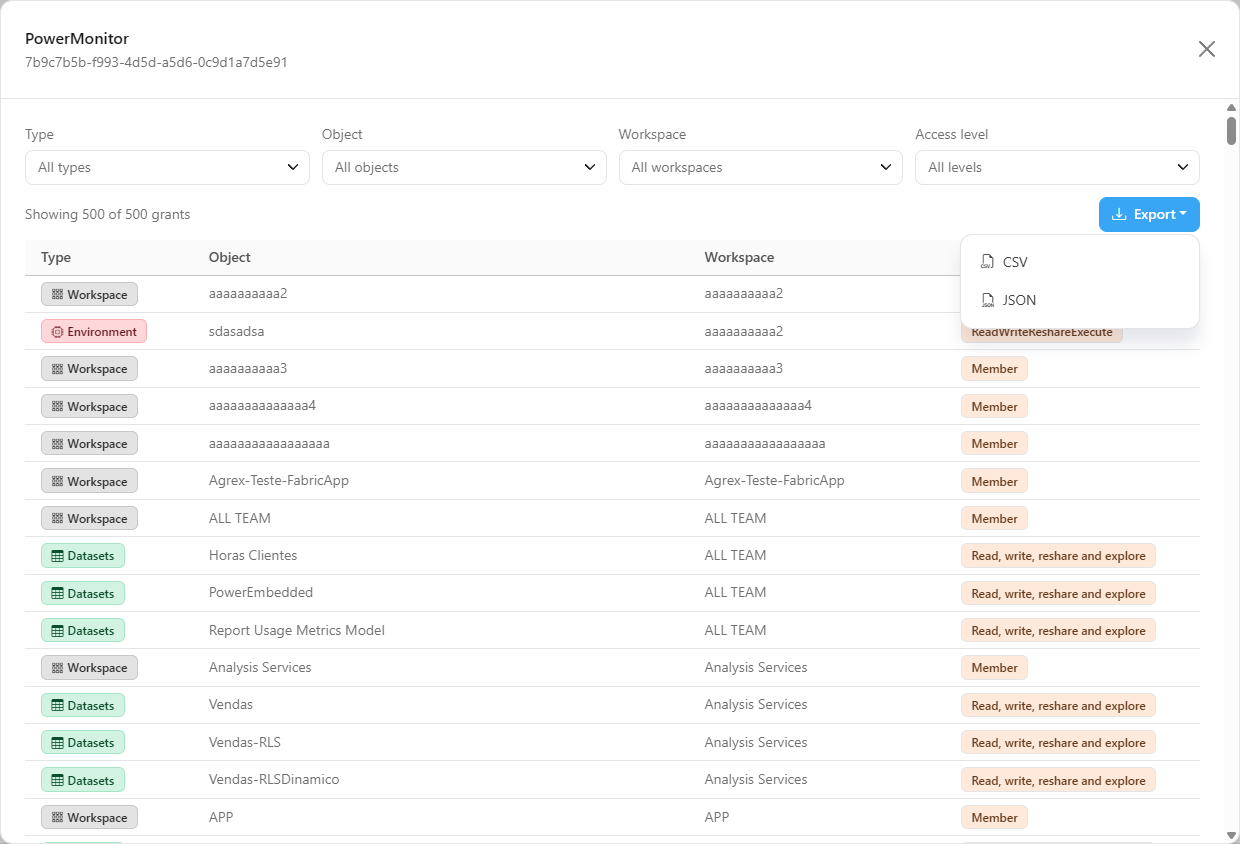
**What it is:** the **Export** button above the list and the **Export** button inside the grants modal, both with **CSV** and **JSON**.

**What it is for:** taking the application access review to the people responsible and keeping the evidence.

<figure><picture><source srcset="/files/J42iI9J0DhsAQqO2JhQF" media="(prefers-color-scheme: dark)"><img src="https://3938213054-files.gitbook.io/~/files/v0/b/gitbook-x-prod.appspot.com/o/spaces%2FH2bFRBmIfyK3kwVKbldl%2Fuploads%2Fgit-blob-c2647067cb84033fc4792fcee97838155a11f12f%2Fpm-auditoria-service-principals-modal-exportar-en.png?alt=media" alt="Grants modal with the Export menu open"></picture><figcaption><p>Exporting an application's grants</p></figcaption></figure>

**How to use:**

1. Apply the filters and sorting you want (in the list or in the modal).
2. Click **Export** and choose **CSV** or **JSON**.
3. The file is downloaded immediately.

| Where                    | Format             | Content                                                                                                                              | File name                                               |
| ------------------------ | ------------------ | ------------------------------------------------------------------------------------------------------------------------------------ | ------------------------------------------------------- |
| List (**Export** button) | **CSV**            | One row per application: Service Principal, Application ID, Origin, Grants, Workspaces, With write, Workspace admin and Object types | `service-principals-AAAA-MM-DD.csv`                     |
| List (**Export** button) | **JSON**           | The same applications, including each one's list of grants (up to 500 per application)                                               | `service-principals-AAAA-MM-DD.json`                    |
| Grants modal             | **CSV** / **JSON** | One row per grant (filtered ones only): Service Principal, Application ID, Type, Object, Workspace and Access level                  | `concessoes-service-principal-AAAA-MM-DD.csv` / `.json` |

**How it works:** the list export respects the current filters and sorting, and the button is disabled when the list is empty. The export is generated in the browser, with no additional query to the server.

## Rules and behavior

* **Data source.** The permissions come from the Power BI/Fabric inventory scans (workspaces and items) and from the gateway and connection scans, the same ones used by the [Permissions Audit](/en/power-monitor/auditoria/auditoria-de-permissoes.md). The screen does not query Microsoft Entra ID or the Power BI API when it opens and does not require additional Microsoft Graph permissions. The data reflects the latest scan: a permission granted or removed after it only appears in the next one.
* **Direct permissions only.** Only permissions granted **directly** to the application are included. An application that accesses the environment because it is a member of a group does not appear here for that access, and access inherited from the workspace to its items is not expanded (the permission on the workspace counts as one grant of type Workspace).
* **What counts as a Service Principal.** Principals of type application, Service Principal or Service Principal profile. Users, groups and the entire tenant are excluded.
* **Grant count.** Each object counts once per application.
* **What counts as write.** A grant is a write grant when the access level contains Admin, Member, Contributor, Write or Owner (for example, *Administrator*, *Member*, *Contributor*, *Read and write*, *Owner*). Read, explore, reshare and Build alone do not count as write.
* **Workspace admin.** Counts only grants of type Workspace with the **Admin** role.
* **How the Power Monitor Service Principal is recognized.** By the Client ID or Object ID configured in [Settings › Organization](/en/power-monitor/configuracoes/organizacao.md). It gets the **Power Monitor** badge and the **Expected access** origin, and is excluded from the **With write** and **Workspace admin** cards, so that every environment does not have at least one false finding.
* **Workspaces included.** All collected workspaces are included, whether monitored or not.
* **Workspace scope.** Users whose visibility is restricted to some workspaces see only the grants of those workspaces; gateway and connection permissions, which do not belong to workspaces, are shown to everyone. Cards and counts reflect what the user can see.
* **Limits.** Reading stops at 50,000 direct permissions (partial read notice) and the details list up to 500 grants per application.
* **Single load.** The data is loaded once when the screen opens; filters, sorting, pagination and export happen in the browser. To reload, refresh the browser page.
* **Load error.** If the query fails, the screen shows *Could not load the audit* with the **Try again** button.

## Step by step: common scenarios

All steps start from *Audit › Service Principals* and are available to any profile, always within the workspaces in your scope. If an administrator has blocked this page for your user in [Users](/en/power-monitor/usuarios.md), it disappears from the menu and direct access through the address leads to the **Not allowed** screen.

### How to find third-party applications with write or administration access

Use this in access reviews and to apply the principle of least privilege to service accounts.

{% stepper %}
{% step %}

### Read the cards

Check the **With write** and **Workspace admin** cards. If they are yellow or red, there are third-party applications with that type of access.
{% endstep %}

{% step %}

### Filter the origin

In the **Origin** column header, choose **Third party** to hide the Power Monitor Service Principal.
{% endstep %}

{% step %}

### Filter the access type

In the **With write** column header, choose **With write** (at least one write grant) or **Workspace admin** (administers at least one workspace).
{% endstep %}

{% step %}

### Sort by risk

Click the **Workspace admin** or **With write** column header to sort from highest to lowest. Click again to reverse.
{% endstep %}

{% step %}

### Review each application

Click the row (or **Details**) to see which objects it has write access to. Take the list to the people responsible and remove, in Power BI/Fabric, the permissions that are not needed. The screen reflects the change after the next scan.
{% endstep %}
{% endstepper %}

### How to view the grants of a Service Principal

{% stepper %}
{% step %}

### Find the application

In the **Service Principal** column header, type part of the name or identifier in *Search Service Principal...*. The list is filtered as you type.
{% endstep %}

{% step %}

### Open the details

Click the row or the **Details** button. The modal shows the application name, the identifier and all grants, with write and administration grants at the top.
{% endstep %}

{% step %}

### Filter the grants

Use the **Type**, **Object**, **Workspace** and **Access level** filters: click the field, search and select the options. The counter *Showing {shown} of {total} grants* indicates how many match the filters. Use **Clear filters** to return to the full list.
{% endstep %}

{% step %}

### Close the modal

Click the **X**, press **Esc** or click outside the modal.
{% endstep %}
{% endstepper %}

If the notice about unlisted grants appears, the application has more than 500 grants: use the [Permissions Audit](/en/power-monitor/auditoria/auditoria-de-permissoes.md) with the **User** filter set to the application name to see all of them.

### How to identify the Power Monitor Service Principal

1. Read the notice below the cards: it shows the name, the **Client ID** and the **Object ID** of the Service Principal configured for Power Monitor.
2. In the list, the corresponding application has the **Power Monitor** badge and the **Expected access** origin. To see it on its own, choose **Power Monitor** in the **Origin** column filter.
3. If the notice is yellow (*no direct grant for it was collected*), Power Monitor's access comes from the installation's security group. This is expected; to check the group, search for its name in the **User** filter of the [Permissions Audit](/en/power-monitor/auditoria/auditoria-de-permissoes.md).

### How to investigate an unknown application

{% stepper %}
{% step %}

### Note the identifier

Open the application's details and copy the identifier shown below the name (it is also exported in the **Application ID** column).
{% endstep %}

{% step %}

### Look it up in Microsoft Entra ID

In the Microsoft Entra ID portal, under *Enterprise applications*, search by the identifier or name to find the application's owner, creation date and credentials.
{% endstep %}

{% step %}

### Decide

If the application has no owner or is no longer used, remove its permissions in Power BI/Fabric (or disable the application in Entra ID, according to your organization's policy).
{% endstep %}
{% endstepper %}

## Frequently asked questions

<details>

<summary>I know an application has access, but it does not appear in the list.</summary>

The most common causes are: the access comes from a **group** the application is a member of (this screen lists only direct permissions; see the group in the [Permissions Audit](/en/power-monitor/auditoria/auditoria-de-permissoes.md)); the permission was granted after the latest scan; or the object is in a workspace outside your visibility scope.

</details>

<details>

<summary>The Power Monitor notice is yellow. Is something wrong?</summary>

Not necessarily. In the standard installation, the Power Monitor Service Principal gets access through a security group, and grants through a group do not appear on this screen. The yellow notice only indicates that no **direct** grant for it was found.

</details>

<details>

<summary>Why doesn't the Power Monitor Service Principal count in the write and administration cards?</summary>

Its access is required for data collection and is expected by the installation. Counting it would make every environment have at least one false finding. It remains in the list, with the **Power Monitor** badge, and in the total of the **Service Principals** card.

</details>

<details>

<summary>An application from my own company appears as "Third party".</summary>

"Third party" only means "it is not the Power Monitor Service Principal". Your organization's applications also fall into this category and should be reviewed the same way.

</details>

<details>

<summary>I removed a permission in Power BI and it still appears.</summary>

The screen shows the result of the latest scan. The change appears after the next scan; refresh the browser page to reload the data.

</details>

## Related pages

* [Permissions Audit](/en/power-monitor/auditoria/auditoria-de-permissoes.md): all permissions, with group expansion and workspace inheritance
* [Row-Level Security](/en/power-monitor/auditoria/seguranca-em-nivel-de-linha.md) and [Direct Sharing](/en/power-monitor/auditoria/compartilhamento-direto.md): the other access audits calculated from the same permissions
* [Permissions Dashboard](/en/power-monitor/dashboards/dashboard-de-permissoes.md): aggregated view of the same permissions
* [Governance › Workspaces](/en/power-monitor/governanca/workspaces.md): users and permissions of each workspace
* [Governance › Infrastructure › Gateways](/en/power-monitor/governanca/infraestrutura/gateways.md) and [Connections](/en/power-monitor/governanca/infraestrutura/conexoes.md)
* [Settings › Organization](/en/power-monitor/configuracoes/organizacao.md): Power Monitor Service Principal and security group
* [Installation prerequisites](/en/technical-documentation/instalacao/pre-requisitos.md): how the Power Monitor application accesses your environment
* [Users](/en/power-monitor/usuarios.md): profiles, workspace scope and page blocking


---

# Agent Instructions
This documentation is published with GitBook. GitBook is the documentation platform designed so that both humans and AI agents can read, navigate, and reason over technical content effectively. Learn more at gitbook.com.

## Querying This Documentation
If you need additional information that is not directly available in this page, you can query the documentation by asking a question.

Perform an HTTP GET request on the following URL with the `ask` and `goal` query parameters:

```
GET https://docs.powermonitor.com.br/en/power-monitor/auditoria/service-principals.md?ask=<question>&goal=<user_goal>
```

`ask` is the immediate question: it should be specific, self-contained, and written in natural language.
`goal` is what the user is ultimately trying to achieve, the reason they need the answer. Sharing it helps GitBook give you a better, more relevant answer. A goal is most helpful when it describes the outcome the user wants rather than restating the question. For example, with `ask=how do I create an API token`, a goal like `automate deployments from our CI pipeline` lets GitBook tailor the answer to that use case.

The response will contain a direct answer to the question and relevant excerpts and sources from the documentation.

Use this mechanism when the answer is not explicitly present in the current page, you need clarification or additional context, or you want to retrieve related documentation sections.