> For the complete documentation index, see [llms.txt](https://docs.powermonitor.com.br/llms.txt). Markdown versions of documentation pages are available by appending `.md` to page URLs; this page is available as [Markdown](https://docs.powermonitor.com.br/en/power-monitor/capacidades.md).
# Capacities
The Capacities menu domain brings together, in one place, all Power Monitor screens related to Microsoft Fabric and Power BI capacities.
**Capacities** is a side menu domain (right after *Governance*) that brings together, in one place, all Power Monitor screens related to Microsoft Fabric / Power BI capacities: consumption and cost dashboards, near real-time monitoring, consumption analyses, governance (pause, resume, change size (SKU)), auditing of actions and capacity scans.
The screens in this domain are **shortcuts**: each one also remains in its original domain (Dashboards, Monitoring, Governance, Audit or Mapping), and it is **the same screen** in both paths, with the same data, filters and permissions. The only difference is navigation: when you enter through *Capacities*, the domain's side menu keeps showing the list of capacity screens, which makes it easy to jump from one analysis to another (for example, from the Capacity Dashboard to Consumption Comparison and from there to Anomalies).
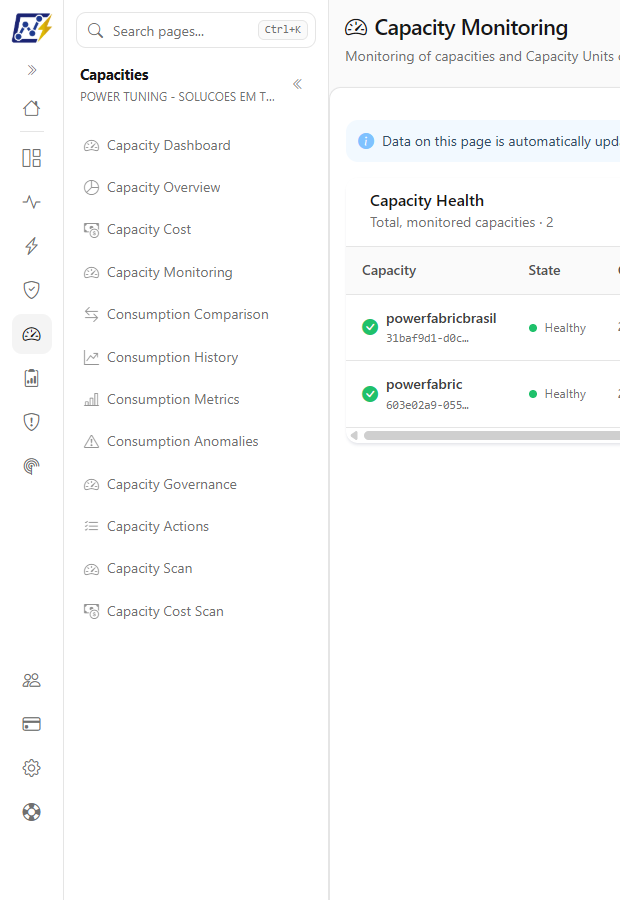
Capacities domain in the side menu
## What it is for
* **Analyzing capacities without switching areas:** capacity consumption, cost, monitoring, governance and auditing in a single menu.
* **Following an investigation end to end:** from the peak on the dashboard to the responsible execution, jumping from screen to screen without losing the menu.
* **Understanding the thresholds:** knowing what each color and status used on the capacity screens means.
## Before you start: enable monitoring
Almost all consumption screens depend on the **Microsoft Fabric Capacity Metrics App** installed in the tenant and configured as the **Capacity Metrics Source**, and show only the capacities with **monitoring enabled**. While no capacity is monitored, they display a message explaining how to enable it (administrators see the shortcut to *Settings › Monitoring*). Follow the guide [Enable Capacity Monitoring](/en/power-monitor/monitoramento/capacidades/ativar-monitoramento-de-capacidade.md).
The cost screens additionally depend on the Azure cost read permission (*Settings › Additional Permissions › Capacity Cost*), and the governance actions (pause, resume, change size (SKU)) depend on the Azure permissions of the *Capacities* card on the same page.
### How to enable monitoring for a capacity
Prerequisite: **Administrator** profile and the Microsoft Fabric Capacity Metrics App installed in the tenant, with the Service Principal having access to the app's workspace.
{% stepper %}
{% step %}
### Configure the metrics source
In *Settings › Monitoring*, in the **Capacity Metrics Source** card, select the Capacity Metrics App's **Workspace** and **Semantic model**, click **Test connection** and then **Save**.
{% endstep %}
{% step %}
### Turn on the capacity
In the **Capacities** card on the same tab, turn on the capacity's switch in the **Monitoring** column. If the list is empty, first click **Perform initial scan**.
{% endstep %}
{% step %}
### Check the result
Within a few minutes the capacity appears in *Capacities › Capacity Monitoring* and on the other consumption screens.
{% endstep %}
{% endstepper %}
The complete step-by-step guide, with permissions and error messages, is in [Enable Capacity Monitoring](/en/power-monitor/monitoramento/capacidades/ativar-monitoramento-de-capacidade.md).
## Features
### Capacities domain in the menu
**What it is:** the **Capacities** icon in the main menu (right after *Governance*), which opens the list of capacity screens in the module menu.
**What it is for:** navigating between capacity screens while always keeping the same list at hand, instead of switching between Dashboards, Monitoring, Governance, Audit and Mapping.
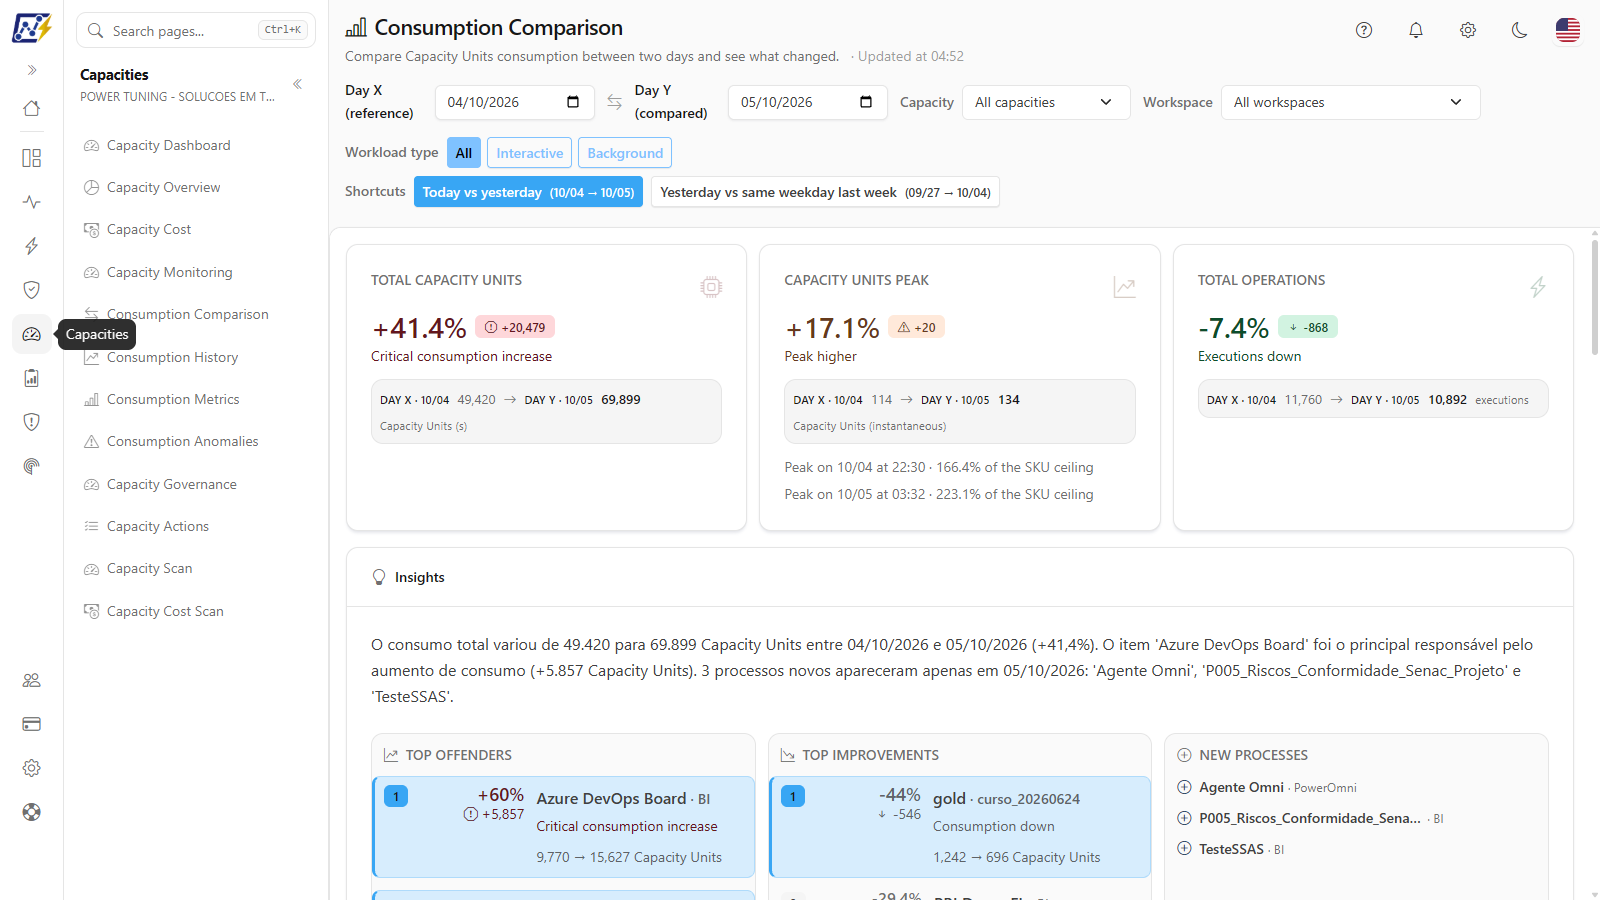
Screen opened from the Capacities domain: the menu keeps showing the capacity screens
**How to use:**
1. In the main menu, click the **Capacities** domain icon (right after *Governance*). The module menu opens with the list of capacity screens.
2. Click the screen you want, for example **Capacity Dashboard**.
3. To jump to another analysis without switching domains, click another item in the same list (for example, **Consumption Comparison**). The menu keeps showing the capacity screens.
**How it works:**
{% hint style="info" %}
**The addresses are different, the screen is the same.** Through the Capacities domain, URLs start with `/capacities/` (for example, `/capacities/consumption-comparison`); through the original domain, the URL is the original one (for example, `/monitoring/consumption-comparison`). Old links and bookmarks keep working.
{% endhint %}
### Domain screens
**What it is:** the screens gathered in the domain, each with its original domain and who can access it.
**What it is for:** knowing what each screen offers and where else it appears in the menu.
| Menu item | What it is | Original domain | Who can access |
| ----------------------------------------------------------------------------------- | ------------------------------------------------------------------------------------------------------------------------------------------------- | ------------------------------ | -------------------------------------- |
| [Capacity Dashboard](/en/power-monitor/dashboards/dashboard-de-capacidade.md) | Executive view of capacity consumption and health: today × yesterday, usage curve, top consumers, drill-down by point in time and AI explanation. | Dashboards | Everyone |
| [Capacity Overview](/en/power-monitor/dashboards/visao-geral-de-capacidades.md) | How workspaces, permissions, artifacts, utilization and usage growth are distributed across capacities. | Dashboards | Everyone |
| [Capacity Cost](/en/power-monitor/dashboards/custo-de-capacidade.md) | Actual cost of capacities in Azure, reservations, estimated allocation by workspace, item and user, and cost alerts. | Dashboards | Everyone (read) |
| [Capacity Monitoring](/en/power-monitor/monitoramento/capacidades.md) | Current state and usage percentage (cumulative, interactive and background) of each monitored capacity, updated every 5 minutes. | Monitoring (*Capacities* item) | Everyone |
| [Consumption Comparison](/en/power-monitor/monitoramento/comparativo-de-consumo.md) | Day X vs Day Y: what changed, top offenders, improvements and new processes. | Monitoring | Everyone |
| [Entity Comparison](/en/power-monitor/monitoramento/comparativo-por-entidade.md) | Two entities (workspaces, capacities, or items) side by side: consumption, efficiency, breakdown, and top consumers. | Monitoring | Everyone |
| [Consumption History](/en/power-monitor/monitoramento/historico-de-consumo.md) | Daily timeline in bands by workspace, workload or item, with concentration and variations. | Monitoring | Everyone |
| [Consumption Metrics](/en/power-monitor/monitoramento/metricas-de-consumo.md) | Each operation recorded in the day, with Capacity Units (s), duration, user and status. | Monitoring | Everyone (data reload: Administrators) |
| [Consumption Anomalies](/en/power-monitor/monitoramento/anomalias-de-consumo.md) | Items and operations that consumed above the average of the last 7 days, with e-mail notification. | Monitoring | Everyone (settings: Administrators) |
| [Capacity Governance](/en/power-monitor/governanca/infraestrutura/capacidades.md) | Capacity inventory and management: pause, resume and change size (SKU), schedules, autoscale, time and cost alerts. | Governance (*Capacities* item) | Everyone (actions: Administrators) |
| [Capacity Actions](/en/power-monitor/auditoria/acoes-de-capacidade.md) | Audit log of the actions performed on capacities (pauses, resumes, SKU changes), with the usage status at the time of the action. | Audit | Administrators |
| [Capacity Scan](/en/power-monitor/mapeamento/capacidades.md) | Running and tracking the scan that inventories the capacities. | Mapping | Administrators |
| [Capacity Cost Scan](/en/power-monitor/mapeamento/custo-de-capacidade.md) | Running and tracking the ingestion of capacity costs from Azure. | Mapping | Administrators |
The two Mapping items are hidden in the menu for non-administrators. In this domain they keep the names **Capacity Scan** and **Capacity Cost Scan**; in the **Mapping** domain, the same screens appear as **Capacities** (Inventory group) and **Capacity Cost** (Capacity and cost group). In addition, an administrator can **block specific pages per user**; blocked pages disappear from the menu in both paths.
### Which screen to use for each question
**What it is:** a quick guide that maps the most common capacity questions to the screen that answers them.
**What it is for:** going straight to the right analysis.
| Question | Screen |
| ----------------------------------------------------------------------- | ------------------------------------------------------------------------------------------------------------------------------------------------------ |
| Is any capacity close to its limit right now? | [Capacity Monitoring](/en/power-monitor/monitoramento/capacidades.md) or [Capacity Dashboard](/en/power-monitor/dashboards/dashboard-de-capacidade.md) |
| What was running at the 2 PM peak? | [Capacity Dashboard](/en/power-monitor/dashboards/dashboard-de-capacidade.md) (drill-down by point in time) |
| Why did today consume more than yesterday? | [Consumption Comparison](/en/power-monitor/monitoramento/comparativo-de-consumo.md) |
| Which workspace (or capacity) consumes more? | [Entity Comparison](/en/power-monitor/monitoramento/comparativo-por-entidade.md) |
| Which workspaces are growing the most this quarter? | [Consumption History](/en/power-monitor/monitoramento/historico-de-consumo.md) |
| Which execution, by which user, consumed so much? | [Consumption Metrics](/en/power-monitor/monitoramento/metricas-de-consumo.md) |
| Is any item outside its normal pattern? | [Consumption Anomalies](/en/power-monitor/monitoramento/anomalias-de-consumo.md) |
| How much does each capacity / workspace cost? | [Capacity Cost](/en/power-monitor/dashboards/custo-de-capacidade.md) |
| How are workspaces distributed across capacities? | [Capacity Overview](/en/power-monitor/dashboards/visao-geral-de-capacidades.md) |
| I want to pause outside business hours or change the SKU at peak times. | [Capacity Governance](/en/power-monitor/governanca/infraestrutura/capacidades.md) |
| Who paused or changed the size (SKU) of the capacity? | [Capacity Actions](/en/power-monitor/auditoria/acoes-de-capacidade.md) |
### Statuses and thresholds used on the capacity screens
**What it is:** the usage ranges that define colors, statuses and alerts on the capacity screens.
**What it is for:** correctly interpreting a "Warning", a "Saturated" or a background alert.
**How it works:**
Power Monitor uses different sets of ranges depending on the purpose. All of them are based on the percentage of Capacity Units used relative to the SKU.
**Monitoring colors and statuses** ([Capacity Monitoring](/en/power-monitor/monitoramento/capacidades.md)):
| Cumulative usage | Status |
| ----------------- | ------------ |
| Below 60% | **Healthy** |
| 60% to 79.99% | **Warning** |
| 80% or more | **Critical** |
| Inactive capacity | **Inactive** |
**Capacity usage status** (for example, in the [Capacity Actions](/en/power-monitor/auditoria/acoes-de-capacidade.md) log):
| Total usage | Status |
| -------------- | ----------------------------------------------- |
| Below 20% | **Idle** |
| 20% to 84.9% | **Normal** |
| 85% to 99.9% | **Saturated** |
| 100% or more | **Critical** (Microsoft may apply *throttling*) |
| No measurement | **Unknown** |
**Capacity alerts** (e-mail and the [Alerts](/en/power-monitor/monitoramento/alertas.md) screen): an incident when cumulative usage reaches **80%**; **background usage** warnings starting at about 50%, at most one per day in each range (50%, 70%, 80% and 100%); inactive capacity alert; and an alert when no consumption data arrives for more than 45 minutes. The environment's hourly checklist uses the background threshold configurable in *Settings › Monitoring* (default 50%).
### Investigating a consumption peak
**What it is:** the walkthrough that combines several screens of the domain to find out what caused a peak.
**What it is for:** answering "what consumed so much?" in a few minutes, with evidence for the item owner.
**How to use:**
{% stepper %}
{% step %}
### Identify the peak
Open the [Capacity Dashboard](/en/power-monitor/dashboards/dashboard-de-capacidade.md), choose the capacity and locate the peak on the usage curve.
{% endstep %}
{% step %}
### See what was running at that moment
Use the Capacity Dashboard's drill-down by point in time to list the items and operations that were consuming at that moment.
{% endstep %}
{% step %}
### Compare with a normal day
Open [Consumption Comparison](/en/power-monitor/monitoramento/comparativo-de-consumo.md) and compare the peak day with a reference day to see the top offenders and new processes.
{% endstep %}
{% step %}
### Find the responsible execution
In [Consumption Metrics](/en/power-monitor/monitoramento/metricas-de-consumo.md), filter by day and item to see each operation, with user, duration and Capacity Units (s). If the item is outside its normal pattern, it also appears in [Consumption Anomalies](/en/power-monitor/monitoramento/anomalias-de-consumo.md).
{% endstep %}
{% endstepper %}
### Reducing cost outside business hours
**What it is:** the walkthrough that uses capacity cost, governance and auditing to pause capacities when nobody is using them.
**What it is for:** saving on capacities billed by the hour without affecting working hours.
**How to use:**
1. Check the current cost in [Capacity Cost](/en/power-monitor/dashboards/custo-de-capacidade.md).
2. In [Capacity Governance](/en/power-monitor/governanca/infraestrutura/capacidades.md), an **Administrator** creates a schedule to pause the capacity outside business hours and resume it before the start of the day (requires the Azure permissions of the *Capacities* card in *Settings › Additional Permissions*).
3. Track the pauses and resumes performed in [Capacity Actions](/en/power-monitor/auditoria/acoes-de-capacidade.md).
## Related pages
* [Enable Capacity Monitoring](/en/power-monitor/monitoramento/capacidades/ativar-monitoramento-de-capacidade.md)
* [Capacity Monitoring](/en/power-monitor/monitoramento/capacidades.md)
* [Capacity Dashboard](/en/power-monitor/dashboards/dashboard-de-capacidade.md)
* [Capacity Governance](/en/power-monitor/governanca/infraestrutura/capacidades.md)
* [Settings](/en/power-monitor/configuracoes.md)
---
# Agent Instructions
This documentation is published with GitBook. GitBook is the documentation platform designed so that both humans and AI agents can read, navigate, and reason over technical content effectively. Learn more at gitbook.com.
## Querying This Documentation
If you need additional information that is not directly available in this page, you can query the documentation by asking a question.
Perform an HTTP GET request on the following URL with the `ask` and `goal` query parameters:
```
GET https://docs.powermonitor.com.br/en/power-monitor/capacidades.md?ask=&goal=
```
`ask` is the immediate question: it should be specific, self-contained, and written in natural language.
`goal` is what the user is ultimately trying to achieve, the reason they need the answer. Sharing it helps GitBook give you a better, more relevant answer. A goal is most helpful when it describes the outcome the user wants rather than restating the question. For example, with `ask=how do I create an API token`, a goal like `automate deployments from our CI pipeline` lets GitBook tailor the answer to that use case.
The response will contain a direct answer to the question and relevant excerpts and sources from the documentation.
Use this mechanism when the answer is not explicitly present in the current page, you need clarification or additional context, or you want to retrieve related documentation sections.