> For the complete documentation index, see [llms.txt](https://docs.powermonitor.com.br/llms.txt). Markdown versions of documentation pages are available by appending `.md` to page URLs; this page is available as [Markdown](https://docs.powermonitor.com.br/en/power-monitor/configuracoes.md).
# Settings
Overview of Power Monitor Settings and what each of the seven tabs controls.
**Settings** brings together Power Monitor's global configuration for your organization: integration with the Microsoft tenant, what is collected and how often, who is notified and through which channel, AI features and extra permissions. Everything configured here affects the entire organization.
**How to access:** at the bottom of the side menu, click **Settings** (or the gear icon in the upper right corner). The area is exclusive to **Administrators**: the item does not even appear in the menu for other profiles. On mobile phones, the tabs become a drop-down list at the top of the page.
## What it is for
* Getting a newly installed environment ready for use (integration, permissions, collections, alerts and AI).
* Adjusting, in a single place, Power Monitor's behavior for the entire organization.
* Investigating why data is not arriving or an alert is not being sent (credential, permission, collection turned off, recipient turned off).
## Features
### Tab navigation
**What it is:** the tab bar at the top of the Settings area, one tab for each group of parameters.
**What it is for:** going straight to the subject you want to adjust, without searching through menus.
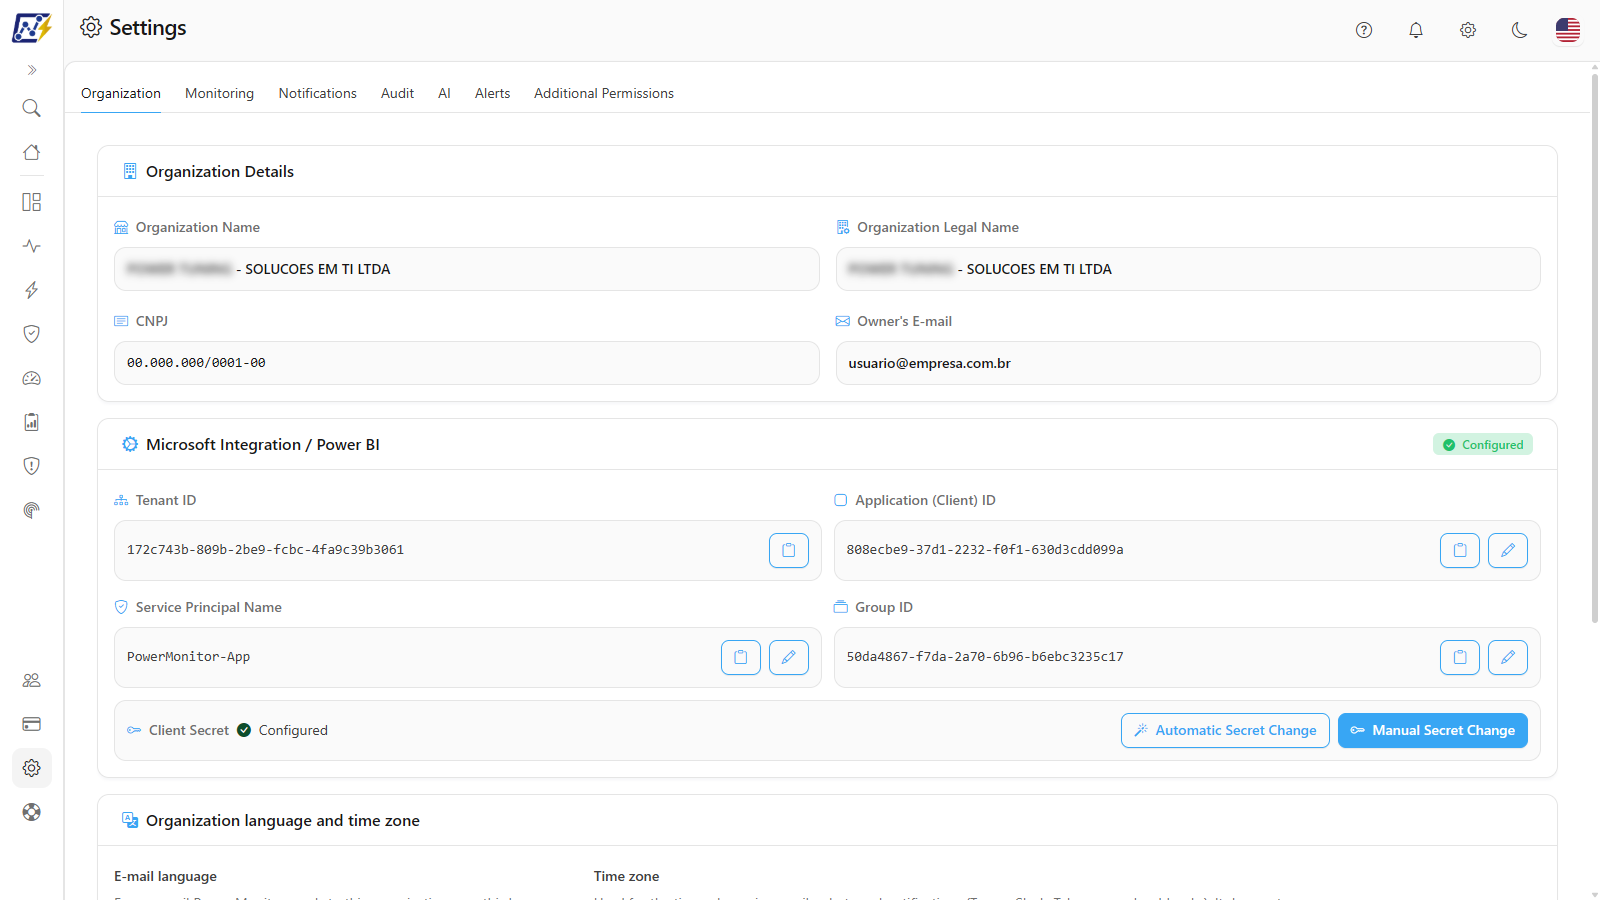
Settings and its tabs
**How to use:**
1. Sign in with an **Administrator** user.
2. At the bottom of the side menu, click **Settings** (or the gear icon in the upper right corner). The area opens on the **Organization** tab.
3. Click the tab you want. The active tab is highlighted and its content appears right below.
| Tab | What you configure | Page |
| -------------------------- | ------------------------------------------------------------------------------------------------------------------------------------------------------------------------------------------------------------------------------------------------------------------------------------------------------------------------------------ | ---------------------------------------------------------------------------------- |
| **Organization** | Registration data, Microsoft integration (Tenant ID, Service Principal, Group ID), credential and secret replacement, organization e-mail language and time zone, refresh reprocessing. | [Organization](/en/power-monitor/configuracoes/organizacao.md) |
| **Monitoring** | Monitoring per capacity, metrics source (Fabric Capacity Metrics), scans and collections (with a daily, weekly or monthly frequency per scan), monitoring of gateways, semantic models and Fabric Jobs, activity log collection and drift alerts (models and tenant settings), behavior risk status, execution time deviation alert. | [Monitoring](/en/power-monitor/configuracoes/monitoramento.md) |
| **Notifications** | Which e-mail alerts exist (including capacity off schedule and capacity cost) and who receives each one, filters by severity, notice to the artifact creator and sending a test e-mail. | [Notifications](/en/power-monitor/configuracoes/notificacoes.md) |
| **Audit** | Automatic collection of Power BI activity logs and audit integration with Power Embedded. | [Audit](/en/power-monitor/configuracoes/auditoria.md) |
| **AI** | AI providers and API keys, monthly spending limit, sharing Power Query with AI, AI consumption. | [AI](/en/power-monitor/configuracoes/ia.md) |
| **Alerts** | Delivery channels: your own SMTP account and the Microsoft Teams, Slack and Telegram channels; webhooks and ITSM tool integrations; public API keys (see also [Webhooks and public API](/en/power-monitor/configuracoes/webhooks-e-api-publica.md)). | [Alerts](/en/power-monitor/configuracoes/alertas.md) |
| **Additional Permissions** | Collection health and checking and granting the optional permissions in Fabric, Entra ID (Graph) and Azure. | [Additional Permissions](/en/power-monitor/configuracoes/permissoes-adicionais.md) |
### Each tab's own address
**What it is:** each tab has its own address (URL), for example `/settings/ai` for the **AI** tab and `/settings/notifications` for **Notifications**.
**What it is for:** bookmarking a tab in the browser or sending the direct link to another administrator.
**How to use:**
1. Open the tab you want.
2. Copy the address from the browser bar or add it to your bookmarks. When the link is opened, the Settings area opens directly on that tab.
**How it works:** old addresses keep working and redirect to the current location. For example, `/settings/users` leads to [Users](/en/power-monitor/usuarios.md), `/settings/billing` leads to [Billing](/en/power-monitor/faturamento.md) and `/settings/azure-cost-access` leads to **Additional Permissions**, where access to Azure cost is granted in the **Capacity Cost** card.
### Tab list on narrow screens
**What it is:** on mobile phones and narrow windows, the tab bar is replaced by a drop-down list that takes up the full width and shows the icon and name of the current tab.
**What it is for:** navigating Settings on a mobile phone without having to scroll the tab bar sideways.
**How to use:**
1. Tap the drop-down list at the top of the page.
2. Choose the tab. The current tab is marked in the list.
{% hint style="info" %}
**Users** and **Billing** are at the bottom of the menu, as separate items, and not inside Settings. See [Users](/en/power-monitor/usuarios.md) and [Billing](/en/power-monitor/faturamento.md).
{% endhint %}
## How the tabs relate to each other
* **Organization** and **Additional Permissions** ensure that Power Monitor can connect to your environment.
* **Monitoring** and **Audit** define what is collected.
* **Notifications** defines **which** alerts are sent by e-mail and **to whom**; **Alerts** defines **through which channel** they are sent (your own SMTP, Teams, Slack, Telegram).
* **AI** enables the AI features (assistant, "Explain with AI", suggestions) and controls their cost.
## Step by step
### How to configure a newly installed environment
Use this sequence right after installation, to get the organization ready for use.
{% stepper %}
{% step %}
### Check the integration
In [Organization](/en/power-monitor/configuracoes/organizacao.md), check that the integration appears as **Configured** and that the App Secret is registered. In the same place, check the organization's **E-mail language** and **Time zone**.
{% endstep %}
{% step %}
### Grant the optional permissions
In [Additional Permissions](/en/power-monitor/configuracoes/permissoes-adicionais.md), use **Grant all needed permissions** or grant them card by card.
{% endstep %}
{% step %}
### Adjust monitoring
In [Monitoring](/en/power-monitor/configuracoes/monitoramento.md), confirm the **Capacity Metrics Source**, turn on the capacities that should be monitored and review the scans.
{% endstep %}
{% step %}
### Define who is notified
In [Notifications](/en/power-monitor/configuracoes/notificacoes.md), review the recipients of each alert. In [Alerts](/en/power-monitor/configuracoes/alertas.md), connect Teams, Slack or Telegram, if you wish.
{% endstep %}
{% step %}
### Enable AI (optional)
In [AI](/en/power-monitor/configuracoes/ia.md), register a provider's key and set the monthly spending limit.
{% endstep %}
{% endstepper %}
### How to find out why an alert did not arrive
Use this when someone was expecting an alert e-mail or message that did not arrive.
{% stepper %}
{% step %}
### Recipient
In [Notifications](/en/power-monitor/configuracoes/notificacoes.md), open the alert and confirm that the person is turned on as a recipient. Use **Test** to receive a sample in your e-mail.
{% endstep %}
{% step %}
### User scope
In [Users](/en/power-monitor/usuarios.md), check whether the user has the alert's workspace in **Receives alerts** (mandatory for the User role).
{% endstep %}
{% step %}
### Channel
In [Alerts](/en/power-monitor/configuracoes/alertas.md), test the SMTP connection (if you use your own server) or use **Send test** on the Teams, Slack or Telegram channel.
{% endstep %}
{% step %}
### Collection
In [Monitoring](/en/power-monitor/configuracoes/monitoramento.md), confirm that monitoring of the resource (capacity, gateway, model or job) is **Active**.
{% endstep %}
{% endstepper %}
## Related pages
* [Users](/en/power-monitor/usuarios.md)
* [Billing](/en/power-monitor/faturamento.md)
* [Interface and navigation](/en/power-monitor/interface-e-navegacao.md)
* [AI Assistant](/en/power-monitor/assistente-de-ia.md)
---
# Agent Instructions
This documentation is published with GitBook. GitBook is the documentation platform designed so that both humans and AI agents can read, navigate, and reason over technical content effectively. Learn more at gitbook.com.
## Querying This Documentation
If you need additional information that is not directly available in this page, you can query the documentation by asking a question.
Perform an HTTP GET request on the following URL with the `ask` and `goal` query parameters:
```
GET https://docs.powermonitor.com.br/en/power-monitor/configuracoes.md?ask=&goal=
```
`ask` is the immediate question: it should be specific, self-contained, and written in natural language.
`goal` is what the user is ultimately trying to achieve, the reason they need the answer. Sharing it helps GitBook give you a better, more relevant answer. A goal is most helpful when it describes the outcome the user wants rather than restating the question. For example, with `ask=how do I create an API token`, a goal like `automate deployments from our CI pipeline` lets GitBook tailor the answer to that use case.
The response will contain a direct answer to the question and relevant excerpts and sources from the documentation.
Use this mechanism when the answer is not explicitly present in the current page, you need clarification or additional context, or you want to retrieve related documentation sections.