> For the complete documentation index, see [llms.txt](https://docs.powermonitor.com.br/llms.txt). Markdown versions of documentation pages are available by appending `.md` to page URLs; this page is available as [Markdown](https://docs.powermonitor.com.br/en/power-monitor/configuracoes/monitoramento.md).

# Monitoring

Define what Power Monitor collects and how often: capacities, metrics source, scans (daily, weekly or monthly), gateways, semantic models, Fabric Jobs, audit and compliance and execution duration devi

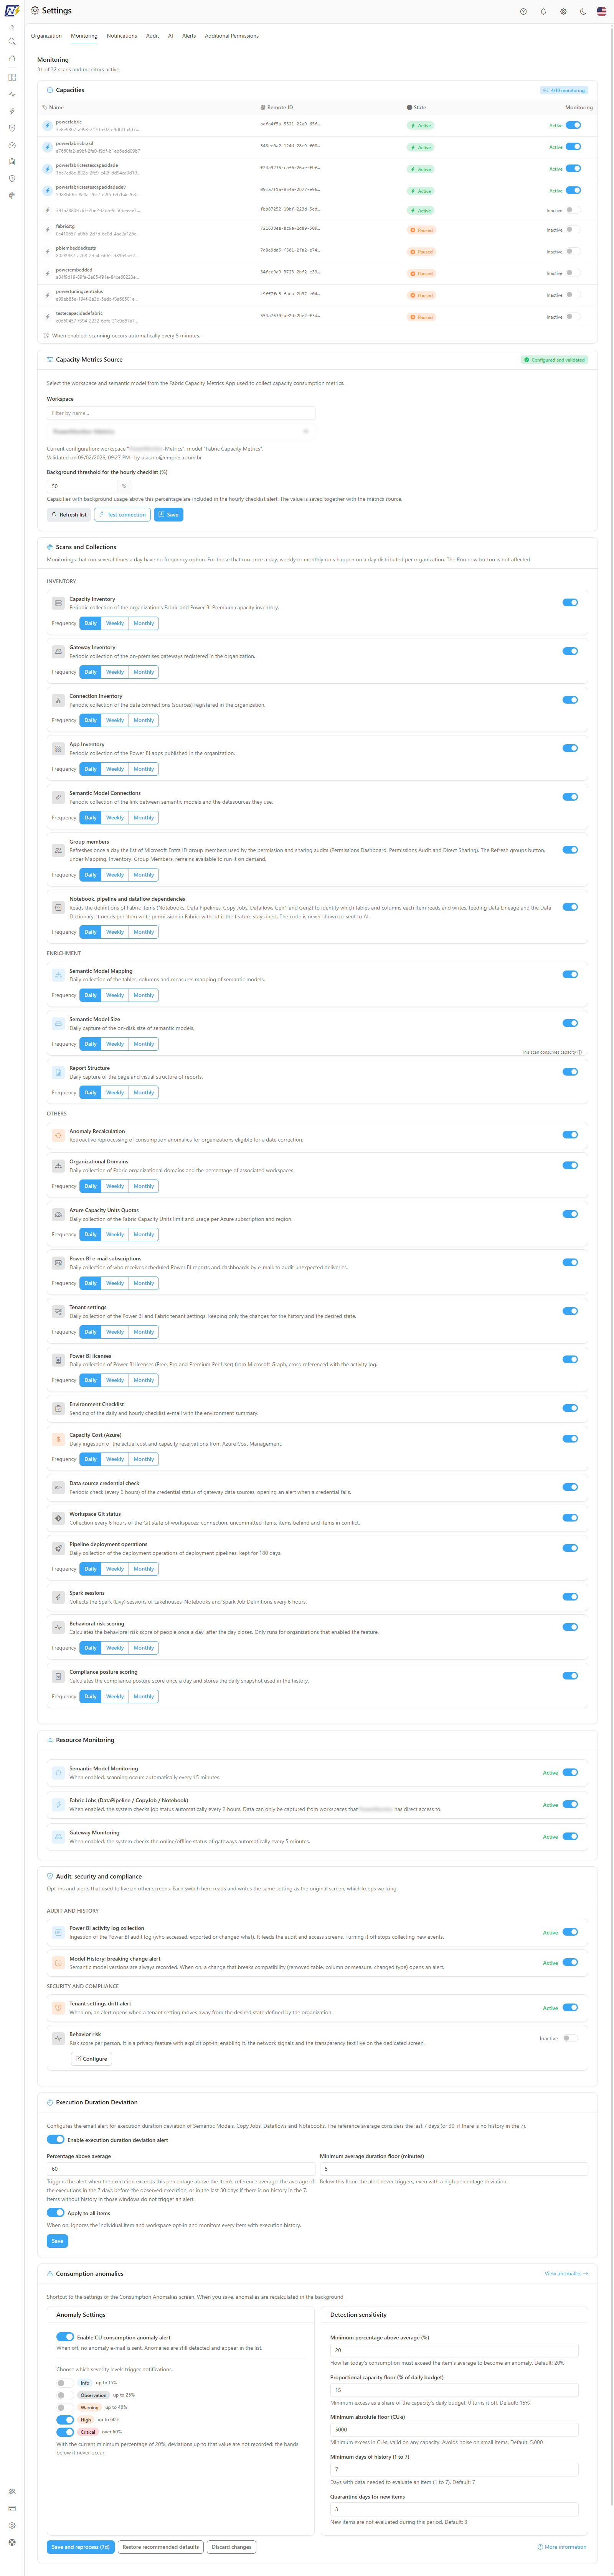
The **Monitoring** tab brings together all of Power Monitor's collection and monitoring switches: which capacities have their consumption monitored, where capacity metrics come from, which periodic scans and collections run and **how often** (daily, weekly or monthly), monitoring of gateways, semantic models and Fabric Jobs, the audit, security and compliance opt-ins, the average execution duration deviation alert and a shortcut to the consumption anomaly settings.

**How to access:** *Settings › Monitoring*. Exclusive to **Administrators**.

<figure><picture><source srcset="/files/ThyEih7RFvfubIoybl8R" media="(prefers-color-scheme: dark)"><img src="https://3938213054-files.gitbook.io/~/files/v0/b/gitbook-x-prod.appspot.com/o/spaces%2FH2bFRBmIfyK3kwVKbldl%2Fuploads%2Fgit-blob-0ad669f82896147c6a3b26dda792f08d80dc3e9e%2Fpm-configuracoes-monitoramento-pagina-en.png?alt=media" alt="Monitoring tab with the summary of active scans and the configuration sections"></picture><figcaption><p>Monitoring tab</p></figcaption></figure>

## What it is for

* Turning on consumption monitoring for the capacities that matter to you.
* Pointing Power Monitor to the **Fabric Capacity Metrics App** installed in your tenant and validating the connection.
* Turning off collections your organization does not need (for example, Azure cost or quotas).
* Reducing the collection load by choosing, per scan, the **Daily**, **Weekly** or **Monthly** frequency.
* Turning on/off automatic monitoring of gateways, semantic model refreshes and Fabric Jobs.
* Turning on or off the collection of the Power BI activity log and the alerts for breaking model changes and tenant settings drift, and turning behavior risk scoring on or off.
* Configuring the alert for executions that are much slower than normal.
* Adjusting the CU consumption anomaly alert without leaving the tab.

## Features

The page is organized into sections, in the order below. Every monitoring of the platform has its switch here. Changes made with the switches are saved immediately, with no save button; the result appears in a green (success) or red (error) banner at the top of the page, which can be closed with the **x**.

### Summary of active scans and monitors

**What it is:** the line below the **Monitoring** title that summarizes how many collections are turned on, for example **30 of 32 scans and monitors active**.

**What it is for:** knowing at a glance whether any collection has been turned off, without going through the whole page.

<figure><picture><source srcset="/files/gHxBKHUuHn2kdjR9ze5X" media="(prefers-color-scheme: dark)"><img src="https://3938213054-files.gitbook.io/~/files/v0/b/gitbook-x-prod.appspot.com/o/spaces%2FH2bFRBmIfyK3kwVKbldl%2Fuploads%2Fgit-blob-75215292e0578f9266a23056d367cf68067876b6%2Fpm-configuracoes-monitoramento-resumo-cabecalho-en.png?alt=media" alt="Monitoring title with the summary of active scans and monitors"></picture><figcaption><p>Header summary</p></figcaption></figure>

**How it works:** the total adds up the 24 scans and collections in **Scans and Collections**, the 3 cards in **Resource Monitoring**, capacity monitoring (which counts as active when at least one capacity is monitored) and the items of the **Audit, security and compliance** section that could be loaded (up to 4). The number is updated every time a switch is changed.

### Capacities

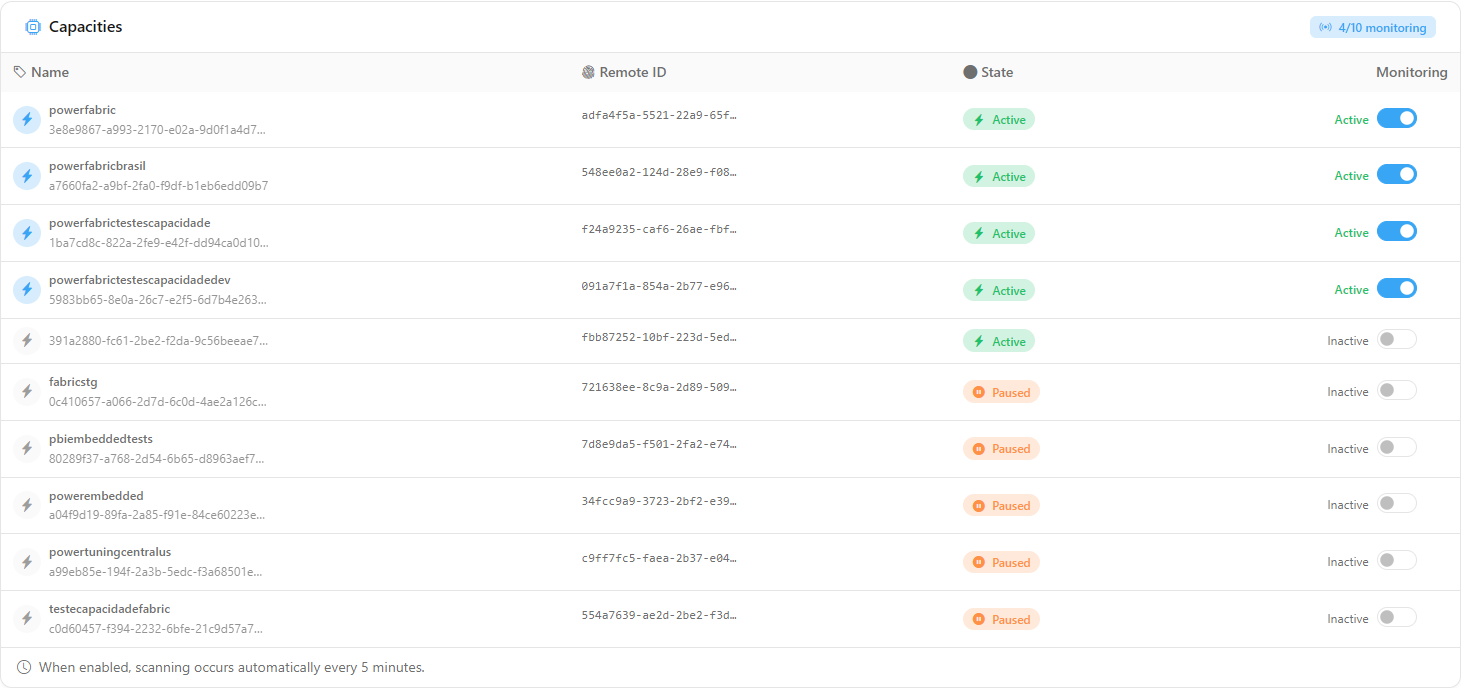
**What it is:** the table with the capacities present in the Capacity Metrics App model configured in the [Capacity Metrics Source](#capacity-metrics-source) and the monitoring switch for each one. Capacities that are not monitored yet appear with the switch off, ready to be turned on. The **N/M monitoring** badge, in the header, shows how many are turned on.

**What it is for:** choosing which capacities have their consumption collected and displayed on the capacity screens.

<figure><picture><source srcset="/files/EqpeqjHIfCShoj0fBSoE" media="(prefers-color-scheme: dark)"><img src="https://3938213054-files.gitbook.io/~/files/v0/b/gitbook-x-prod.appspot.com/o/spaces%2FH2bFRBmIfyK3kwVKbldl%2Fuploads%2Fgit-blob-1bf1c7c9a534292f1a63366714a1f1dc2000b9b9%2Fpm-configuracoes-monitoramento-capacidades-en.png?alt=media" alt="Capacities section with the capacities table and the monitoring switches"></picture><figcaption><p>Capacities section</p></figcaption></figure>

| Column         | Content                                                                                                   |
| -------------- | --------------------------------------------------------------------------------------------------------- |
| **Name**       | Capacity name (and, below it, the internal identifier). The icon is colored when monitoring is turned on. |
| **Remote ID**  | Capacity identifier in Fabric/Power BI.                                                                   |
| **State**      | **Active**, **Paused**, **Inactive** or **Unknown** badge.                                                |
| **Monitoring** | **Active/Inactive** text and the switch.                                                                  |

**How to use:**

1. Find the capacity by **Name** or by **Remote ID**.
2. Click the switch in the **Monitoring** column. The change is saved immediately, with no confirmation: *Monitoring enabled successfully.* (or *disabled*) is displayed.
3. Check the **N/M monitoring** badge.

**How it works:**

* With monitoring active, consumption metrics are collected automatically **every 5 minutes** (as stated in the table footer).
* This collection queries the Capacity Metrics App and may consume capacity. That is why the table footer also shows the note **This scan consumes capacity** (or **May consume capacity**), with an **i** that explains the consumption. The note does not appear when the app is in a Pro workspace. See [Fabric capacity consumption](#fabric-capacity-consumption).
* Capacities with monitoring turned off do not appear on the consumption screens (Capacities, Consumption History, Capacity Dashboard etc.).
* During installation, once the metrics source is validated, Power Monitor can automatically turn on monitoring for all capacities present in that source. The autoscale feature also turns on monitoring for the capacity it manages.
* Paused capacities do not generate consumption data, even with monitoring turned on.
* **Premium Per User (PPU)** capacities do not appear in the list, because they have no consumption in the Capacity Metrics App.

### Capacities outside the metrics source

**What it is:** the **Outside the metrics source** list, shown below the table when a capacity still has monitoring turned on but is no longer in the model configured in the Capacity Metrics Source (for example, after changing the Capacity Metrics App workspace or when the capacity leaves the app). Each row shows the name, the identifier, and the **Turn off monitoring** button.

**What it is for:** stopping data collection and alerts for a capacity that the metrics source no longer measures.

**How to use:** click **Turn off monitoring** on the capacity's row. It leaves the list.

**Rules:**

* These capacities are not part of the main table or the **N/M monitoring** badge, and do not appear in the capacity selectors of the consumption screens (such as [Entity Comparison](/en/power-monitor/monitoramento/comparativo-por-entidade.md)).
* Monitoring cannot be **turned on** for a capacity outside the metrics source; the only available action is turning it off.
* Consumption totals on the screens keep including what was already collected from these capacities while monitoring is on.

### Initial capacity scan

**What it is:** the **No capacities found** state, displayed when Power Monitor does not yet know any capacity, with the **Perform initial scan** button.

**What it is for:** discovering the tenant's capacities right after installation, without waiting for the daily inventory.

**How to use:**

1. Configure the [Capacity Metrics Source](#capacity-metrics-source) (workspace and model of the Capacity Metrics app). While it is not configured, the empty state asks for exactly that.
2. Click **Perform initial scan**. The button triggers the capacity scan (the same one as in *Mapping › Capacities*) and **Scanning in progress...** is displayed.
3. Wait: the scan is tracked until the end and, when it finishes, *Scan completed. The capacity list has been updated.* is displayed. The capacities present in the metrics source model enter the table with monitoring turned off; turn on the ones you want.

**Rules:** if tracking stops before the end, *The scan stopped being tracked before it finished...* is displayed: the scan may keep running in the background; reload the page later. Consumption of each capacity is only collected after its monitoring is turned on.

### Reactivate monitoring (automatic cycle stopped)

**What it is:** the yellow **Automatic cycle stopped** panel, which appears above the table when monitoring is enabled but the automatic collection cycle was interrupted by internal failures. It shows the **Last error** and the **Reactivate monitoring** button.

**What it is for:** resuming consumption collection without opening a ticket when the failure has already been resolved.

**How to use:**

1. Read the **Last error** displayed in the panel.
2. Click **Reactivate monitoring**. *Monitoring reactivated successfully.* is displayed.
3. If the panel comes back, check the metrics source (**Configured and validated** badge) and open a ticket in [Support](/en/power-monitor/suporte.md) with the error displayed.

### Capacity Metrics Source

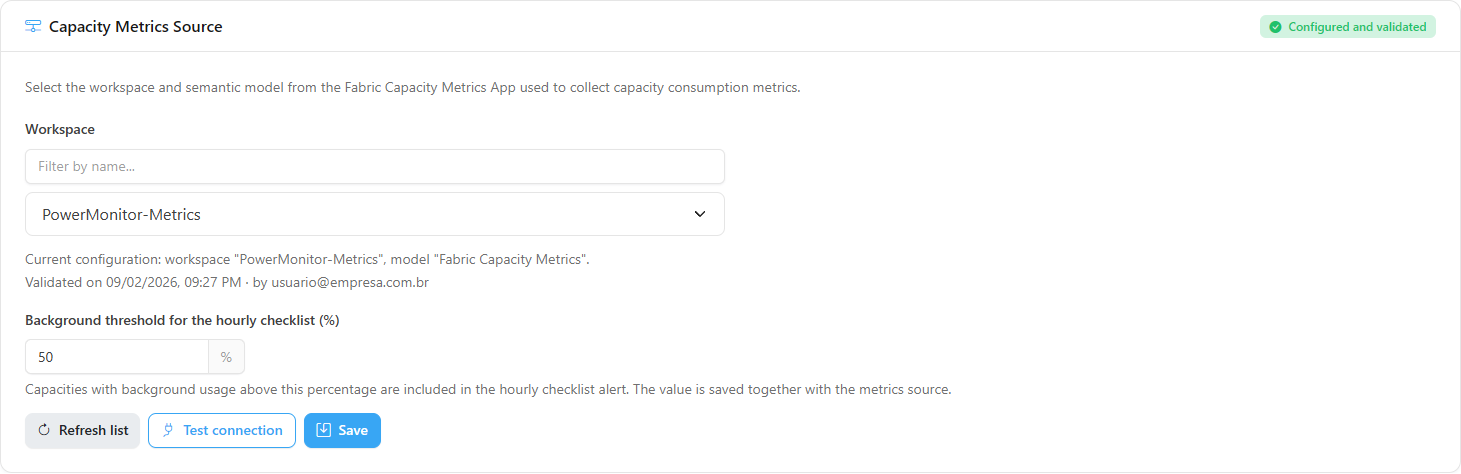
**What it is:** the card that defines where capacity consumption (Capacity Units, background and interactive) comes from: the semantic model of the **Fabric Capacity Metrics App**, Microsoft's official app installed in your tenant. The header badge shows **Configured and validated**, **Not configured** or **Validation failed**.

**What it is for:** connecting Power Monitor to the metrics app and confirming that reading works. Without this source, there is no capacity consumption data.

<figure><picture><source srcset="/files/VDN4fmcHlsZqSwYaiwzl" media="(prefers-color-scheme: dark)"><img src="https://3938213054-files.gitbook.io/~/files/v0/b/gitbook-x-prod.appspot.com/o/spaces%2FH2bFRBmIfyK3kwVKbldl%2Fuploads%2Fgit-blob-adf0517d39ab564cc5b7ce0335d889fa3085a42f%2Fpm-configuracoes-monitoramento-fonte-metricas-en.png?alt=media" alt="Capacity Metrics Source card with workspace and semantic model selection"></picture><figcaption><p>Capacity Metrics Source</p></figcaption></figure>

| Field / button                                        | Description                                                                                                                                                                 |
| ----------------------------------------------------- | --------------------------------------------------------------------------------------------------------------------------------------------------------------------------- |
| **Workspace**                                         | Workspace where the Capacity Metrics App is installed, with the **Filter by name...** field above the list. Only workspaces the Service Principal has access to appear.     |
| **Semantic model**                                    | Appears only when the workspace has more than one semantic model; with a single model, it is chosen automatically.                                                          |
| **Background threshold for the hourly checklist (%)** | See the next feature.                                                                                                                                                       |
| **Refresh list**                                      | Reloads the list of workspaces (useful right after granting access to the Service Principal).                                                                               |
| **Test connection**                                   | Runs the validation without saving.                                                                                                                                         |
| **Save**                                              | Validates and saves.                                                                                                                                                        |
| **Current configuration**                             | Shows the saved workspace and model, the validation date and who configured it (the email is shown masked when the **Hide data** button is on in any Power Monitor screen). |

**How to use:** see the step-by-step guide [How to configure the capacity metrics source](#how-to-configure-the-capacity-metrics-source).

**Validation messages:**

| Message                                                                                                | What to do                                                                                                                                                                                               |
| ------------------------------------------------------------------------------------------------------ | -------------------------------------------------------------------------------------------------------------------------------------------------------------------------------------------------------- |
| The Service Principal does not have Build permission on the selected semantic model.                   | Grant Build permission (or a workspace role) to the Service Principal.                                                                                                                                   |
| The selected semantic model does not have the structure expected from the Fabric Capacity Metrics App. | Confirm that you chose the app's model. If so, the version is outdated: uninstall and reinstall the Fabric Capacity Metrics App.                                                                         |
| The Fabric Capacity Metrics App in this workspace has no capacity loaded yet.                          | Open the app in Power BI, finish connecting its data and wait for the semantic model to refresh, then click **Test connection**.                                                                         |
| Could not reach the selected workspace or semantic model.                                              | Check the Service Principal's access to the workspace.                                                                                                                                                   |
| The selected workspace does not contain any semantic model.                                            | Choose the workspace where the app is installed.                                                                                                                                                         |
| The semantic model query API (DatasetExecuteQueries) is disabled in the tenant.                        | Use **Enable and test again** (with a Fabric Administrator account) or **Open Fabric settings** and include the Power Monitor group in *Integration settings › Semantic Model Execute Queries REST API*. |
| **No workspaces available**                                                                            | The Service Principal does not yet have access to any monitored workspace. Use **Grant workspace access**, which leads to *Governance › Workspaces*.                                                     |

When the failure comes from Power BI, the card also shows the **Power BI response**, with the original error text, to make diagnosis easier.

{% hint style="info" %}
**Recommendation: install the Capacity Metrics App in a Pro workspace.** Microsoft itself recommends installing the app in a Pro workspace to avoid throttling, and Power Monitor works normally with it there. In a Pro (or Premium Per User) workspace, the queries Power Monitor runs on the app every 5 minutes **consume no capacity**. If the app workspace is on a capacity, these queries consume its CU, and administrators start seeing a notice at the top of the screens. See [Capacity Metrics app workspace notice](#capacity-metrics-app-workspace-notice).
{% endhint %}

### Background threshold for the hourly checklist

**What it is:** the **Background threshold for the hourly checklist (%)** field, inside the **Capacity Metrics Source** card.

**What it is for:** defining the background usage percentage from which a capacity is highlighted in the **Hourly Checklist** e-mail. Increase it to receive fewer warnings; decrease it to be warned earlier.

<figure><picture><source srcset="/files/U1T5f3gLbx3uPLTyWC3S" media="(prefers-color-scheme: dark)"><img src="https://3938213054-files.gitbook.io/~/files/v0/b/gitbook-x-prod.appspot.com/o/spaces%2FH2bFRBmIfyK3kwVKbldl%2Fuploads%2Fgit-blob-44cda483444ca8ac8464591af771b2875e5160cb%2Fpm-configuracoes-monitoramento-limiar-background-en.png?alt=media" alt="Background threshold for the hourly checklist field"></picture><figcaption><p>Background threshold</p></figcaption></figure>

**How to use:**

1. Enter a whole number from **1 to 100** (default **50%**).
2. Click **Save** on the card. Values outside the range show *Enter a whole number between 1 and 100.* and prevent saving.

**Rules:** the value is saved together with the metrics source, so **Save** also revalidates the source.

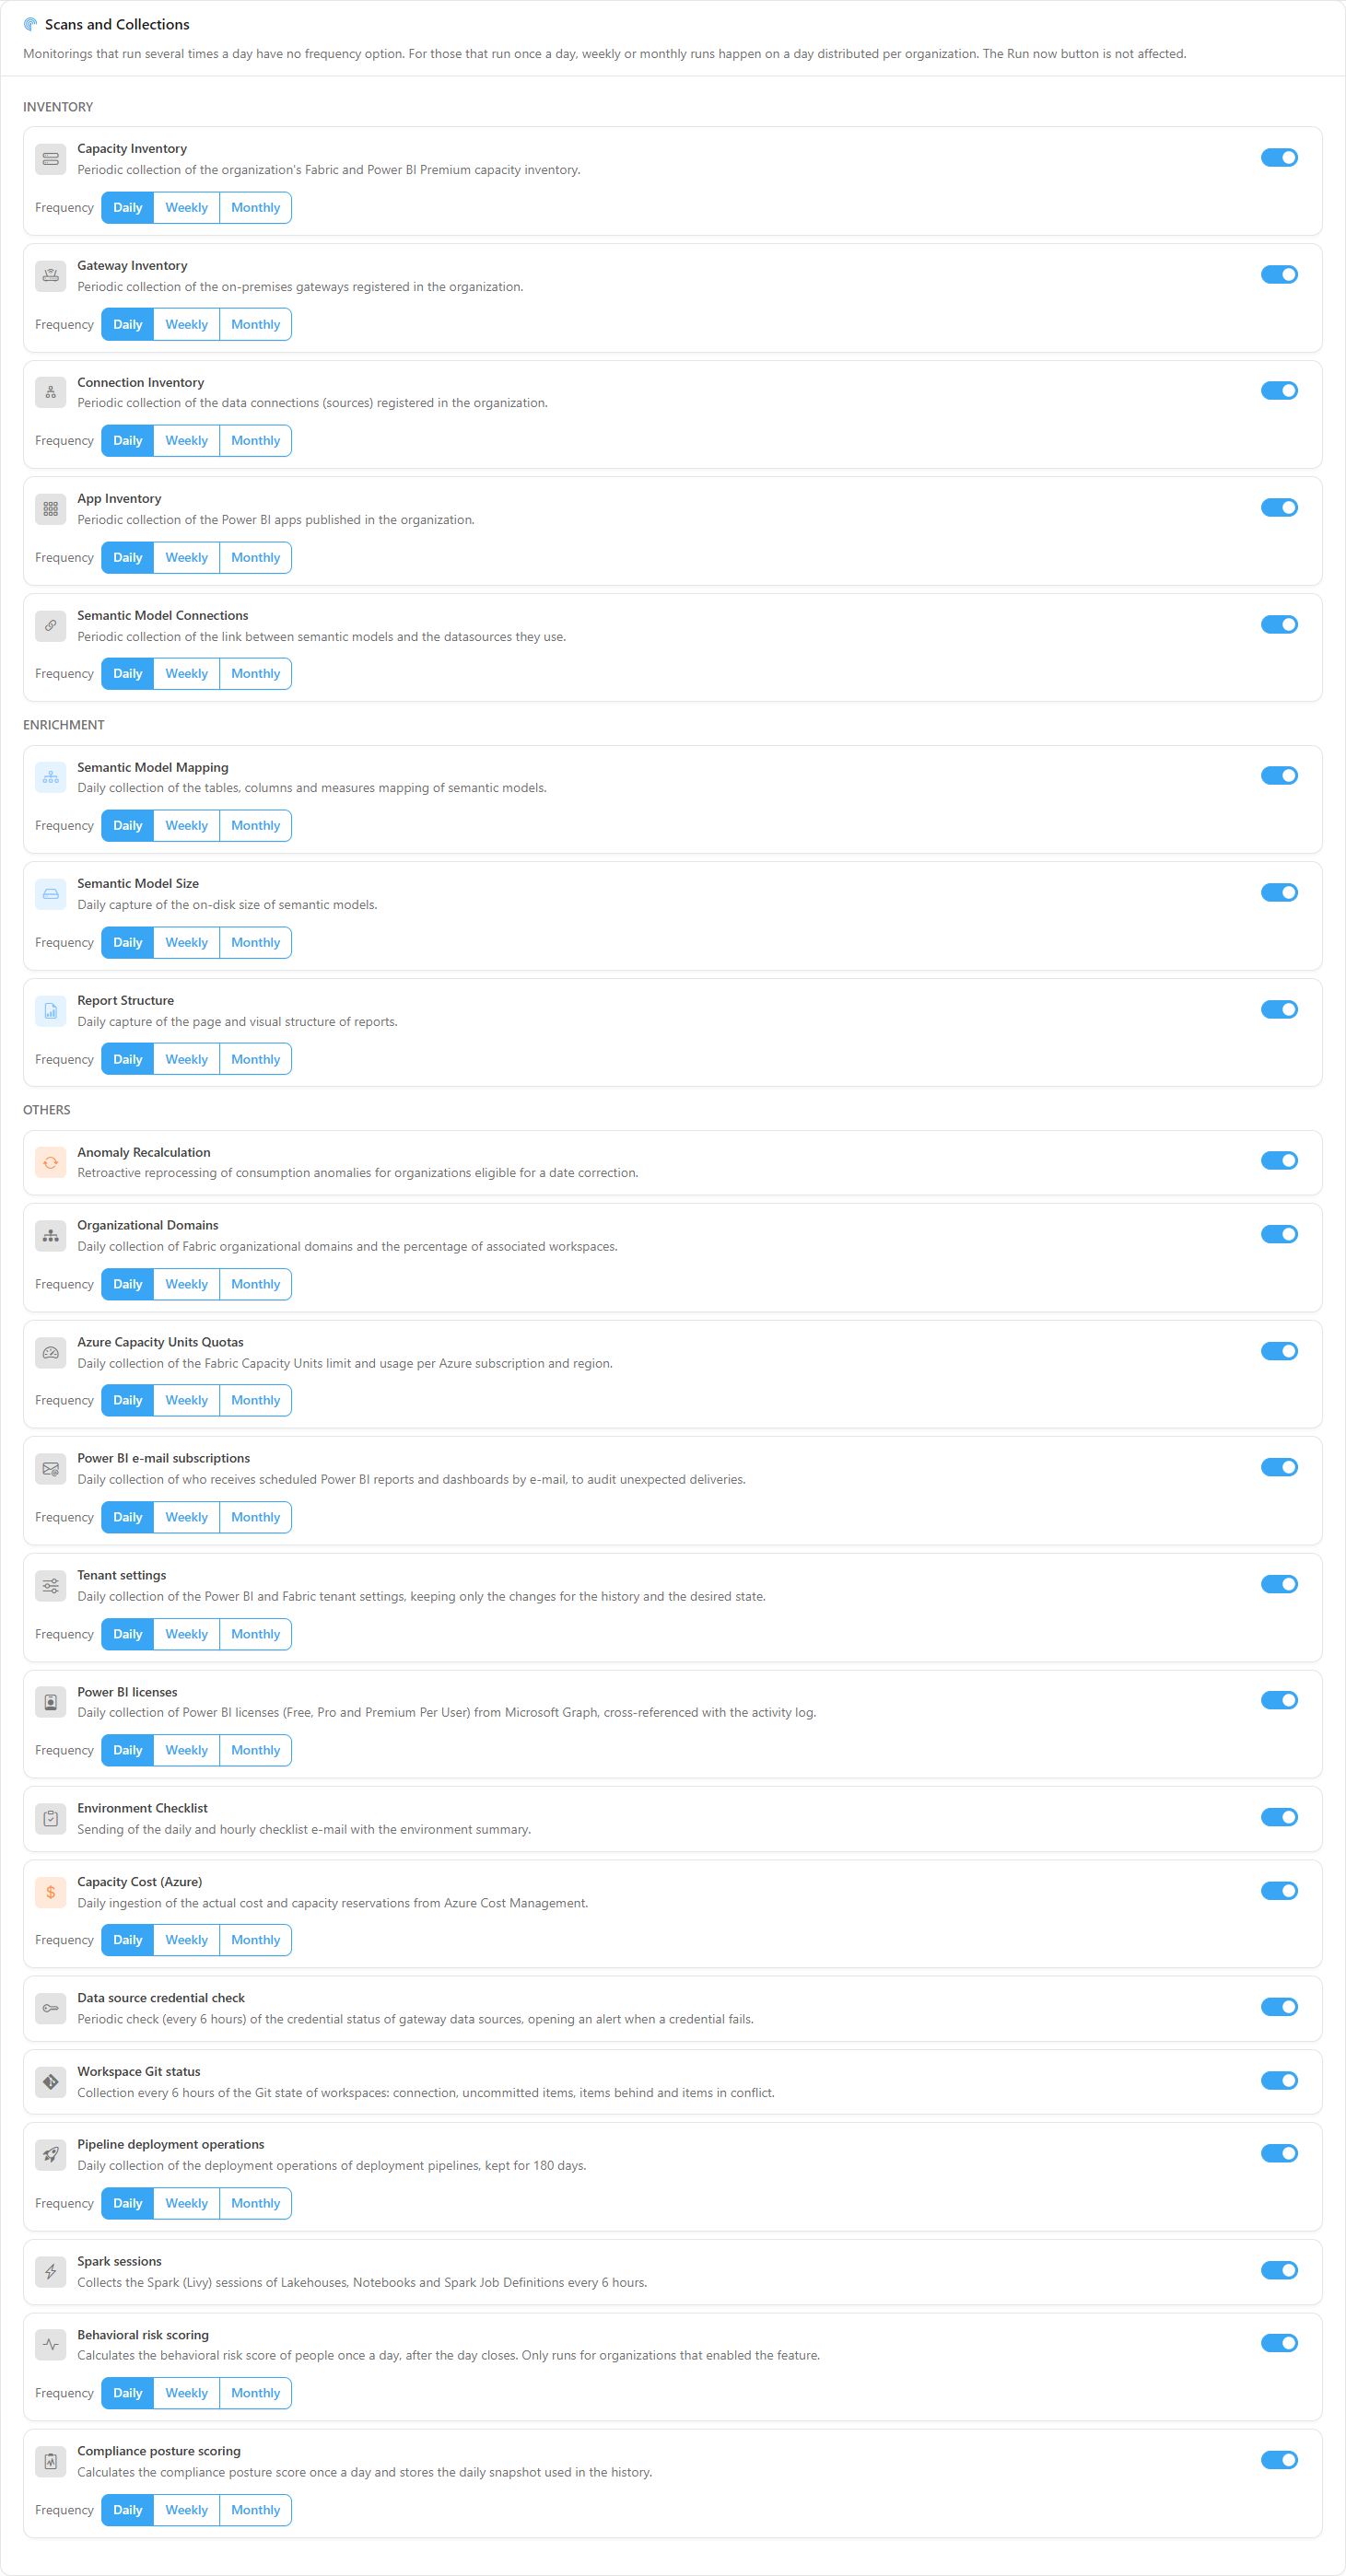
### Scans and Collections

**What it is:** the section with the switches for the 25 periodic collection routines, divided into the **Inventory**, **Enrichment** and **Others** groups. All of them are **on by default**. In 20 of them you also choose the run **Frequency** (see [Run frequency](#run-frequency)).

**What it is for:** turning off collections your organization does not need (for example, Azure cost or quotas), temporarily suspending a problematic collection, or spacing out daily collections to reduce the load.

<figure><picture><source srcset="/files/Z6WT6xm0ko47tlJARcB6" media="(prefers-color-scheme: dark)"><img src="https://3938213054-files.gitbook.io/~/files/v0/b/gitbook-x-prod.appspot.com/o/spaces%2FH2bFRBmIfyK3kwVKbldl%2Fuploads%2Fgit-blob-c815a4b59e0d73223cfa4d0e7d9258795b8bb255%2Fpm-configuracoes-monitoramento-scans-secao-en.png?alt=media" alt="Scans and Collections section with the Inventory, Enrichment and Others groups and the frequency selector"></picture><figcaption><p>Scans and Collections section</p></figcaption></figure>

**How to use:**

1. Find the scan in the **Inventory**, **Enrichment** or **Others** group.
2. Click the scan's switch. The change is saved immediately: *Scan enabled successfully.* or *Scan disabled successfully.* is displayed.
3. Check the summary in the page header, which is updated.

**Rules:** turning a scan off only stops its **automatic** execution; manual runs (**Run now**, on the [Mapping](/en/power-monitor/mapeamento.md) screens) remain available. Turning it off does not delete data already collected.

The **Semantic Model Size** and **Anomaly Recalculation** cards show, in the lower right corner, the note **This scan consumes capacity** or **May consume capacity**, with an **i** that explains the consumption. See [Fabric capacity consumption](#fabric-capacity-consumption).

{% hint style="info" %}
The full inventory scan of workspaces and items (used by almost all Governance screens) does **not** have a switch here: it always runs. See [Inventories](/en/power-monitor/mapeamento/inventarios.md).
{% endhint %}

#### Run frequency

**What it is:** the **Frequency** selector (**Daily**, **Weekly**, **Monthly**) that appears inside the card of each eligible scan. All of them start as **Daily**, which is the usual behavior.

**What it is for:** reducing the collection load of scans whose data changes slowly, without turning them off.

<figure><picture><source srcset="/files/oMgVbIdr0Rc2LT3BkkcL" media="(prefers-color-scheme: dark)"><img src="https://3938213054-files.gitbook.io/~/files/v0/b/gitbook-x-prod.appspot.com/o/spaces%2FH2bFRBmIfyK3kwVKbldl%2Fuploads%2Fgit-blob-64616cfd7eddbe9a0a117aabb445585e4f12869f%2Fpm-configuracoes-monitoramento-scans-frequencia-en.png?alt=media" alt="Scan card with the Frequency selector set to Weekly and the Next expected run and Last run lines"></picture><figcaption><p>Frequency selector with the next expected run</p></figcaption></figure>

**How to use:**

1. In the scan's card, choose **Daily**, **Weekly** or **Monthly**. The choice is saved immediately: *Scan frequency updated successfully.* is displayed.
2. With **Weekly** or **Monthly**, the card shows **Next expected run** (a date) and, if the scan has already run, **Last run** (date and time).

**How it works:**

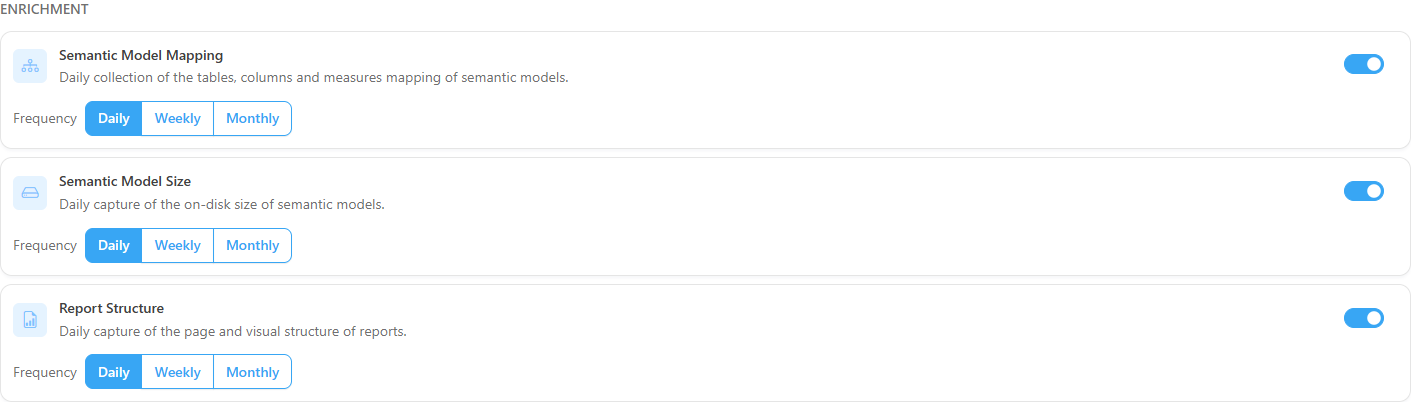
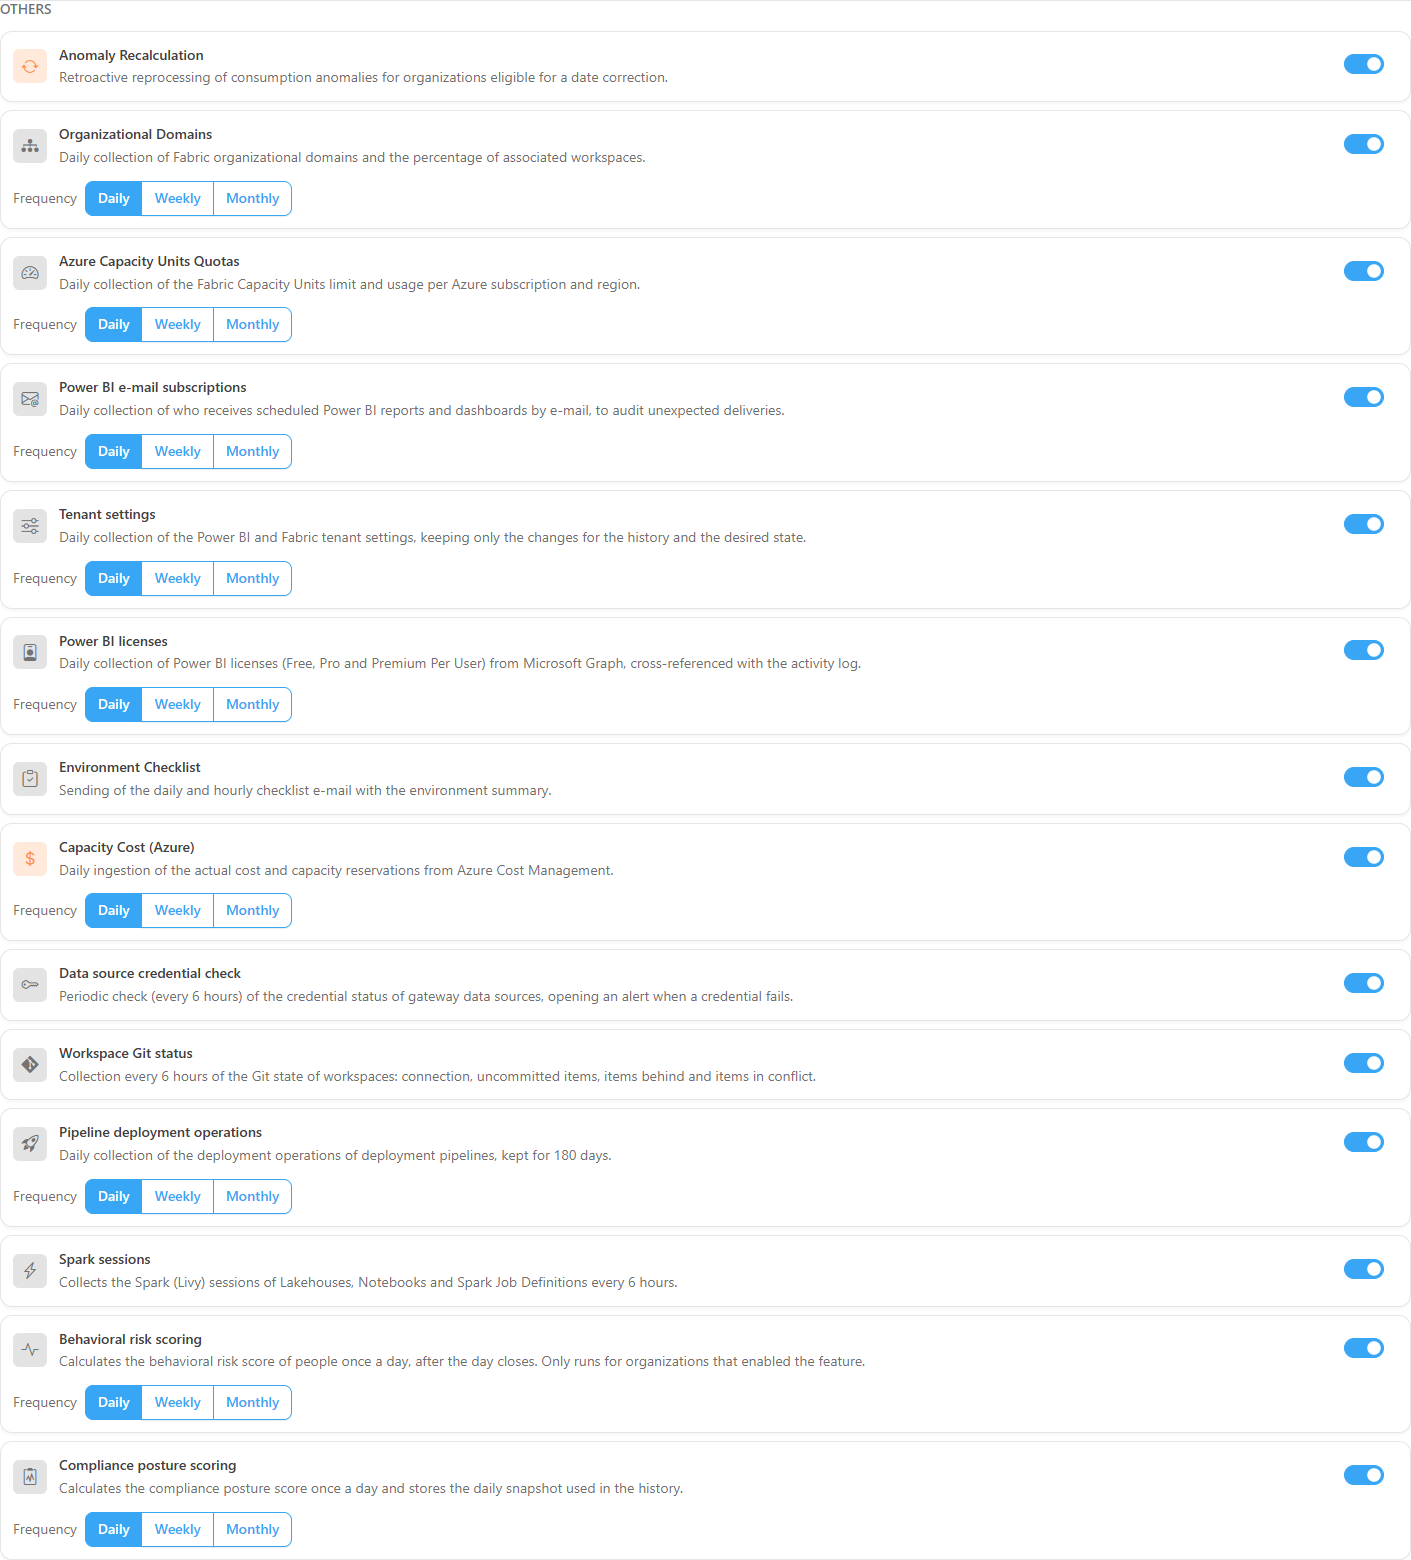
* **Which scans have a frequency:** only scans that run **once a day**, 20 in total: the 8 in the **Inventory** group, the 3 in the **Enrichment** group and, in the **Others** group, **Organizational Domains**, **Azure Capacity Units Quotas**, **Power BI e-mail subscriptions**, **Tenant settings**, **Power BI licenses**, **Capacity Cost (Azure)**, **Pipeline deployment operations**, **Behavioral risk scoring** and **Compliance posture scoring**. Monitorings that run several times a day or on demand (**Anomaly Recalculation**, **Environment Checklist**, **Data source credential check**, **Workspace Git status** and **Spark sessions**) do not have the selector.
* **Run day:** with **Weekly**, the scan runs on one day of the week; with **Monthly**, on one day of the month between 1 and 28 (so every month has that day). The day is **distributed per organization** (each organization has its own, fixed one) so that tenants do not all run on the same day. Days follow the UTC calendar.
* **First run:** if the scan has never run successfully, it runs on the next daily trigger, without waiting for the assigned day.
* **Catch-up:** if the last successful run is older than 7 days (**Weekly**) or 31 days (**Monthly**), the scan runs on the next daily trigger, even outside the assigned day. A missed day never skips the whole week or month.
* **Once a day:** if the scan has already run successfully that day (including manually), the later triggers of the same day are skipped.
* **Run now is not affected:** the **Run now** button on the [Mapping](/en/power-monitor/mapeamento.md) screens runs at any time, with any frequency.
* **Scan turned off:** the selector is disabled and **Next expected run** does not appear. The frequency only applies to a scan that is turned on.
* **Next expected run** is an estimate by calendar date; the scheduler decides the real execution.

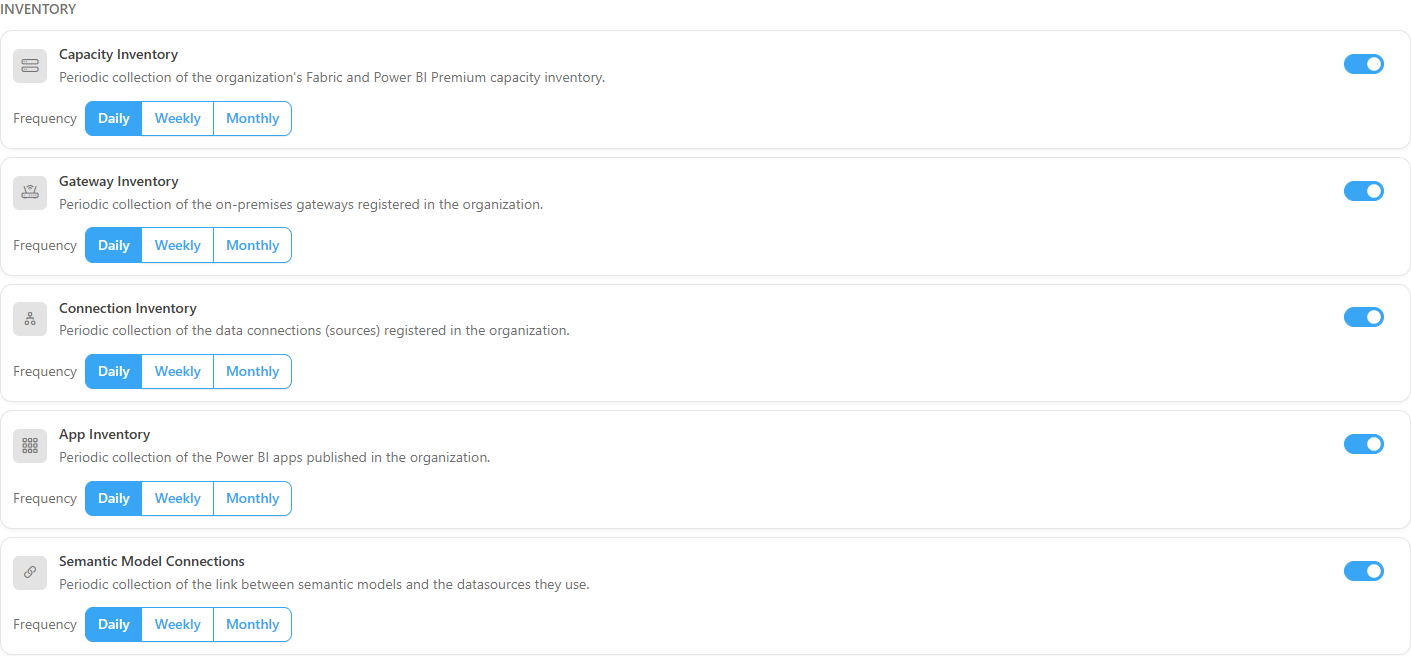
#### Inventory group

<figure><picture><source srcset="/files/EoMD64yM0nvXBp2bSGWt" media="(prefers-color-scheme: dark)"><img src="https://3938213054-files.gitbook.io/~/files/v0/b/gitbook-x-prod.appspot.com/o/spaces%2FH2bFRBmIfyK3kwVKbldl%2Fuploads%2Fgit-blob-5c1ae823a6f3922285a6e308c245830ff5ac46c8%2Fpm-configuracoes-monitoramento-scans-grupo-inventario-en.png?alt=media" alt="Inventory group of the Scans and Collections section"></picture><figcaption><p>Scans in the Inventory group</p></figcaption></figure>

| Scan                                             | What it collects                                                                                                                                                                                                                                                                                                                                                                                                                                                                                                    | Execution                              | Configurable frequency |
| ------------------------------------------------ | ------------------------------------------------------------------------------------------------------------------------------------------------------------------------------------------------------------------------------------------------------------------------------------------------------------------------------------------------------------------------------------------------------------------------------------------------------------------------------------------------------------------- | -------------------------------------- | ---------------------- |
| **Capacity Inventory**                           | Fabric and Power BI Premium capacities of the organization.                                                                                                                                                                                                                                                                                                                                                                                                                                                         | Daily                                  | Yes                    |
| **Gateway Inventory**                            | Registered on-premises gateways.                                                                                                                                                                                                                                                                                                                                                                                                                                                                                    | Daily                                  | Yes                    |
| **Connection Inventory**                         | Registered data connections (sources).                                                                                                                                                                                                                                                                                                                                                                                                                                                                              | Daily                                  | Yes                    |
| **App Inventory**                                | Published Power BI apps.                                                                                                                                                                                                                                                                                                                                                                                                                                                                                            | Daily                                  | Yes                    |
| **Semantic Model Connections**                   | Link between semantic models and their data sources.                                                                                                                                                                                                                                                                                                                                                                                                                                                                | Daily                                  | Yes                    |
| **Group members**                                | Refreshes the list of Microsoft Entra ID group members used by the permission and sharing audits ([Permissions Dashboard](/en/power-monitor/dashboards/dashboard-de-permissoes.md), [Permissions Audit](/en/power-monitor/auditoria/auditoria-de-permissoes.md), and [Direct Sharing](/en/power-monitor/auditoria/compartilhamento-direto.md)). The **Refresh groups** button, in [Mapping › Inventory › Group Members](/en/power-monitor/mapeamento/membros-de-grupos.md), remains available to refresh on demand. | Daily, at 07:35 (Brasília time)        | Yes                    |
| **Notebook, pipeline and dataflow dependencies** | Reads the definitions of Notebooks, Data Pipelines, Copy Jobs, and Dataflows (Gen1 and Gen2) to identify which tables and columns each item reads and writes, feeding [Data Lineage](/en/power-monitor/qualidade-de-dados/linhagem-de-dados.md) and the [Data Dictionary](/en/power-monitor/qualidade-de-dados/dicionario-de-dados.md). It needs per-item write permission in Fabric: without it, the feature stays inert. The code is never shown or sent to AI.                                                   | Daily, at 23:15 (Brasília time)        | Yes                    |
| **Ontology structure**                           | Daily collection of the definition of Fabric ontologies: entities, relationships, data bindings, rules and metrics. Feeds [Governance › Ontologies](/en/power-monitor/governanca/dados-e-engenharia/ontologias.md); the history and **Run now** are in [Mapping › Ontologies](/en/power-monitor/mapeamento/ontologias.md).                                                                                                                                                                                          | Daily, at around 01:31 (Brasília time) | Yes                    |

{% hint style="info" %}
**Group members** runs on its own once a day (at around 07:35, Brasília time) and accepts the **Daily**, **Weekly**, or **Monthly** frequency. After a scheduled run, the state of the last refresh shows **Automatic (scheduled)** in place of the name of whoever refreshed. **Notebook, pipeline and dataflow dependencies** reads the **content** of item definitions and stores a protected copy of them, which is never displayed or sent to AI: read [How dependencies are collected](/en/power-monitor/qualidade-de-dados/linhagem-de-dados.md#how-dependencies-are-collected) before deciding to keep it on. Both are **on by default**. There is no **Run now** button for the dependencies scan: the read is automatic.
{% endhint %}

#### Enrichment group

<figure><picture><source srcset="/files/SxHgio3iklSpBbzLXDDF" media="(prefers-color-scheme: dark)"><img src="https://3938213054-files.gitbook.io/~/files/v0/b/gitbook-x-prod.appspot.com/o/spaces%2FH2bFRBmIfyK3kwVKbldl%2Fuploads%2Fgit-blob-d54ce7bf43d8ace7f7b547a9468e76f51245a837%2Fpm-configuracoes-monitoramento-scans-grupo-enriquecimento-en.png?alt=media" alt="Enrichment group of the Scans and Collections section"></picture><figcaption><p>Scans in the Enrichment group</p></figcaption></figure>

| Scan                       | What it collects                            | Execution | Configurable frequency |
| -------------------------- | ------------------------------------------- | --------- | ---------------------- |
| **Semantic Model Mapping** | Tables, columns and measures of the models. | Daily     | Yes                    |
| **Semantic Model Size**    | On-disk size of the models.                 | Daily     | Yes                    |
| **Report Structure**       | Pages and visuals of the reports.           | Daily     | Yes                    |

#### Others group

<figure><picture><source srcset="/files/dJkDy2si9MddzCNEyT4c" media="(prefers-color-scheme: dark)"><img src="https://3938213054-files.gitbook.io/~/files/v0/b/gitbook-x-prod.appspot.com/o/spaces%2FH2bFRBmIfyK3kwVKbldl%2Fuploads%2Fgit-blob-00599c37fc01cad1bed1c1f4bf94d0db8e2657c2%2Fpm-configuracoes-monitoramento-scans-grupo-outros-en.png?alt=media" alt="Others group of the Scans and Collections section"></picture><figcaption><p>Scans in the Others group</p></figcaption></figure>

| Scan                               | What it collects                                                                                                                                                                                                                                                                                                                                                                                     | Execution                       | Configurable frequency |
| ---------------------------------- | ---------------------------------------------------------------------------------------------------------------------------------------------------------------------------------------------------------------------------------------------------------------------------------------------------------------------------------------------------------------------------------------------------- | ------------------------------- | ---------------------- |
| **Anomaly Recalculation**          | Automatic retroactive reprocessing of consumption anomalies, for organizations that need a date correction.                                                                                                                                                                                                                                                                                          | When needed                     | No                     |
| **Organizational Domains**         | Fabric domains and the percentage of associated workspaces.                                                                                                                                                                                                                                                                                                                                          | Daily                           | Yes                    |
| **Azure Capacity Units Quotas**    | Fabric Capacity Units limit and usage per Azure subscription and region.                                                                                                                                                                                                                                                                                                                             | Daily                           | Yes                    |
| **Power BI e-mail subscriptions**  | Who receives scheduled Power BI reports and dashboards by e-mail, to audit unexpected deliveries.                                                                                                                                                                                                                                                                                                    | Daily                           | Yes                    |
| **Tenant settings**                | Power BI and Fabric tenant settings. Only the changes are kept, for the history and the desired state.                                                                                                                                                                                                                                                                                               | Daily                           | Yes                    |
| **Power BI licenses**              | Power BI licenses (Free, Pro and Premium Per User) read from Microsoft Graph and cross-referenced with the activity log, for the [Power BI Licenses](/en/power-monitor/governanca/tenant/licencas-power-bi.md) screen. Needs the **Power BI licenses** permission (or `Directory.Read.All`) in [Additional Permissions](/en/power-monitor/configuracoes/permissoes-adicionais.md#power-bi-licenses). | Daily, at 09:45 (Brasília time) | Yes                    |
| **Environment Checklist**          | Sending of the **Daily Checklist** and **Hourly Checklist** e-mails.                                                                                                                                                                                                                                                                                                                                 | Daily and hourly                | No                     |
| **Capacity Cost (Azure)**          | Actual cost and capacity reservations, from Azure Cost Management. Only runs if cost access has been granted (see [Additional Permissions](/en/power-monitor/configuracoes/permissoes-adicionais.md)).                                                                                                                                                                                               | Daily                           | Yes                    |
| **Data source credential check**   | Status of the credentials of gateway data sources, opening an alert when a credential fails.                                                                                                                                                                                                                                                                                                         | Every 6 hours                   | No                     |
| **Workspace Git status**           | Git state of workspaces: connection, uncommitted items, items behind and items in conflict.                                                                                                                                                                                                                                                                                                          | Every 6 hours                   | No                     |
| **Pipeline deployment operations** | Deployment operations of deployment pipelines, kept for 180 days.                                                                                                                                                                                                                                                                                                                                    | Daily                           | Yes                    |
| **Spark sessions**                 | Spark (Livy) sessions of Lakehouses, Notebooks and Spark Job Definitions.                                                                                                                                                                                                                                                                                                                            | Every 6 hours                   | No                     |
| **Behavioral risk scoring**        | Calculates, once a day and after the day closes, the behavioral risk score of people. Only runs for organizations that enabled the feature (see [Audit, security and compliance](#audit-security-and-compliance)).                                                                                                                                                                                   | Daily                           | Yes                    |
| **Compliance posture scoring**     | Calculates the compliance posture score and stores the daily snapshot used in the history.                                                                                                                                                                                                                                                                                                           | Daily                           | Yes                    |

### Resource Monitoring

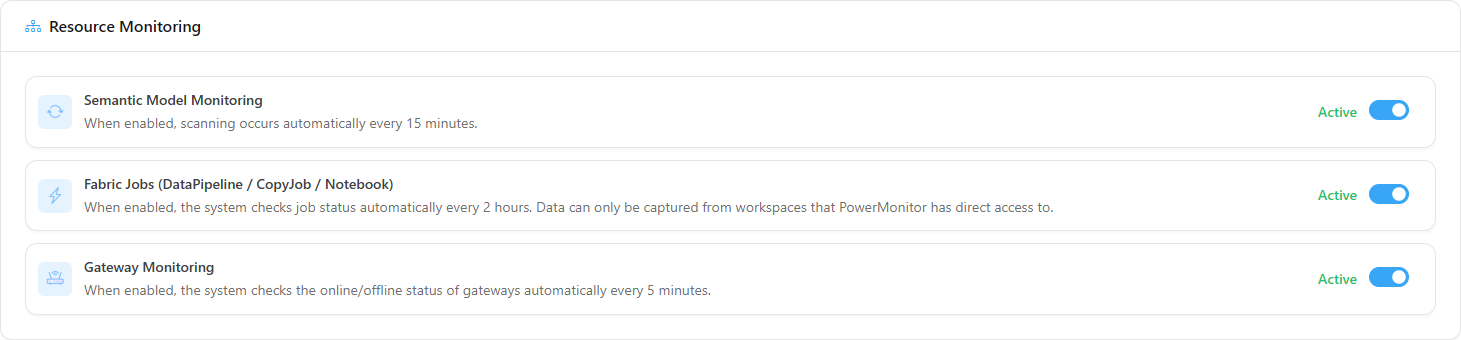
**What it is:** the section with three cards, each with the **Automatic monitoring** switch (**Active/Inactive**) for one resource type. In recently created organizations, all three are already turned on.

**What it is for:** turning on the periodic check that the gateway offline, refresh failure and Fabric item failure alerts depend on.

<figure><picture><source srcset="/files/u1qTEObuAmN7VIP32knP" media="(prefers-color-scheme: dark)"><img src="https://3938213054-files.gitbook.io/~/files/v0/b/gitbook-x-prod.appspot.com/o/spaces%2FH2bFRBmIfyK3kwVKbldl%2Fuploads%2Fgit-blob-160a23bc702427785073007b7a9f0a534f9311d1%2Fpm-configuracoes-monitoramento-recursos-en.png?alt=media" alt="Resource Monitoring section with the Gateway, Semantic Model and Fabric Jobs cards"></picture><figcaption><p>Resource Monitoring</p></figcaption></figure>

**How to use:**

1. Find the resource's card.
2. Turn the switch on or off. The change takes effect immediately (*Monitoring enabled successfully.* or *Monitoring disabled successfully.*).
3. If the card indicates that no resource was found, run the corresponding scan (see each card below).

#### Semantic Model Monitoring

<figure><picture><source srcset="/files/a88EIuSthKbjnOsm03Fr" media="(prefers-color-scheme: dark)"><img src="https://3938213054-files.gitbook.io/~/files/v0/b/gitbook-x-prod.appspot.com/o/spaces%2FH2bFRBmIfyK3kwVKbldl%2Fuploads%2Fgit-blob-d78b57270f5f962a6dafd41ff3071cee9fc2c99a%2Fpm-configuracoes-monitoramento-recurso-semantic-model-en.png?alt=media" alt="Semantic Model Monitoring card"></picture><figcaption><p>Semantic Model Monitoring card</p></figcaption></figure>

* **When active:** collects the refresh executions of semantic models **every 15 minutes**.
* **Alert that depends on it:** **Dataset Refresh Failed** (and the corresponding notice to the creator).
* **No models:** the card shows **No Semantic Model found** and the **Perform initial scan** button, which triggers model discovery (**Scanning in progress...** is displayed until it finishes).

#### Fabric Jobs (DataPipeline / CopyJob / Notebook)

<figure><picture><source srcset="/files/nOHMuRc84rv1eEZRFCXE" media="(prefers-color-scheme: dark)"><img src="https://3938213054-files.gitbook.io/~/files/v0/b/gitbook-x-prod.appspot.com/o/spaces%2FH2bFRBmIfyK3kwVKbldl%2Fuploads%2Fgit-blob-d98008cff864626167637b59ac3ca2e4036d20a6%2Fpm-configuracoes-monitoramento-recurso-fabric-jobs-en.png?alt=media" alt="Fabric Jobs (DataPipeline / CopyJob / Notebook) card"></picture><figcaption><p>Fabric Jobs card</p></figcaption></figure>

* **When active:** checks the status of Fabric job executions **every 2 hours**.
* **Alert that depends on it:** **Fabric Item Failed** (and the corresponding notice to the creator).
* **Restriction:** data can only be captured from workspaces Power Monitor has direct access to.
* **No items:** the card shows **No Fabric Items found**; run a full scan in [Inventories](/en/power-monitor/mapeamento/inventarios.md).

#### Gateway Monitoring

<figure><picture><source srcset="/files/So8tydSgac2dCZnrfLcJ" media="(prefers-color-scheme: dark)"><img src="https://3938213054-files.gitbook.io/~/files/v0/b/gitbook-x-prod.appspot.com/o/spaces%2FH2bFRBmIfyK3kwVKbldl%2Fuploads%2Fgit-blob-e441b969c5899c7bc5291dfcbf6ba9df23262045%2Fpm-configuracoes-monitoramento-recurso-gateway-en.png?alt=media" alt="Gateway Monitoring card"></picture><figcaption><p>Gateway Monitoring card</p></figcaption></figure>

* **When active:** checks the online/offline status of gateways **every 5 minutes**.
* **Alert that depends on it:** **Gateway Offline**.
* **No gateways:** the card shows **No Gateway found**; run the gateway scan in [Mapping › Gateways](/en/power-monitor/mapeamento/gateways.md).

### Audit, security and compliance

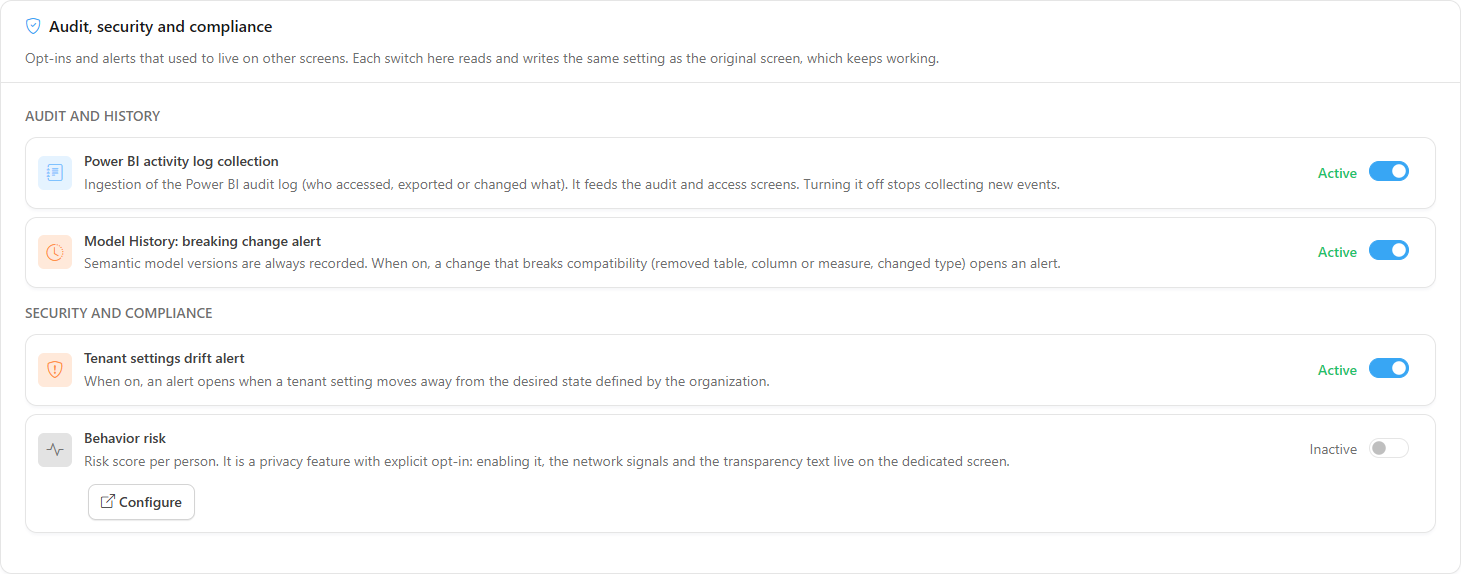
**What it is:** the section that brings together opt-ins and alerts that used to live on other screens, in two groups: **Audit and history** and **Security and compliance**. Each switch reads and writes the same setting as the original screen, which keeps working.

**What it is for:** having, in one place, the control of the activity log collection, of the drift alerts and of the behavior risk scoring.

<figure><picture><source srcset="/files/bUtYL3F7lsbsMugpwuNn" media="(prefers-color-scheme: dark)"><img src="https://3938213054-files.gitbook.io/~/files/v0/b/gitbook-x-prod.appspot.com/o/spaces%2FH2bFRBmIfyK3kwVKbldl%2Fuploads%2Fgit-blob-fd462000927d700c4c6364a56c121bf5b88c309d%2Fpm-configuracoes-monitoramento-auditoria-seguranca-en.png?alt=media" alt="Audit, security and compliance section with the switches and the Behavior risk card"></picture><figcaption><p>Audit, security and compliance</p></figcaption></figure>

| Group                   | Item                                     | What it does                                                                                                                                                                                                            |
| ----------------------- | ---------------------------------------- | ----------------------------------------------------------------------------------------------------------------------------------------------------------------------------------------------------------------------- |
| Audit and history       | **Power BI activity log collection**     | Ingestion of the Power BI audit log (who accessed, exported or changed what). It feeds the audit and access screens. Turning it off stops collecting new events.                                                        |
| Audit and history       | **Model History: breaking change alert** | Semantic model versions are always recorded. When on, a change that breaks compatibility (removed table, column or measure, changed type) opens an alert.                                                               |
| Security and compliance | **Tenant settings drift alert**          | When on, an alert opens when a tenant setting moves away from the desired state defined by the organization.                                                                                                            |
| Security and compliance | **Behavior risk**                        | Card with the **Active/Inactive** switch for the per-person risk scoring. With scoring active, it also shows **Network signals on** or **Network signals off**. The **Configure** button leads to the dedicated screen. |

**How to use:**

1. Turn the switch (**Active/Inactive**) on or off. The change takes effect immediately.
2. In **Behavior risk**, the switch does not save directly: it opens the same confirmation as the dedicated screen (**Enable behavioral risk?** or **Disable behavioral risk?**). Click **Enable** or **Disable** to save, or **Cancel** to keep it as it is. For the network signals and the full explanation, click **Configure**.

**Rules:**

* **Behavior risk** is a privacy feature with explicit opt-in. That is why the switch always asks for confirmation, and the network signals and the transparency text live only on the dedicated screen. Turning it on or off here does not change the network signals. See [Behavioral risk](/en/power-monitor/auditoria/risco-comportamental.md).
* **New installation defaults:** organizations created from October 7, 2026 onwards already start with the consumption anomaly alert, the average execution duration deviation alert, the tenant settings drift alert, the Model History breaking change alert and the behavior risk scoring **turned on**, with the network signals off. Existing organizations do not change: they keep what was already configured.
* The breaking change alert and the tenant settings drift alert can also be turned on in the [Model History](/en/power-monitor/governanca/operacao/historico-de-modelos.md) and [Tenant Settings](/en/power-monitor/governanca/tenant/configuracoes-do-tenant.md) (**Desired state** tab) screens.
* If an item cannot be loaded, it disappears from the section and the notice *Some options in this section could not be loaded.* is displayed.

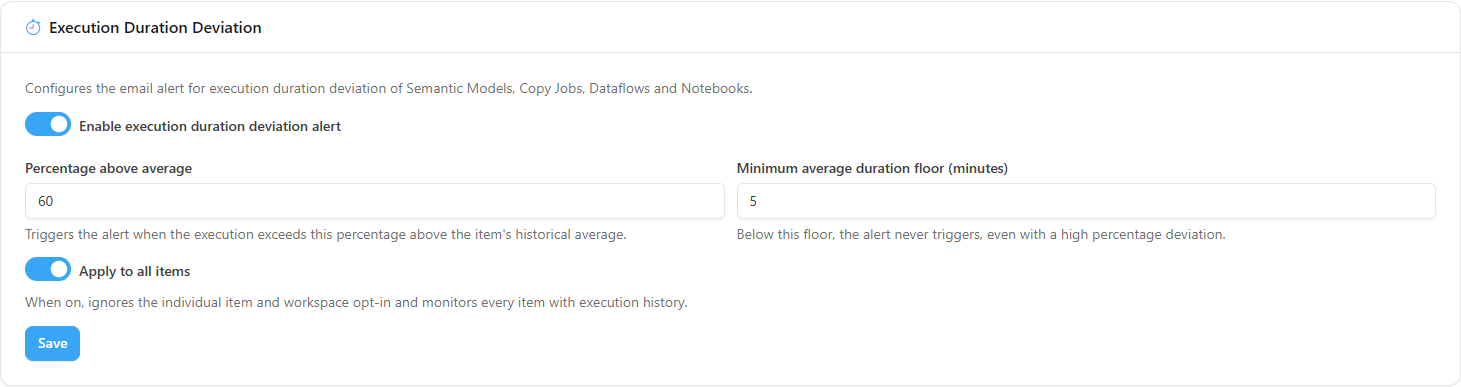
### Execution Duration Deviation

**What it is:** the form that configures the **Execution Duration Deviation** e-mail alert for Semantic Models, Copy Jobs, Dataflows and Notebooks.

**What it is for:** being warned when an execution takes much longer than normal, which often precedes timeout failures or cascading delays.

<figure><picture><source srcset="/files/p9NSULKhNGD53wEkGGtE" media="(prefers-color-scheme: dark)"><img src="https://3938213054-files.gitbook.io/~/files/v0/b/gitbook-x-prod.appspot.com/o/spaces%2FH2bFRBmIfyK3kwVKbldl%2Fuploads%2Fgit-blob-b951431e603208ec35b9bea15a2df931131f58f0%2Fpm-configuracoes-monitoramento-desvio-tempo-en.png?alt=media" alt="Execution Duration Deviation section with percentage and minimum floor"></picture><figcaption><p>Execution Duration Deviation</p></figcaption></figure>

| Field                                         | Description                                                                                                                                                                                                                                                                                            | Default                       |
| --------------------------------------------- | ------------------------------------------------------------------------------------------------------------------------------------------------------------------------------------------------------------------------------------------------------------------------------------------------------ | ----------------------------- |
| **Enable execution duration deviation alert** | Turns the alert on/off. When off, the other fields are locked.                                                                                                                                                                                                                                         | Off (on in new installations) |
| **Percentage above average**                  | Fires when the execution exceeds this percentage above the item's reference average: the average of the executions in the 7 days before the observed execution or, if there are none in those 7 days, in the last 30 days. Items without history in those windows do not trigger an alert (1 to 1000). | 60%                           |
| **Minimum average duration floor (minutes)**  | Below this average duration floor, the alert never fires, even with a high percentage deviation (prevents alerts on very fast items). From 0 to 1440.                                                                                                                                                  | 10 minutes                    |
| **Apply to all items**                        | When on, ignores the individual selection of items and workspaces and monitors every item with execution history.                                                                                                                                                                                      | Off                           |

**How to use:**

{% stepper %}
{% step %}

### Enable the alert

Turn on **Enable execution duration deviation alert**.
{% endstep %}

{% step %}

### Define the limits

Enter the **Percentage above average** (default 60%) and the **Minimum average duration floor (minutes)** (default 10).
{% endstep %}

{% step %}

### Choose the scope

Turn on **Apply to all items** to monitor every item with execution history. Leave it off to choose items and workspaces individually in [Average Execution Time](/en/power-monitor/performance/tempo-medio-de-execucao.md).
{% endstep %}

{% step %}

### Save

Click **Save**. *Settings saved successfully.* is displayed. Check in [Notifications](/en/power-monitor/configuracoes/notificacoes.md) who receives the **Execution Duration Deviation** e-mail.
{% endstep %}
{% endstepper %}

**Rules:** unlike the other sections, this one is only saved when you click **Save**.

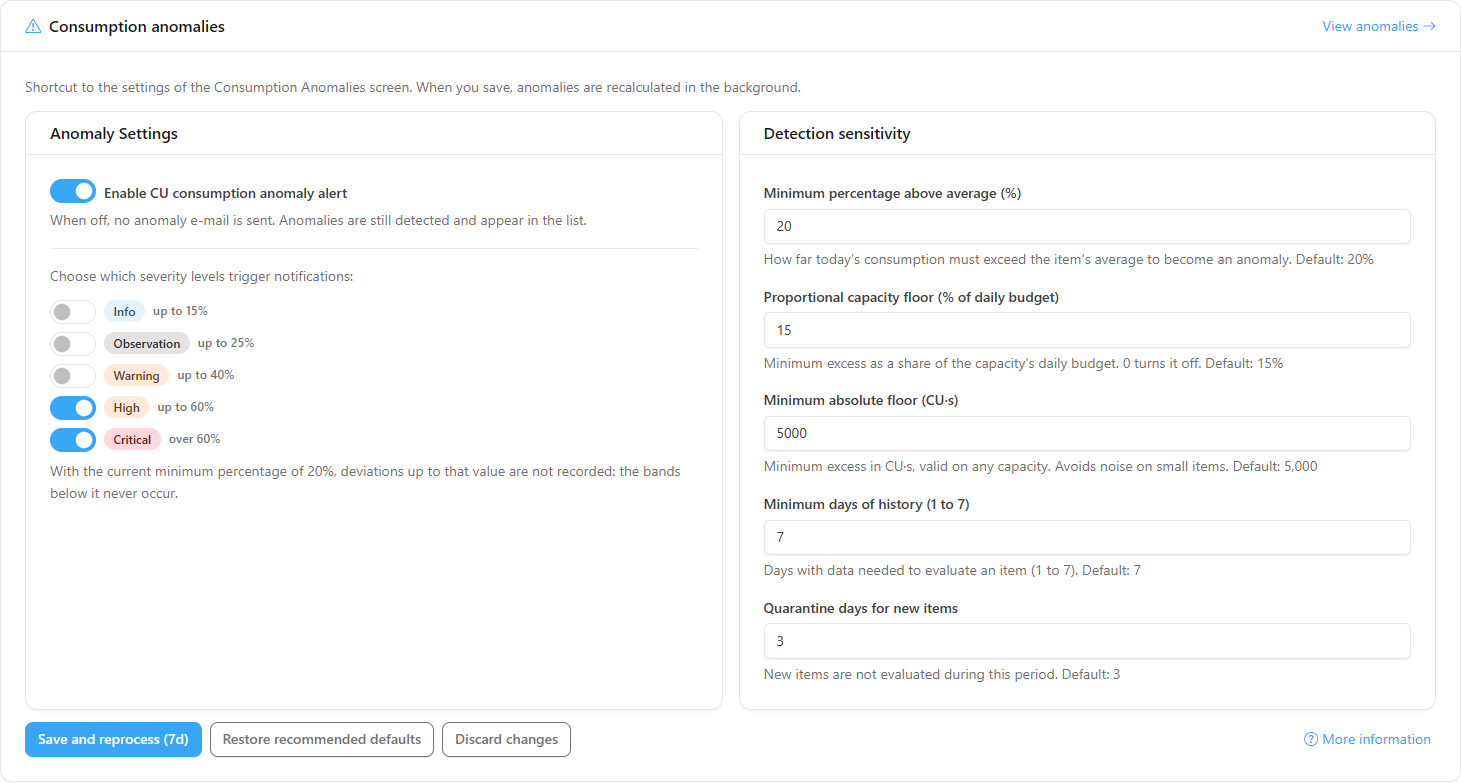
### Consumption anomalies

**What it is:** the **Consumption anomalies** card, a shortcut with the same form as the **Settings** tab of the [Consumption Anomalies](/en/power-monitor/monitoramento/anomalias-de-consumo.md) screen: the **Enable CU consumption anomaly alert** switch, the severities that send e-mail and the **Detection sensitivity** parameters. The **View anomalies** link, in the header, opens the anomalies screen.

**What it is for:** adjusting the CU consumption anomaly alert together with the other monitoring settings, without switching screens.

<figure><picture><source srcset="/files/0H6OTd0RaQQA74nhnMGQ" media="(prefers-color-scheme: dark)"><img src="https://3938213054-files.gitbook.io/~/files/v0/b/gitbook-x-prod.appspot.com/o/spaces%2FH2bFRBmIfyK3kwVKbldl%2Fuploads%2Fgit-blob-d3664f079840501486ab381a8c97784f2961006e%2Fpm-configuracoes-monitoramento-anomalias-en.png?alt=media" alt="Consumption anomalies card with the alert form and the View anomalies link"></picture><figcaption><p>Consumption anomalies card</p></figcaption></figure>

**How to use:** change the fields and click **Save and reprocess (7d)**. Use **Restore recommended defaults**, **Discard changes** and **More information** as on the anomalies screen. The fields, the defaults and the detection rule are in [Consumption Anomalies](/en/power-monitor/monitoramento/anomalias-de-consumo.md#settings-tab-detection-sensitivity).

**Rules:**

* The card reads and writes the same setting as the anomalies screen: what is saved here shows up there, and vice versa. When you save, anomalies are recalculated in the background.
* Only **Administrators** save. If the anomalies screen cannot be loaded for your profile, the error is limited to this card.

## Rules and behavior

* All changes on this tab apply to the entire organization and are exclusive to Administrators.
* Turning off a collection does not delete data already collected; the screens show the latest available information.
* With the **Weekly** or **Monthly** frequency, the screens show the latest collected information until the next run; use **Run now** (in [Mapping](/en/power-monitor/mapeamento.md)) to refresh earlier.
* E-mail alerts depend on the corresponding collection being turned on **and** on the recipient being enabled in [Notifications](/en/power-monitor/configuracoes/notificacoes.md).

### Fabric capacity consumption

Most Power Monitor collections use administrative APIs, which consume no capacity. Some, however, run queries on semantic models, and every query on a model (through DAX or an XMLA read) is an **interactive** operation that uses CU from the capacity that hosts that model. To make this visible, these collections show a discreet note:

* **This scan consumes capacity**, when every cycle consumes;
* **May consume capacity**, when the consumption depends on a situation (for example, on where the Capacity Metrics App is installed);
* **This feature consumes capacity**, in the window for creating or editing a [Data Freshness](/en/power-monitor/monitoramento/atualizacao-de-dados.md) monitor.

When you hover over the **i** next to the note (or focus it with the keyboard), a tooltip explains the **Consumption** (level), **Type**, **Scope**, **Frequency**, **What it does**, **Where it consumes** and **Why it consumes**. The collections that query the Capacity Metrics App also show a **Tip** about the Pro workspace.

| Feature                                                             | What it does                                                                                                                                                                     | Consumption                                                       | Where it consumes                                                                                                                                                          |
| ------------------------------------------------------------------- | -------------------------------------------------------------------------------------------------------------------------------------------------------------------------------- | ----------------------------------------------------------------- | -------------------------------------------------------------------------------------------------------------------------------------------------------------------------- |
| **Capacity consumption and item operations** (Capacity Metrics App) | DAX queries on the Capacity Metrics App model, **every 5 minutes**: one per monitored capacity (consumption) and one per tenant capacity (item operations).                      | **High**, the largest on the platform                             | On the capacity that hosts the **app workspace**, which is not necessarily the monitored capacity. In a Pro or Premium Per User workspace, it consumes no capacity.        |
| **Semantic Model Size**                                             | XMLA read of each model's storage metadata (without querying the data), **once a day** by default (configurable frequency).                                                      | **Low to medium**, depending on the number and size of the models | On the capacity of each model read. Only models on dedicated capacity (Premium, Fabric or PPU) are read.                                                                   |
| **Data Freshness**                                                  | One simple DAX query per monitor on the monitored model (the most recent value of the date column and, if configured, the row count), at each monitor's frequency.               | **Low**, per check                                                | Only when the model is on a Fabric or Premium capacity. In a Pro or Premium Per User workspace, it consumes no CU. In DirectQuery, the query also reaches the data source. |
| **Anomaly Recalculation**                                           | Only when **reprocessing the history**: DAX queries on the Capacity Metrics App, one per capacity for each reprocessed day. The recurring recalculation does not query Power BI. | **Medium**, occasional                                            | On the capacity that hosts the app workspace, as in the first row.                                                                                                         |

**Where the note appears:**

* on this tab, in the **Semantic Model Size** and **Anomaly Recalculation** cards and in the footer of the **Capacities** table;
* in the footer of the [Capacity Metrics](/en/power-monitor/mapeamento/metricas-de-capacidade.md), [Model Size](/en/power-monitor/mapeamento/tamanho-de-modelos.md) and [Data Freshness](/en/power-monitor/monitoramento/atualizacao-de-dados.md) screens;
* in the window for creating or editing a Data Freshness monitor.

**Notes that depend on the Capacity Metrics App:** for the collections that query the app (capacity consumption, item operations and anomaly recalculation), the note follows where the app workspace is:

| App workspace                                                                             | Note                                                                                |
| ----------------------------------------------------------------------------------------- | ----------------------------------------------------------------------------------- |
| On a capacity                                                                             | Shown, and **Where it consumes** names that capacity.                               |
| Pro or Premium Per User                                                                   | Not shown: the queries consume no capacity.                                         |
| Unknown (for example, metrics source not configured yet or workspace not inventoried yet) | **May consume capacity**, explaining that it depends on where the app is installed. |

**On-demand actions that also use capacity:** they are not automatic collections and do not show the note, but they also run operations on models or Fabric items: the [Performance Assessment](/en/power-monitor/performance/avaliacao-de-performance.md) of a semantic model, the retry of a model refresh (which is a real refresh), the metrics source validation (**Test connection** and **Save**), the Lakehouse and Warehouse performance analysis and report export.

### Capacity Metrics app workspace notice

**What it is:** a yellow notice at the top of the screens, shown when the Capacity Metrics App workspace is on a capacity. The text says which capacity (name and SKU), that every 5 minutes the Power Monitor consumption scans query the app and consume CU from that capacity, and that Microsoft recommends installing the app in a Pro workspace, where these queries consume no capacity.

**Who sees it:** whoever can open this tab (Administrators and, if the organization allowed it, users with access to it).

**How to use:**

1. Click **View metrics source** to open this tab and review the [Capacity Metrics Source](#capacity-metrics-source).
2. To stop seeing the notice, install the Capacity Metrics App in a Pro workspace, give the Service Principal access to it and point the metrics source to that workspace.
3. To get it out of the way without changing anything, click the **X**. Closing it applies only to the current screen: the notice comes back on the next screen while the app remains on a capacity.

## Step by step

### How to configure the capacity metrics source

Use this on first-time configuration or when the badge shows **Not configured** or **Validation failed**. Prerequisite: **Microsoft Fabric Capacity Metrics** installed in a workspace that the Power Monitor Service Principal has access to.

{% stepper %}
{% step %}

### Install the Capacity Metrics App

In Power BI/Fabric, install the **Microsoft Fabric Capacity Metrics** app in a workspace and give the Power Monitor Service Principal access to that workspace. Prefer a **Pro workspace**, as Microsoft recommends: there, Power Monitor's queries on the app consume no capacity. If the list of workspaces is empty (**No workspaces available**), use **Grant workspace access**, which leads to *Governance › Workspaces*.
{% endstep %}

{% step %}

### Select workspace and model

In **Capacity Metrics Source**, choose the **Workspace** (use **Filter by name...** and **Refresh list** if it does not appear). If the workspace has more than one semantic model, also choose the app's **Semantic model**.
{% endstep %}

{% step %}

### Test the connection

Click **Test connection**. If it succeeds, *Valid configuration.* is displayed. If validation fails, the message indicates the cause (see the messages table in [Capacity Metrics Source](#capacity-metrics-source)). If the cause is the DatasetExecuteQueries API being disabled, click **Enable and test again** with a Fabric Administrator account, or **Open Fabric settings** to adjust it manually.
{% endstep %}

{% step %}

### Adjust the threshold and save

If you want, change the **Background threshold for the hourly checklist (%)** (whole number from 1 to 100). Click **Save**: Power Monitor validates and saves, showing *Metrics source configured and validated successfully.* The badge changes to **Configured and validated**.
{% endstep %}

{% step %}

### Turn on the capacities

In the **Capacities** section, enable **Monitoring** for the capacities you want.
{% endstep %}
{% endstepper %}

## Frequently asked questions

<details>

<summary>A capacity's data stopped updating. What should I check?</summary>

Check whether the capacity's **Monitoring** is **Active**, whether the **Automatic cycle stopped** panel is not displayed (use **Reactivate monitoring**) and whether the **Metrics Source** is still **Configured and validated**. Paused capacities do not generate consumption data.

</details>

<details>

<summary>Does turning off a scan reduce my Power Monitor cost?</summary>

No. Billing is based on the average number of monitored items (see [Billing](/en/power-monitor/faturamento.md)). The switches are used to control the collection load and what is displayed.

</details>

<details>

<summary>Why didn't a Fabric Job failure alert arrive?</summary>

Fabric Jobs monitoring checks executions every 2 hours and only sees workspaces Power Monitor has direct access to. Check the **Fabric Jobs** card and the Service Principal's access to the workspaces.

</details>

<details>

<summary>I changed a scan to Weekly and it did not run today. Is something wrong?</summary>

No. With **Weekly** or **Monthly**, the scan runs on the day assigned to your organization, which is fixed and distributed among organizations (see **Next expected run** on the scan's card). If it has never run, or went more than 7 days (weekly) or 31 days (monthly) without a success, it runs on the next daily trigger. To collect right away, use **Run now** on the Mapping screen.

</details>

<details>

<summary>Does the Capacity Metrics App need to be in a workspace on a capacity?</summary>

No. Microsoft recommends installing it in a Pro workspace to avoid throttling, and Power Monitor works normally with it there. In a Pro workspace, the consumption queries Power Monitor runs every 5 minutes consume no CU from any capacity. With the app on a capacity, these queries consume its CU (the largest consumption on the platform) and administrators see the [Capacity Metrics app workspace notice](#capacity-metrics-app-workspace-notice).

</details>

<details>

<summary>Which Power Monitor collections consume Fabric capacity?</summary>

The ones that query semantic models: capacity consumption and item operations (on the Capacity Metrics App), Semantic Model Size, Data Freshness and, only when reprocessing the history, Anomaly Recalculation. Each one shows the note **This scan consumes capacity** or **May consume capacity**. See the table in [Fabric capacity consumption](#fabric-capacity-consumption).

</details>

<details>

<summary>The Semantic model field does not appear. Is something wrong?</summary>

No. The field only appears when the chosen workspace has more than one semantic model. With a single model, it is selected automatically.

</details>

<details>

<summary>Group members look outdated on the permission screens.</summary>

The **Group members** scan refreshes the list once a day, at around 07:35 (Brasília time), when it is on at the **Daily** frequency. With **Weekly** or **Monthly**, the screens show the result of the last refresh until the next run day. To refresh on demand, use **Refresh groups** in [Group Members](/en/power-monitor/mapeamento/membros-de-grupos.md).

</details>

<details>

<summary>Does the "Notebook, pipeline and dataflow dependencies" scan need any special permission?</summary>

Yes. The Service Principal must have write permission (**Contributor** role or higher) on the workspaces of the items, because Fabric only delivers an item's definition to whoever can write to it. Without the permission, the scan stays inert for that item. See [Data Lineage](/en/power-monitor/qualidade-de-dados/linhagem-de-dados.md#how-dependencies-are-collected).

</details>

## Related pages

* [Monitoring › Capacities](/en/power-monitor/monitoramento/capacidades.md)
* [Monitoring › Gateways](/en/power-monitor/monitoramento/gateways.md)
* [Monitoring › Semantic Models](/en/power-monitor/monitoramento/modelos-semanticos.md)
* [Monitoring › Microsoft Fabric Items](/en/power-monitor/monitoramento/itens-do-microsoft-fabric.md)
* [Performance › Average Execution Time](/en/power-monitor/performance/tempo-medio-de-execucao.md)
* [Notifications](/en/power-monitor/configuracoes/notificacoes.md)
* [Mapping](/en/power-monitor/mapeamento.md)


---

# Agent Instructions
This documentation is published with GitBook. GitBook is the documentation platform designed so that both humans and AI agents can read, navigate, and reason over technical content effectively. Learn more at gitbook.com.

## Querying This Documentation
If you need additional information that is not directly available in this page, you can query the documentation by asking a question.

Perform an HTTP GET request on the following URL with the `ask` and `goal` query parameters:

```
GET https://docs.powermonitor.com.br/en/power-monitor/configuracoes/monitoramento.md?ask=<question>&goal=<user_goal>
```

`ask` is the immediate question: it should be specific, self-contained, and written in natural language.
`goal` is what the user is ultimately trying to achieve, the reason they need the answer. Sharing it helps GitBook give you a better, more relevant answer. A goal is most helpful when it describes the outcome the user wants rather than restating the question. For example, with `ask=how do I create an API token`, a goal like `automate deployments from our CI pipeline` lets GitBook tailor the answer to that use case.

The response will contain a direct answer to the question and relevant excerpts and sources from the documentation.

Use this mechanism when the answer is not explicitly present in the current page, you need clarification or additional context, or you want to retrieve related documentation sections.