> For the complete documentation index, see [llms.txt](https://docs.powermonitor.com.br/llms.txt). Markdown versions of documentation pages are available by appending `.md` to page URLs; this page is available as [Markdown](https://docs.powermonitor.com.br/en/power-monitor/configuracoes/notificacoes.md).

# Notifications

All Power Monitor e-mail alerts, what triggers each one, who receives them, how to filter and how to test.

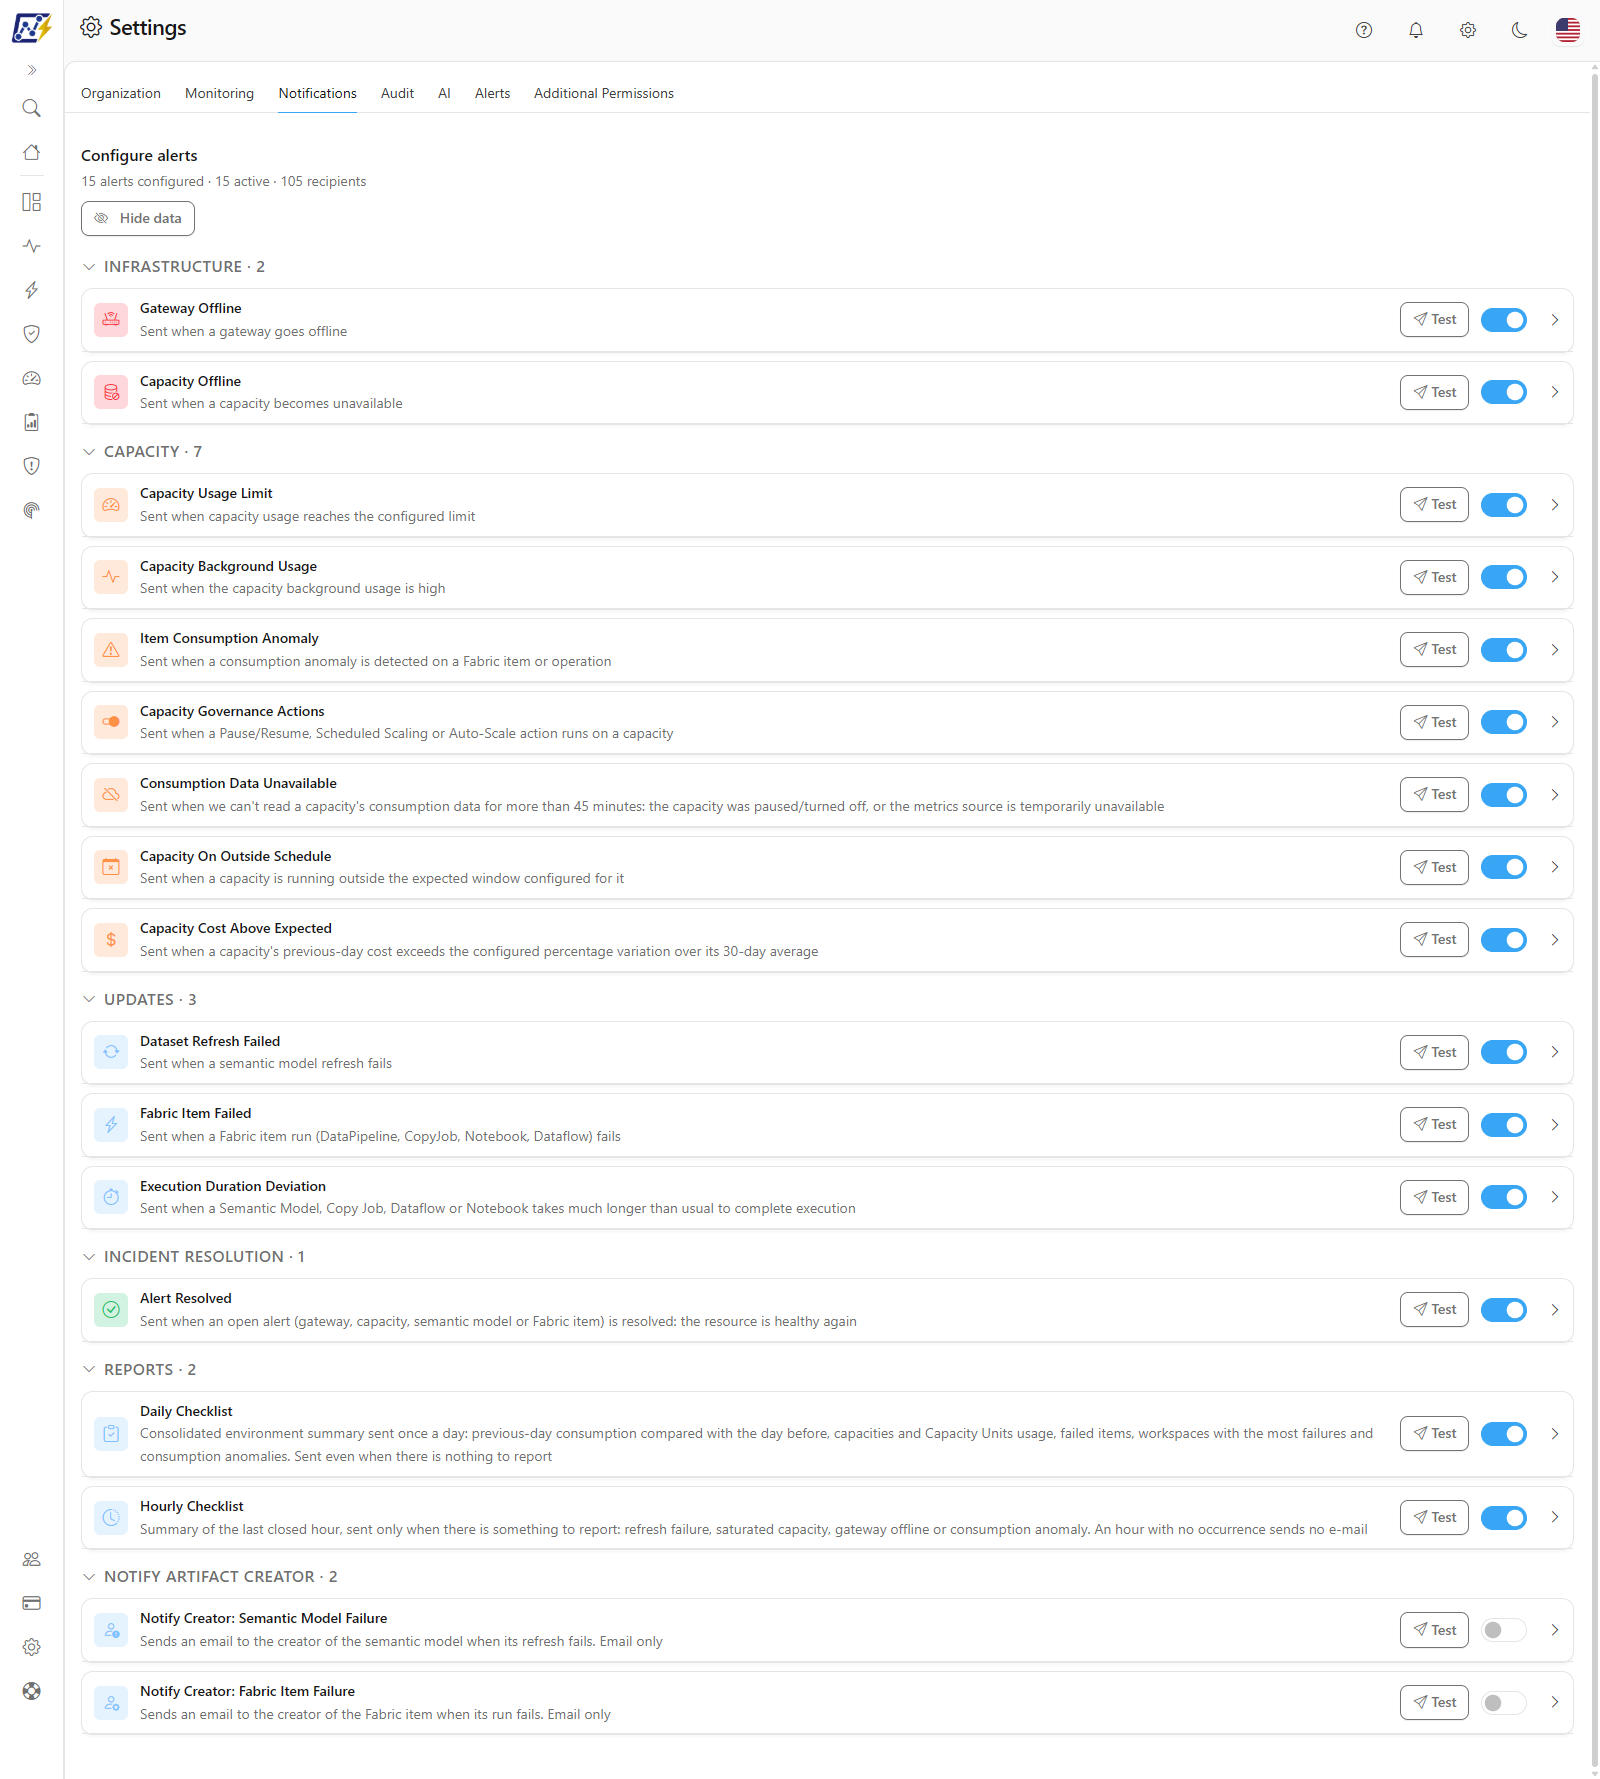
The **Notifications** tab lists all Power Monitor e-mail alert types and, for each one, **who receives it**. You turn each recipient on or off per alert type, turn the whole alert on/off and send a **test e-mail** to check the format. For semantic model refresh failures and Fabric item execution failures, you can also **filter by criticality** (of the workspace or the item), by **item type** and by **specific items**, and turn on the **notice to the artifact creator**.

**How to access:** *Settings › Notifications*. Exclusive to **Administrators**.

<figure><picture><source srcset="/files/rmgFrKtgZjfWior7o8uU" media="(prefers-color-scheme: dark)"><img src="https://3938213054-files.gitbook.io/~/files/v0/b/gitbook-x-prod.appspot.com/o/spaces%2FH2bFRBmIfyK3kwVKbldl%2Fuploads%2Fgit-blob-b7af083d9d8a96e6625689f9f8900c8216686bdd%2Fpm-configuracoes-notificacoes-pagina-en.png?alt=media" alt="Notifications tab with the alerts grouped by category"></picture><figcaption><p>Notifications tab</p></figcaption></figure>

## What it is for

* Deciding who receives each alert type (for example, only the infrastructure team receives **Gateway Offline**).
* Silencing an entire alert type for the organization.
* Seeing a sample of the e-mail before enabling it for the team.
* Reducing noise: receiving e-mails (and Teams, Slack and Telegram messages) only for the failures that matter, for example, only from workspaces with **High** or **Critical** criticality, or only from Data Pipelines.
* Taking the failure straight to whoever maintains the item: with the creator notice turned on, whoever created the semantic model or Fabric item receives the failure e-mail, even if they are not on the recipient list.

## Features

Switch changes on this tab are saved immediately, with no save button. Only the **Filters** have their own button (**Save filters**).

### Header summary

**What it is:** the **Configure alerts** title and the summary line right below it, for example *15 alerts configured · 13 active · 27 recipients*.

**What it is for:** checking at a glance whether any alerts are turned off and how many e-mail subscriptions are active.

<figure><picture><source srcset="/files/OZ3tOTmucFZr0qPj25TI" media="(prefers-color-scheme: dark)"><img src="https://3938213054-files.gitbook.io/~/files/v0/b/gitbook-x-prod.appspot.com/o/spaces%2FH2bFRBmIfyK3kwVKbldl%2Fuploads%2Fgit-blob-547fdb1b4ad5a67e23aa283f7ec1b5d0c3ca5e3d%2Fpm-configuracoes-notificacoes-resumo-cabecalho-en.png?alt=media" alt="Configure alerts title with the summary of configured alerts, active alerts and recipients"></picture><figcaption><p>Header summary</p></figcaption></figure>

**How it works:**

| Number                | Meaning                                                                                         |
| --------------------- | ----------------------------------------------------------------------------------------------- |
| **alerts configured** | How many alert types with a recipient list exist (does not include the creator notices).        |
| **active**            | How many of these types have at least one recipient turned on.                                  |
| **recipients**        | Sum of the recipients turned on across all types. A person who receives 5 types counts 5 times. |

### Hide data

**What it is:** the **Hide data** button, right below the header summary. Once turned on, it is renamed **Show data**.

**What it is for:** sharing the screen or taking a screenshot of the recipient list without exposing people's email addresses.

**How to use:** click **Hide data**. In the **Recipients** list, email addresses and initials are shown masked. To see the values again, click **Show data**.

**How it works:** the button is the same one used on the other Power Monitor screens: your choice applies to all of them and is remembered in this browser. The mask is visual only, a convenience for sharing the screen, and does not replace access control. The switches keep working normally.

### Alert categories

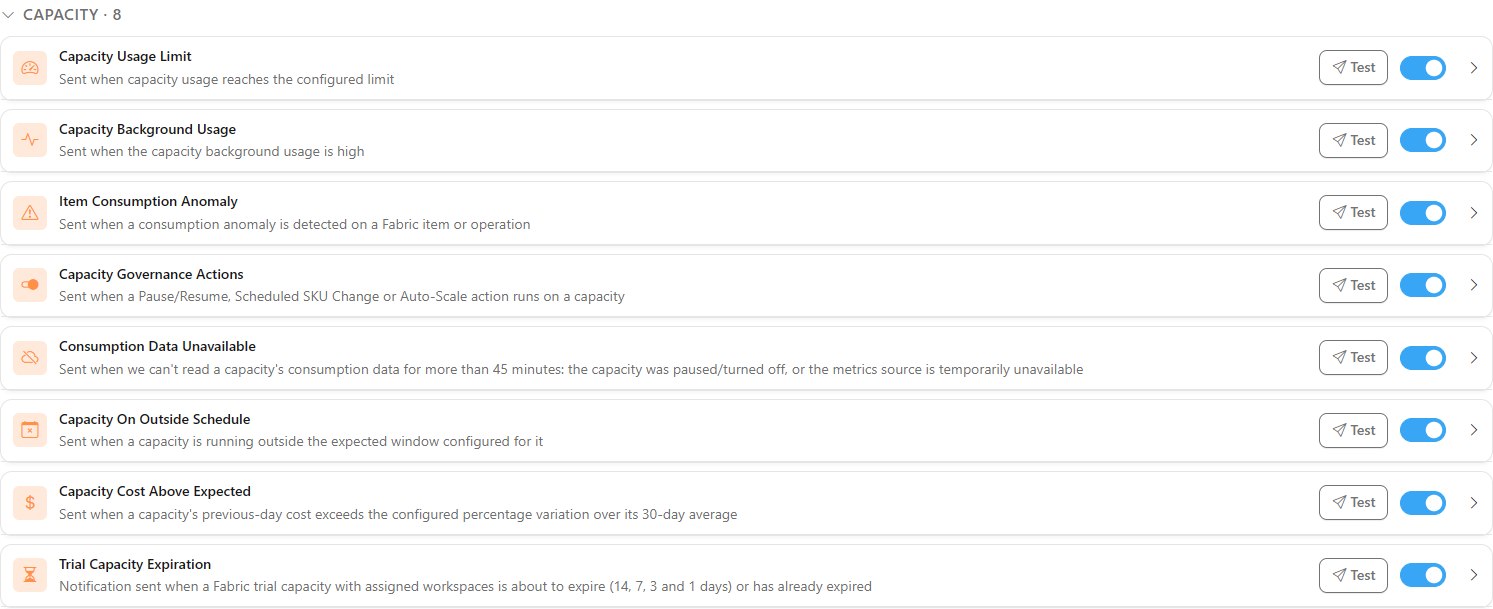
**What it is:** alerts are grouped into categories (**Infrastructure**, **Capacity**, **Refreshes**, **Incident Resolution**, **Reports** and **Notify artifact creator**). Each title shows how many alerts the category has (for example, **Capacity · 8**) and can be collapsed.

**What it is for:** quickly finding the alert you are interested in and hiding the categories you are not reviewing.

<figure><picture><source srcset="/files/65hF4C0VByqIxArfgkf0" media="(prefers-color-scheme: dark)"><img src="https://3938213054-files.gitbook.io/~/files/v0/b/gitbook-x-prod.appspot.com/o/spaces%2FH2bFRBmIfyK3kwVKbldl%2Fuploads%2Fgit-blob-e41216acf5cfd10413731433fbce1bcb40be21b0%2Fpm-configuracoes-notificacoes-categoria-en.png?alt=media" alt="Infrastructure category with the Gateway Offline and Capacity Offline cards"></picture><figcaption><p>An alert category</p></figcaption></figure>

<figure><picture><source srcset="/files/GHQFtNovpdyd3KiOR1gk" media="(prefers-color-scheme: dark)"><img src="https://3938213054-files.gitbook.io/~/files/v0/b/gitbook-x-prod.appspot.com/o/spaces%2FH2bFRBmIfyK3kwVKbldl%2Fuploads%2Fgit-blob-280fc79a5d5e7307038eb079c00a7369772bab0d%2Fpm-configuracoes-notificacoes-categoria-capacidade-en.png?alt=media" alt="Capacity category with the Capacity On Outside Schedule and Capacity Cost Above Expected alerts, each with the Test button"></picture><figcaption><p>Capacity alerts, including outside schedule and cost</p></figcaption></figure>

**How to use:** click the category title to collapse or expand it. All of them start expanded.

### Alert card

**What it is:** each alert type is a card with an icon, **name**, **description**, the **Test** button, the master switch and the expand arrow. See the complete list in [The alerts](#the-alerts).

**What it is for:** understanding what triggers that alert and acting on it without leaving the row.

<figure><picture><source srcset="/files/CACCqBFxXwcAJLUUVHS2" media="(prefers-color-scheme: dark)"><img src="https://3938213054-files.gitbook.io/~/files/v0/b/gitbook-x-prod.appspot.com/o/spaces%2FH2bFRBmIfyK3kwVKbldl%2Fuploads%2Fgit-blob-afc7138ed3de62130f5f83c0ddca10b1a1cf0452%2Fpm-configuracoes-notificacoes-card-en.png?alt=media" alt="Gateway Offline alert card with the Test button and the master switch"></picture><figcaption><p>An alert card</p></figcaption></figure>

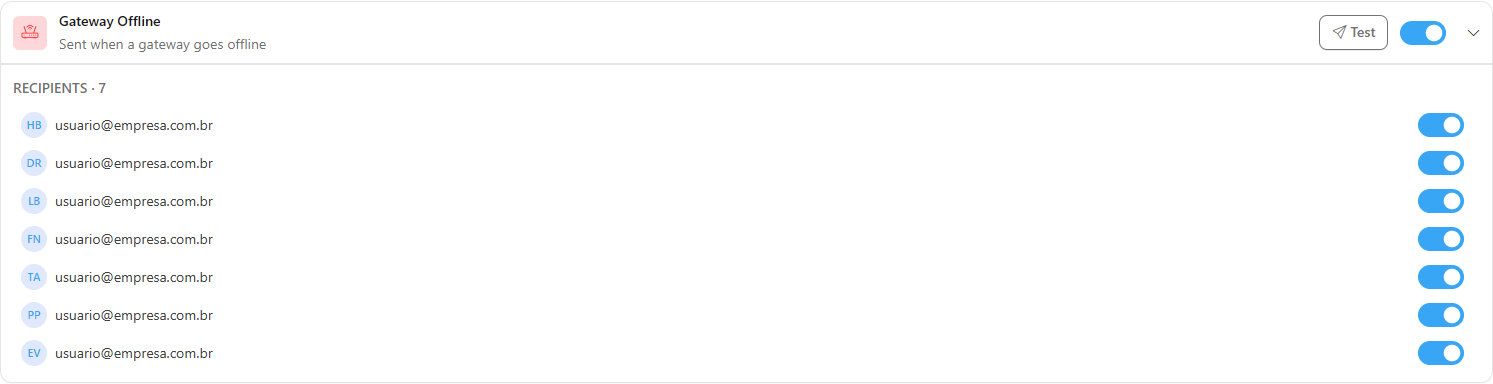
**How to use:** click the card's name or description (or use Enter/Space with focus on it) to expand it and see the **Recipients**. Clicking again collapses it.

### Recipients

**What it is:** the **Recipients · N** list that appears when you expand the card, with one switch per person, on the left, followed by their initials and e-mail.

**What it is for:** deciding exactly who receives each alert type, for example sending **Gateway Offline** only to the infrastructure team.

<figure><picture><source srcset="/files/p3d5LKKAcumV1oMyVbFn" media="(prefers-color-scheme: dark)"><img src="https://3938213054-files.gitbook.io/~/files/v0/b/gitbook-x-prod.appspot.com/o/spaces%2FH2bFRBmIfyK3kwVKbldl%2Fuploads%2Fgit-blob-00f878239e9097905604be3a03efa65583e285c4%2Fpm-configuracoes-notificacoes-destinatarios-en.png?alt=media" alt="Expanded alert card showing the list of recipients with switches"></picture><figcaption><p>Recipients of an alert</p></figcaption></figure>

**How to use:**

1. Expand the alert card.
2. Turn the person's switch on or off (clicking the e-mail also turns it on or off). Each change is saved immediately; in case of failure, the switch returns to its previous state and *Failed to update the setting. Please try again.* is displayed.

**Who appears as a recipient:**

* All **Administrators** of the organization.
* **Users** who have at least one workspace selected in **Receives alerts** (see [Users](/en/power-monitor/usuarios.md#workspace-scope)).

By default, everyone is **turned on**. Turning someone off here means "I do not want to receive this type", which overrides the workspace scope. If the list is empty, *No administrator users registered.* is displayed.

### Alert master switch

**What it is:** the switch to the right of the **Test** button, in the card header. It is on when at least one recipient is active.

**What it is for:** silencing (or reactivating) an entire alert type for the organization with one click.

**How to use:**

1. Find the alert card.
2. Click the master switch. Turning it off disables **all** recipients of that alert at once; turning it on reactivates all of them.
3. Check the header summary. If some of the recipients cannot be updated, *Could not update X of Y recipients.* is displayed.

**Rules:** the switch is locked when the alert has no recipients.

{% hint style="info" %}
Turning off an alert here only stops the **e-mail**. Detection continues and the alert remains visible in [Monitoring › Alerts](/en/power-monitor/monitoramento/alertas.md) and in the Teams, Slack and Telegram channels that have that type selected.
{% endhint %}

{% hint style="info" %}
Even with the alert turned on here, an alert that is **silenced** (by a silence rule) or **correlated** to a root alert that is still open is recorded and remains visible in [Monitoring › Alerts](/en/power-monitor/monitoramento/alertas.md), but does not generate an e-mail or a channel message.
{% endhint %}

### Test (test e-mail)

**What it is:** the **Test** button on each card, which sends a **sample e-mail** of that type **only to you** (the signed-in administrator), with fictitious data.

**What it is for:** seeing how the e-mail arrives (format, subject, sender) and confirming that sending works, without waiting for a real incident and without bothering the team.

**How to use:**

1. On the alert card, click **Test**.
2. *Test e-mail sent. Check your inbox.* is displayed.
3. If it does not arrive, check your spam folder and, if you use your own SMTP, the configuration in [Alerts](/en/power-monitor/configuracoes/alertas.md#how-to-use-the-company-smtp-server). In case of failure, *Could not send the test e-mail. Please try again.* is displayed.

### Criticality filters

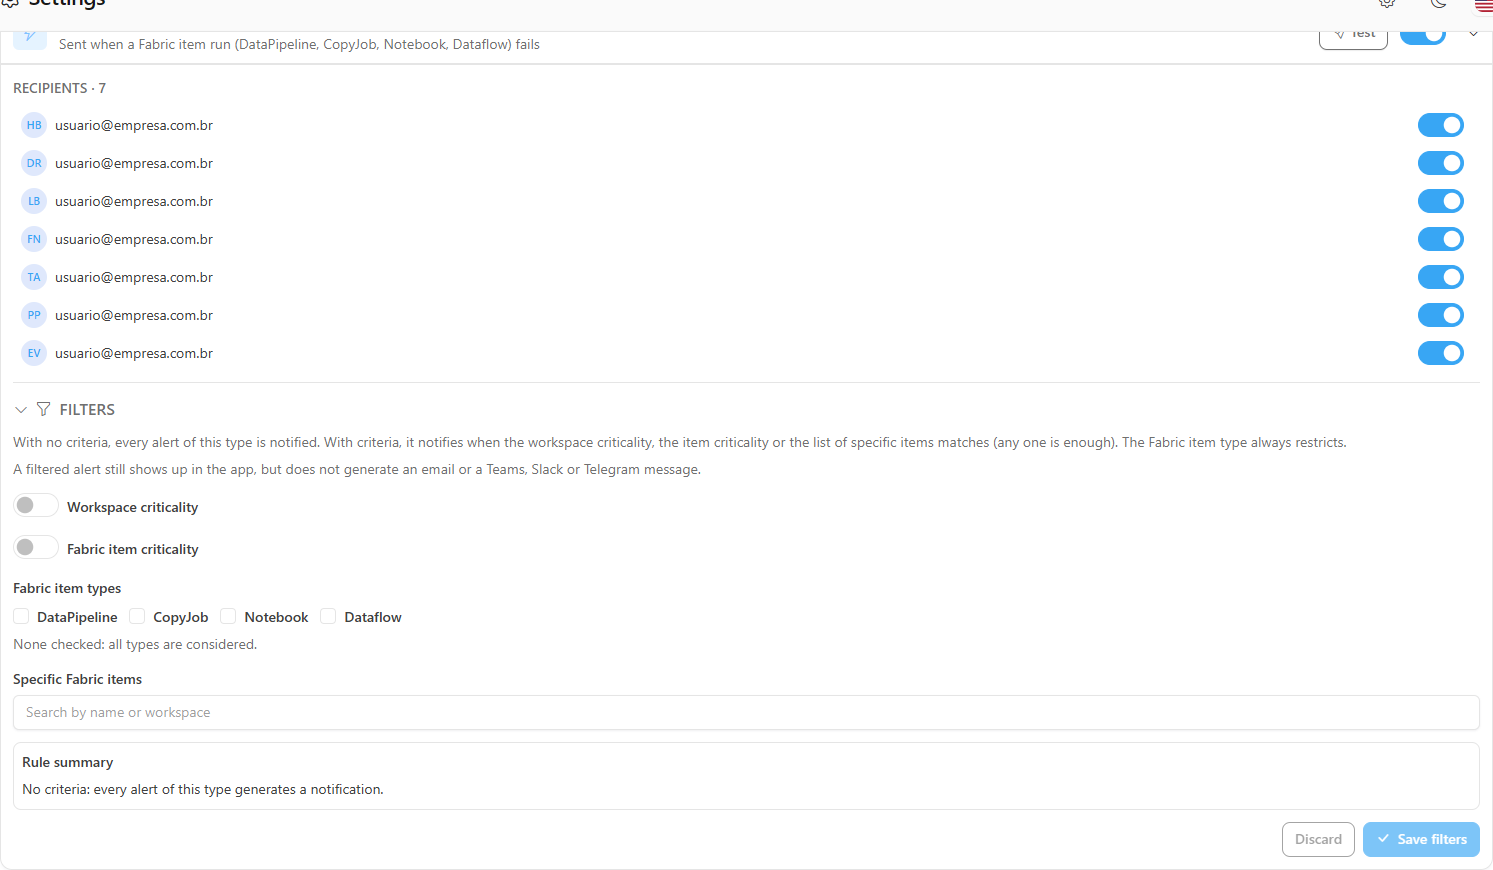
**What it is:** the collapsible **Filters** section, which appears below the recipient list on the **Dataset Refresh Failed** and **Fabric Item Failed** cards (and inside the creator notices). The first criteria are criticality switches.

**What it is for:** receiving e-mails only for the failures that matter, for example only from **High** or **Critical** workspaces.

<figure><picture><source srcset="/files/bcIcARZDNr7w40LqtWnG" media="(prefers-color-scheme: dark)"><img src="https://3938213054-files.gitbook.io/~/files/v0/b/gitbook-x-prod.appspot.com/o/spaces%2FH2bFRBmIfyK3kwVKbldl%2Fuploads%2Fgit-blob-9846128c20468d5b2b0299c0400ea13684447cd3%2Fpm-configuracoes-notificacoes-filtros-en.png?alt=media" alt="Filters panel of the Fabric Item Failed alert with criticality, item types, specific items and rule summary"></picture><figcaption><p>Filters panel of a failure alert</p></figcaption></figure>

| Field                                                        | What it does                                                                                                                                                                                                                                                                                                                     |
| ------------------------------------------------------------ | -------------------------------------------------------------------------------------------------------------------------------------------------------------------------------------------------------------------------------------------------------------------------------------------------------------------------------- |
| **Workspace criticality**                                    | Switch that activates the criterion. When on, it shows the **Unclassified**, **Low**, **Medium**, **High** and **Critical** levels as buttons to select. The criticality comes from the workspace's governance metadata ([Workspaces](/en/power-monitor/governanca/workspaces.md#governance-metadata)).                          |
| **Semantic model criticality** / **Fabric item criticality** | Same behavior, using the criticality of the item itself: that of the semantic model ([Semantic Models](/en/power-monitor/governanca/modelos-semanticos.md)) or that of the Fabric item ([Data Engineering](/en/power-monitor/governanca/dados-e-engenharia/engenharia-de-dados.md#how-to-edit-the-governance-of-a-fabric-item)). |

**How to use:** see the step-by-step guide [How to receive failure alerts only from the most critical workspaces or items](#how-to-receive-failure-alerts-only-from-the-most-critical-workspaces-or-items).

**Rules:** see [How filters are evaluated](#how-filters-are-evaluated). A filtered alert still appears in the app, but does not generate an e-mail or a Teams, Slack or Telegram message.

### Fabric item types

**What it is:** the **DataPipeline**, **CopyJob**, **Notebook** and **Dataflow** checkboxes inside **Filters**, only in the Fabric item alert (and in the corresponding creator notice).

**What it is for:** receiving alerts only for some item types, for example only for Data Pipelines.

**How to use:**

1. On the **Fabric Item Failed** card, open **Filters**.
2. In **Fabric item types**, select the types you want. None selected means all.
3. Click **Save filters**. The summary then says, for example, *Only items of type: DataPipeline.*

**Rules:** the type **always restricts**: even if another criterion matches, a failure of an unselected type is not notified.

### Specific items

**What it is:** the **Specific semantic models** (or **Specific Fabric items**) field inside **Filters**, with the **Search by name or workspace** search. The chosen items become removable tags.

**What it is for:** guaranteeing the alert for an important item that does not yet have a criticality, or following a specific semantic model.

<figure><picture><source srcset="/files/4QUT7SLlC5nUYHCrW4Rt" media="(prefers-color-scheme: dark)"><img src="https://3938213054-files.gitbook.io/~/files/v0/b/gitbook-x-prod.appspot.com/o/spaces%2FH2bFRBmIfyK3kwVKbldl%2Fuploads%2Fgit-blob-dfda0c80cea4781b31bdba4ac4f7a37599f4c169%2Fpm-configuracoes-notificacoes-filtros-itens-especificos-en.png?alt=media" alt="Specific items search in the Filters panel with the list of results"></picture><figcaption><p>Specific items search</p></figcaption></figure>

**How to use:**

1. In the **Filters** panel, type part of the item or workspace name in **Search by name or workspace**.
2. Click the item in the results list: it becomes a tag above the field. Repeat for other items. To remove one, click the tag's **x**.
3. Click **Save filters**.

**Rules:**

* In the Fabric items alert, the search shows only the types selected in **Fabric item types**, when there are any.
* The chosen items **add** to the criticality criteria: the failure is notified if the item is in the list **or** if the criticality matches.
* If a chosen item no longer exists in the inventory, the tag appears as *Item not found (…)*, so that you can remove it.

### Rule summary, Discard and Save filters

**What it is:** the **Rule summary** box, which describes in plain language what will be notified with the current values, and the **Discard** and **Save filters** buttons.

**What it is for:** checking the effect of the filters before saving, without having to interpret each field.

<figure><picture><source srcset="/files/IOxjb1YxQVsGbnqKAOB7" media="(prefers-color-scheme: dark)"><img src="https://3938213054-files.gitbook.io/~/files/v0/b/gitbook-x-prod.appspot.com/o/spaces%2FH2bFRBmIfyK3kwVKbldl%2Fuploads%2Fgit-blob-e989fad7adf29e87ebd4f9ed84ad7137866a6e2e%2Fpm-configuracoes-notificacoes-filtros-resumo-en.png?alt=media" alt="Rule summary box of the Filters panel"></picture><figcaption><p>Rule summary</p></figcaption></figure>

**How to use:**

1. Adjust the criteria and read the **Rule summary**, for example *Notifies when: workspace criticality is High, Critical or item is one of the 3 selected.* With no criteria, it shows *No criteria: every alert of this type generates a notification.*
2. Click **Save filters** to save. *Filters saved.* is displayed. In case of error, *Could not save the filters. Check the values and try again.* is displayed.
3. To give up changes not yet saved, click **Discard**.

**Rules:** nothing is saved until you click **Save filters**. While there are pending changes, *Unsaved changes* is displayed. Both buttons are disabled when there are no changes. Each save is recorded in [Audit › Application Events](/en/power-monitor/auditoria/eventos-da-aplicacao.md).

### Filter active badge

**What it is:** the **Filter active** badge, next to the card name, when the rule has some saved criterion.

**What it is for:** warning, without opening the card, that not every failure of that type generates an e-mail. It is the first thing to check when someone says they did not receive an alert.

**How it works:** the badge appears on the **Dataset Refresh Failed** and **Fabric Item Failed** cards; on the creator notices, it only appears when the notice is turned on. It disappears when all criteria are removed and the filters are saved.

### Notify artifact creator

**What it is:** the **Notify artifact creator** category, at the end of the screen, with two cards turned off by default:

* **Notify Creator: Semantic Model Failure**: sends an e-mail to the creator of the semantic model when its refresh fails.
* **Notify Creator: Fabric Item Failure**: sends an e-mail to the creator of the Data Pipeline, Copy Job, Notebook or Dataflow Gen2 when its execution fails.

**What it is for:** taking the failure straight to whoever maintains the item, even if that person does not use Power Monitor.

<figure><picture><source srcset="/files/uTQHxlGDXwoQUwafRuJK" media="(prefers-color-scheme: dark)"><img src="https://3938213054-files.gitbook.io/~/files/v0/b/gitbook-x-prod.appspot.com/o/spaces%2FH2bFRBmIfyK3kwVKbldl%2Fuploads%2Fgit-blob-786dceec3056ff98c8ceb058da64cc08d7f2fae2%2Fpm-configuracoes-notificacoes-criador-en.png?alt=media" alt="Notify artifact creator section with the two cards"></picture><figcaption><p>Artifact creator notice</p></figcaption></figure>

**How to use:** see the step-by-step guide [How to notify the item creator when it fails](#how-to-notify-the-item-creator-when-it-fails).

**How it works:** each card has the **Test** button, a switch to turn the notice on/off and, when expanded, the same **Filters** panel (independent from the main alert's filters). These cards do not have a recipient list: the recipient is always the item's creator. While the notice is turned off, the expanded card shows *Off: no email is sent to the creator.* See the rules in [Artifact creator notice](#artifact-creator-notice).

### Capacity usage alert limits

**What it is:** the limits panel inside the **Capacity Usage Limit** and **Capacity Background Usage** cards, in the **Capacity** category. Each card's header shows the value in effect in a badge: **Limit: 80%**, **Levels: Low 50% · Medium 70% · …**, or **Background: no alert**.

**What it is for:** adjusting how much usage the organization wants to be notified about, instead of using fixed values. For example, being notified only above 90% total usage, or receiving only the High and Critical background levels.

| Card                          | Field                                                                        | What it defines                                                                                                                                                           |
| ----------------------------- | ---------------------------------------------------------------------------- | ------------------------------------------------------------------------------------------------------------------------------------------------------------------------- |
| **Capacity Usage Limit**      | **Total usage limit** › **Limit (%)**                                        | The alert opens when the capacity's total usage (interactive + background) reaches or exceeds this percent and is closed when usage drops back below it. Default **80%**. |
| **Capacity Background Usage** | **Background usage levels**: **Low**, **Medium**, **High**, and **Critical** | Each level applies from its percent up to the next filled level; the highest filled level applies to any usage above it. Default **50%**, **70%**, **80%**, and **100%**. |

**How to use:**

1. In *Settings › Notifications*, expand the **Capacity Usage Limit** or **Capacity Background Usage** card.
2. Enter the percents. To skip a background level, leave it **Blank**; below the fields, the range each level covers is shown (for example, *70% to 80%*, *from 100%*, or *skipped*).
3. Click **Save limits**. *Limits saved. They apply from the next consumption collection.* is shown. Use **Discard** to go back to the saved values or **Restore defaults** to fill in the default values.

**Rules:**

* Only **Administrators** change the limits.
* Values are whole numbers from **10 to 100**.
* Filled levels must be ascending (**Low < Medium < High < Critical**), with no repeated values, even with a blank level in between. A value out of order shows the message in the field itself (for example, *High must be greater than Low (85%).*) and **Save limits** is disabled.
* With all levels blank, *All levels are blank: no background usage alert will be sent.* is shown.
* The background alert is sent at most **once per level per day**, in the organization's time zone (set in [Organization](/en/power-monitor/configuracoes/organizacao.md#organization-language-and-time-zone)); moving up a level sends a new notice.
* The limits apply to all of the organization's capacities and to every channel (e-mail, Microsoft Teams, Slack, and Telegram), which now show the configured limit and level. They do not change the colors of the capacity screens.

## The alerts

| Category                | Alert                                      | When it is sent                                                                                                                                                                                                                                                                                                                                    |
| ----------------------- | ------------------------------------------ | -------------------------------------------------------------------------------------------------------------------------------------------------------------------------------------------------------------------------------------------------------------------------------------------------------------------------------------------------- |
| Infrastructure          | **Gateway Offline**                        | A monitored gateway goes offline. The status is checked every 5 minutes (requires **Gateway Monitoring** to be turned on).                                                                                                                                                                                                                         |
| Infrastructure          | **Capacity Offline**                       | A monitored capacity becomes unavailable (inactive or being deprovisioned).                                                                                                                                                                                                                                                                        |
| Capacity                | **Capacity Usage Limit**                   | The capacity's **total** usage (interactive + background) reaches or exceeds the configured limit (default **80%**). See [Capacity usage alert limits](#capacity-usage-alert-limits).                                                                                                                                                              |
| Capacity                | **Capacity Background Usage**              | Background usage reaches or exceeds one of the configured levels: **Low**, **Medium**, **High**, or **Critical** (default 50%, 70%, 80%, and 100%). It is sent at most once a day for each level.                                                                                                                                                  |
| Capacity                | **Item Consumption Anomaly**               | A consumption anomaly is detected in a Fabric item or operation. It can also be turned on/off on the [Consumption Anomalies](/en/power-monitor/monitoramento/anomalias-de-consumo.md) screen.                                                                                                                                                      |
| Capacity                | **Capacity Governance Actions**            | A pause/resume, scheduled SKU change or autoscale action is performed on a capacity.                                                                                                                                                                                                                                                               |
| Capacity                | **Consumption Data Unavailable**           | A capacity's consumption data could not be read for more than **45 minutes** (capacity paused/turned off or metrics source temporarily unavailable).                                                                                                                                                                                               |
| Capacity                | **Capacity On Outside Schedule**           | A monitored capacity is running outside the expected window configured for it (see [Capacity outside-schedule and cost alerts](#capacity-outside-schedule-and-cost-alerts)). When it is turned off or returns to the window, a resolved e-mail is also sent.                                                                                       |
| Capacity                | **Capacity Cost Above Expected**           | A capacity's previous-day cost exceeds the configured percentage variation over its 30-day average. Evaluated once a day.                                                                                                                                                                                                                          |
| Capacity                | **Trial Capacity Expiration**              | A Fabric trial capacity with assigned workspaces is about to expire (**14**, **7**, **3** or **1** day left) or has already expired. Only monitored workspaces that still exist are counted (deleted workspaces are left out), and the e-mail lists their names in a highlighted block, **Workspaces on this capacity (N)**, right after the text. |
| Refreshes               | **Dataset Refresh Failed**                 | A semantic model refresh fails (requires **Semantic Model Monitoring** to be turned on).                                                                                                                                                                                                                                                           |
| Refreshes               | **Fabric Item Failed**                     | The execution of a DataPipeline, Copy Job, Notebook or Dataflow fails (requires **Fabric Jobs** monitoring to be turned on).                                                                                                                                                                                                                       |
| Refreshes               | **Execution Duration Deviation**           | A semantic model, Copy Job, Dataflow or Notebook takes much longer than normal to complete (configured in [Monitoring › Execution Duration Deviation](/en/power-monitor/configuracoes/monitoramento.md#execution-duration-deviation)).                                                                                                             |
| Notify artifact creator | **Notify Creator: Semantic Model Failure** | Same trigger as **Dataset Refresh Failed**, sent by e-mail only to the creator of the semantic model. Off by default.                                                                                                                                                                                                                              |
| Notify artifact creator | **Notify Creator: Fabric Item Failure**    | Same trigger as **Fabric Item Failed**, sent by e-mail only to the creator of the item. Off by default.                                                                                                                                                                                                                                            |
| Incident Resolution     | **Alert Resolved**                         | An open alert (gateway, capacity, semantic model or Fabric item) is resolved: the resource is healthy again.                                                                                                                                                                                                                                       |
| Reports                 | **Daily Checklist**                        | Consolidated summary of the environment sent **once a day** (around 08:00, Brasília time, UTC-3): the previous day's consumption compared to the day before, capacities and Capacity Units usage, failed items, workspaces with the most failures and anomalies. It is sent even when there are no occurrences.                                    |
| Reports                 | **Hourly Checklist**                       | Summary of the last full hour, sent **only when there is something to report**: refresh failure, saturated capacity (includes the background threshold configured in [Monitoring](/en/power-monitor/configuracoes/monitoramento.md#capacity-metrics-source)), offline gateway or consumption anomaly.                                              |

## Rules and behavior

### How many e-mails an incident generates

The behavior depends on the resource type:

| Resource                                                         | Opening              | While the problem continues                                                                                                                                                             | Resolution         |
| ---------------------------------------------------------------- | -------------------- | --------------------------------------------------------------------------------------------------------------------------------------------------------------------------------------- | ------------------ |
| **Gateway**, **semantic model** and **Fabric item**              | 1 e-mail             | **No** new e-mail: recurrences are added to the open alert and appear in the **Hourly Checklist** and on the [Alerts](/en/power-monitor/monitoramento/alertas.md) screen.               | **Alert Resolved** |
| **Capacity** (**Capacity Offline** and **Capacity Usage Limit**) | 1 e-mail             | **E-mail reminders**: the first about 30 minutes after opening and then at most one per hour, while the capacity remains unavailable or above the limit.                                | **Alert Resolved** |
| **Capacity** (**Capacity Background Usage**)                     | 1 e-mail             | At most **one e-mail per day for each configured level** (Low, Medium, High, and Critical), counting the day in the organization's time zone: moving up a level generates a new e-mail. | —                  |
| **Consumption Data Unavailable**                                 | 1 e-mail per episode | None                                                                                                                                                                                    | —                  |

After the problem is resolved, a new failure opens a new incident and generates an e-mail again. Capacity reminders are also sent to the Teams, Slack and Telegram channels that have the type selected.

### Capacity outside-schedule and cost alerts

These two alerts have their own configuration, done on another screen; here you only choose **who receives** them and test the e-mail.

* **Capacity On Outside Schedule:** the window in which the capacity should be running is defined **per capacity**, in the **Schedule Alerts** tab of [Governance › Capacities](/en/power-monitor/governanca/infraestrutura/capacidades.md#schedule-alerts-tab), together with that alert's recipients (administrators and/or additional e-mails). Each person's switch on this card controls only the **administrators** part: turning someone off here removes them from that list, but the additional e-mails registered in the capacity's alert keep receiving it. While the capacity stays on outside the window, the e-mail is resent at the interval defined on the capacity; when it is turned off or returns to the window, the resolved e-mail is sent.
* **Capacity Cost Above Expected:** the limit (percentage above the average) is defined in [Capacity Cost › Cost Alerts](/en/power-monitor/dashboards/custo-de-capacidade.md#cost-alerts), for one capacity or for all of them. Once a day, Power Monitor compares the previous day's cost with the average of the 30 days before it; if it exceeds the limit, it records the alert (visible in [Monitoring › Alerts](/en/power-monitor/monitoramento/alertas.md)) and sends an e-mail to the recipients turned on in this card. Each capacity generates at most one e-mail per day.
* Both alerts are sent **by e-mail only**: they do not generate messages in Teams, Slack or Telegram.
* The **Test** button works on both and sends a sample e-mail only to you.

### Workspace scope

* Alerts tied to a workspace (refresh failure, Fabric item failure, anomaly, duration deviation) go to Administrators with no alert restriction and to those who have that workspace in **Receives alerts**.
* Alerts **with no workspace** (gateway and capacity) go to all eligible recipients.
* The **checklists** (daily and hourly) are sent to **Administrators**, with the full content of the environment.
* The per-recipient switch on this screen always prevails: when off, the person does not receive that type.

### How filters are evaluated

Filters exist for **Dataset Refresh Failed**, **Fabric Item Failed** and the two creator notices. The rule is evaluated for each failure, in this order:

1. **With no criteria**, every alert of that type is notified (this is the default).
2. Selected **Fabric item types** **always restrict**: a failure of an unselected type is not notified.
3. Among the other criteria, **"OR"** applies: the failure is notified if the **workspace criticality** is among the selected ones, **or** the **item criticality** is among the selected ones, **or** the item is in the **specific items** list. Only one needs to match.
4. A criterion that is turned off (or has no level selected) **does not participate**; it does not mean "all".

Important points:

* **Unclassified** is a level like the others: it matches workspaces or items that do not yet have a defined criticality. When you turn on a criticality criterion, it is already selected, so that items not yet classified are not silenced by accident. Unselect it if you want to notify only classified ones.
* A **filtered** alert is still recorded and appears normally in [Monitoring › Alerts](/en/power-monitor/monitoramento/alertas.md), but **does not generate an e-mail or a message** in Teams, Slack or Telegram.
* Filters apply to the entire organization and add to the other rules: the recipient must be turned on on this screen and have the workspace in their alert scope.
* Each filter save is recorded in [Audit › Application Events](/en/power-monitor/auditoria/eventos-da-aplicacao.md), with the before and after values.

### Artifact creator notice

* **Who the creator is:** for semantic models and Dataflows Gen2, the person who configured the item (the owner of the configuration in Power BI/Fabric); for Data Pipelines, Copy Jobs and Notebooks, whoever created the item.
* The notice is only sent when this field contains a **valid e-mail**. Items created by a Service Principal or with an unknown creator do not generate a notice.
* The creator **does not need to be a Power Monitor user** and does not depend on the workspace scope or the recipient list.
* It is **e-mail only**, with the same content as the main alert and the subject marked with **\[Criador]**. It does not go to Teams, Slack or Telegram.
* If the creator has already received the main alert as a recipient, they **do not receive a duplicate copy**.
* It follows the same sending rules as the main alert: only when the incident opens, with no repetition on recurrences.
* The creator notice filters are independent from the main alert filters. For example, you can send the main alert to the team only for **Critical** workspaces and notify the creator of any failure.

### Channels

This tab controls **e-mails**. The same alerts (except **Capacity On Outside Schedule**, **Capacity Cost Above Expected**, **Execution Duration Deviation** and the creator notices) can also be sent to **Microsoft Teams**, **Slack** and **Telegram** channels, with per-channel type selection, configured in [Alerts](/en/power-monitor/configuracoes/alertas.md). Channels do not depend on the recipients on this screen.

The e-mail sending server can be Power Monitor's default or your organization's SMTP, also in [Alerts](/en/power-monitor/configuracoes/alertas.md). The history of e-mails sent can be consulted in [Audit › Email Audit](/en/power-monitor/auditoria/auditoria-de-emails.md).

## Step by step

All the flows below require the **Administrator** role and start from *Settings › Notifications*.

### How to restrict an alert to a few people

Use this to, for example, send **Gateway Offline** only to the infrastructure team.

{% stepper %}
{% step %}

### Open the alert

Click the alert card to expand the **Recipients** list.
{% endstep %}

{% step %}

### Turn off those who should not receive it

Turn off the switch of the people who should not receive that alert type. Each change is saved immediately; in case of failure, *Failed to update the setting. Please try again.* is displayed.
{% endstep %}

{% step %}

### Test

Click **Test** on the card to receive a sample of the alert in your e-mail.
{% endstep %}
{% endstepper %}

### How to add a user as a recipient

A **User** (non-administrator) only appears in the list after having at least one workspace in **Receives alerts**.

1. In [Users](/en/power-monitor/usuarios.md#features), edit the person and select the workspaces in the **Receives alerts** list.
2. Go back to *Settings › Notifications* and open the alert card: the person appears in **Recipients**, already turned on.

### How to receive failure alerts only from the most critical workspaces or items

Use this so that the team only receives e-mails for the failures that matter, for example, from **High** or **Critical** workspaces. Prerequisite: criticality must be filled in in the governance metadata of the workspaces ([Workspaces](/en/power-monitor/governanca/workspaces.md#how-to-edit-the-governance-metadata)), semantic models ([Semantic Models](/en/power-monitor/governanca/modelos-semanticos.md)) or Fabric items ([Data Engineering](/en/power-monitor/governanca/dados-e-engenharia/engenharia-de-dados.md#how-to-edit-the-governance-of-a-fabric-item)).

{% stepper %}
{% step %}

### Open the Filters panel

In *Settings › Notifications*, **Refreshes** group, click the **Dataset Refresh Failed** or **Fabric Item Failed** card to expand it. Below the recipients, click **Filters**.
{% endstep %}

{% step %}

### Turn on the criticality criterion

Turn on the **Workspace criticality** switch (or **Semantic model criticality** / **Fabric item criticality**). The levels appear as buttons, with **Unclassified** already selected.
{% endstep %}

{% step %}

### Select the levels

Click the levels that should generate notifications (for example, **High** and **Critical**). To leave out items not yet classified, click **Unclassified** to unselect it. Clicking a level again unselects it.
{% endstep %}

{% step %}

### Check the summary and save

Read the **Rule summary** (for example, *Notifies when: workspace criticality is High, Critical.*) and click **Save filters**. *Filters saved.* is displayed and the card shows the **Filter active** badge. If something goes wrong, *Could not save the filters. Check the values and try again.* is displayed.
{% endstep %}
{% endstepper %}

{% hint style="info" %}
If you turn on both criticality criteria (workspace and item), only **one** of them needs to match for the failure to be notified.
{% endhint %}

### How to undo a filter

* To discard changes not yet saved, click **Discard**.
* To go back to notifying all alerts of the type, turn off the criticality switches, unselect the item types, remove the specific items and click **Save filters**. The summary shows *No criteria: every alert of this type generates a notification.* and the **Filter active** badge disappears.

### How to notify the item creator when it fails

{% stepper %}
{% step %}

### Find the section

In *Settings › Notifications*, scroll down to **Notify artifact creator**.
{% endstep %}

{% step %}

### Turn on the notice

On the **Notify Creator: Semantic Model Failure** and/or **Notify Creator: Fabric Item Failure** card, turn on the switch. While it is turned off, the expanded card displays *Off: no email is sent to the creator.* If saving fails, *Could not update the creator notification. Please try again.* is displayed.
{% endstep %}

{% step %}

### Restrict it, if you want

Click the card to expand it and use the **Filters** panel (criticality, item types and specific items) to limit which failures generate the notice. Click **Save filters**. Filters can be configured before turning on the notice.
{% endstep %}

{% step %}

### Test

Click **Test** on the card to receive, only in your e-mail, a sample of the notice (with the subject marked with **\[Criador]**).
{% endstep %}
{% endstepper %}

## Frequently asked questions

<details>

<summary>I clicked Test, but only I received it. Is that right?</summary>

Yes. The test e-mail goes only to the administrator who clicked, with sample data. To test the Teams, Slack or Telegram channels, use **Send test** in [Alerts](/en/power-monitor/configuracoes/alertas.md).

</details>

<details>

<summary>A user does not appear in the recipient list. Why?</summary>

Users with the **User** role only appear if they have at least one workspace in **Receives alerts**. Configure this in [Users](/en/power-monitor/usuarios.md#workspace-scope).

</details>

<details>

<summary>I received the failure alert once and then did not receive it again, but the problem continues. Is that normal?</summary>

For gateways, semantic models and Fabric items, yes: the e-mail is sent when the incident opens; recurrences appear in the Hourly Checklist and on the Alerts screen, and you will receive **Alert Resolved** when the resource returns to normal. For **Capacity Offline** and **Capacity Usage Limit** it is different: while the problem continues, Power Monitor sends reminders (the first about 30 minutes after opening and then at most one per hour).

</details>

<details>

<summary>A failure appeared on the Alerts screen, but nobody received an e-mail. Why?</summary>

Check whether the alert card has the **Filter active** badge. An alert that does not meet the filters is still recorded on the [Alerts](/en/power-monitor/monitoramento/alertas.md) screen, but does not generate an e-mail or channel message. Check the **Rule summary** in the **Filters** panel and the criticality of the workspace and item. Remember that workspaces and items with no criticality are only notified if **Unclassified** is selected.

</details>

<details>

<summary>I turned on the creator notice, but the creator did not receive the e-mail.</summary>

The notice is only sent when the creator recorded on the item is a **valid e-mail** (items created by a Service Principal do not generate a notice), when the failure passes the creator notice filters and when it is the **opening** of the incident. If the creator is already a recipient of the main alert, they receive only the main e-mail, with no duplicate copy.

</details>

<details>

<summary>I turned off the alert, but I still see the problems on the Alerts screen.</summary>

This tab only controls the sending of e-mails. Detection continues and the alerts remain recorded in [Monitoring › Alerts](/en/power-monitor/monitoramento/alertas.md). To stop detection, turn off the collection in [Monitoring](/en/power-monitor/configuracoes/monitoramento.md).

</details>

## Related pages

* [Alerts (channels and SMTP)](/en/power-monitor/configuracoes/alertas.md)
* [Monitoring (collections)](/en/power-monitor/configuracoes/monitoramento.md)
* [Governance › Capacities (schedule alert)](/en/power-monitor/governanca/infraestrutura/capacidades.md#schedule-alerts-tab)
* [Capacity Cost (cost alerts)](/en/power-monitor/dashboards/custo-de-capacidade.md#cost-alerts)
* [Monitoring › Alerts](/en/power-monitor/monitoramento/alertas.md)
* [Users › Workspace scope](/en/power-monitor/usuarios.md#workspace-scope)
* [Governance › Workspaces (criticality)](/en/power-monitor/governanca/workspaces.md#governance-metadata)
* [Governance › Data and Engineering › Data Engineering (Fabric item governance)](/en/power-monitor/governanca/dados-e-engenharia/engenharia-de-dados.md#how-to-edit-the-governance-of-a-fabric-item)


---

# Agent Instructions
This documentation is published with GitBook. GitBook is the documentation platform designed so that both humans and AI agents can read, navigate, and reason over technical content effectively. Learn more at gitbook.com.

## Querying This Documentation
If you need additional information that is not directly available in this page, you can query the documentation by asking a question.

Perform an HTTP GET request on the following URL with the `ask` and `goal` query parameters:

```
GET https://docs.powermonitor.com.br/en/power-monitor/configuracoes/notificacoes.md?ask=<question>&goal=<user_goal>
```

`ask` is the immediate question: it should be specific, self-contained, and written in natural language.
`goal` is what the user is ultimately trying to achieve, the reason they need the answer. Sharing it helps GitBook give you a better, more relevant answer. A goal is most helpful when it describes the outcome the user wants rather than restating the question. For example, with `ask=how do I create an API token`, a goal like `automate deployments from our CI pipeline` lets GitBook tailor the answer to that use case.

The response will contain a direct answer to the question and relevant excerpts and sources from the documentation.

Use this mechanism when the answer is not explicitly present in the current page, you need clarification or additional context, or you want to retrieve related documentation sections.