> For the complete documentation index, see [llms.txt](https://docs.powermonitor.com.br/llms.txt). Markdown versions of documentation pages are available by appending `.md` to page URLs; this page is available as [Markdown](https://docs.powermonitor.com.br/en/power-monitor/dashboards.md).
# Dashboards
Consolidated Power Monitor views: environment health, governance, capacity, cost, efficiency, report usage, permissions, artifact refreshes and TV panel.
The **Dashboards** area brings together Power Monitor's consolidated views. Instead of browsing the detailed Monitoring, Governance or Audit screens, you get an overview of the Microsoft Fabric / Power BI tenant in one place: capacity health, inventory, access risks, Capacity Units consumption and cost, waste, report adoption and a panel to keep on a TV.
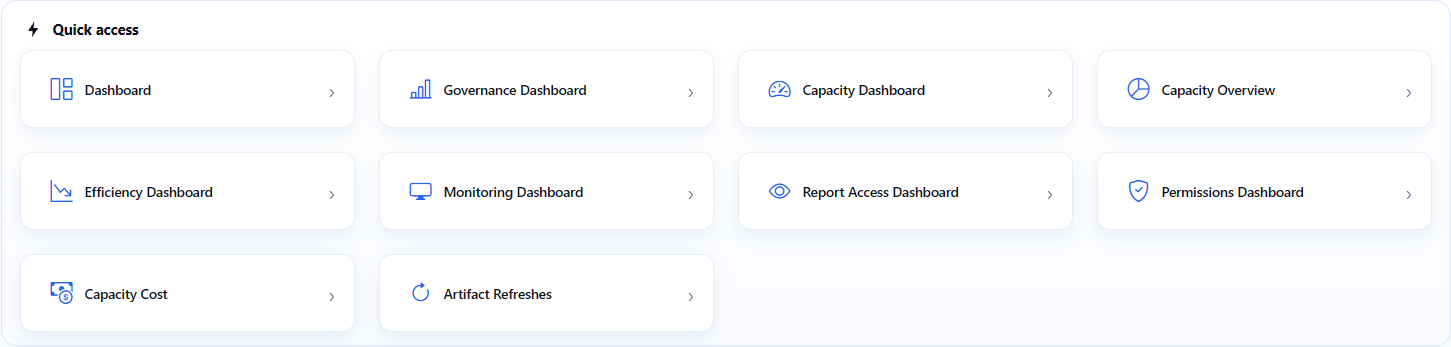
**How to access:** side menu › *Dashboards* (the first area below **Home**), or through the **Quick access** panel on the [Home](/en/power-monitor/pagina-inicial.md) page. Most dashboards are visible to all profiles and respect each user's **workspace scope**; the exceptions are indicated in the table. Administrators can also block specific pages for certain users.
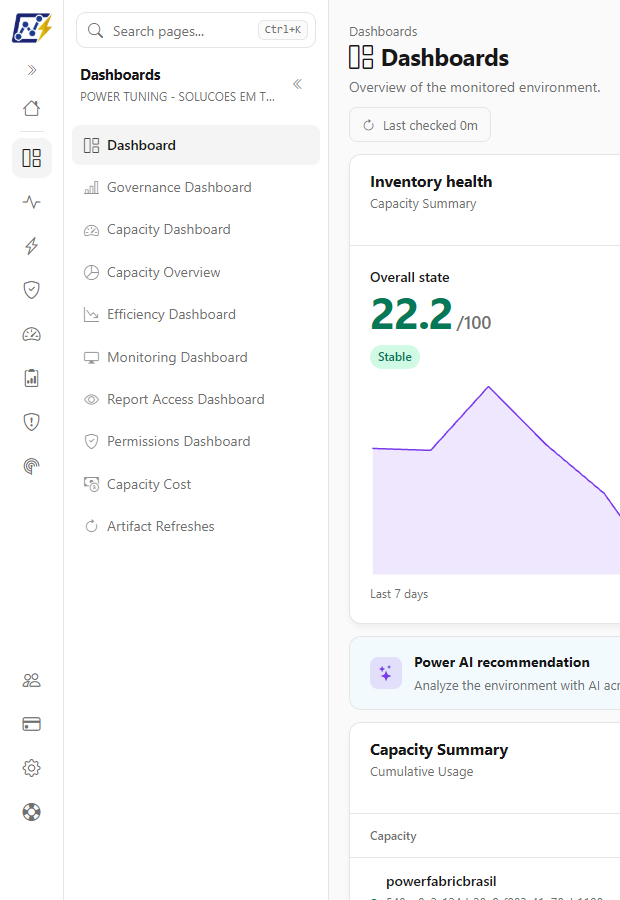
Dashboards area in the side menu
## What it is for
* **Following the day-to-day** without opening several screens: the [Dashboard](/en/power-monitor/dashboards/dashboard-principal.md) and the [Monitoring Dashboard](/en/power-monitor/dashboards/dashboard-de-monitoramento.md) show what needs attention right now.
* **Presenting results** to managers: the governance, capacity, cost and permissions dashboards summarize the environment in indicators and charts, several of them with export.
* **Finding waste and risk:** report and model efficiency, cost per workspace and user, external access and excessive permissions.
## Available dashboards
| Dashboard | What it is for | Access |
| ------------------------------------------------------------------------------------- | ---------------------------------------------------------------------------------------------------------------------------------------------------------------------------------------------------------------------------------------------------------------------- | ---------------------------------------------------------------- |
| [Dashboard](/en/power-monitor/dashboards/dashboard-principal.md) | Daily starting point: overall capacity state, monitored inventory, recent alerts, capacity summary, latest scans, artifact distribution and operational indicators (incidents, failures, time to resolve, anomalies, success rate, monitors and collection freshness). | Everyone |
| [Governance Dashboard](/en/power-monitor/dashboards/dashboard-de-governanca.md) | Inventory of workspaces and artifacts, access and administration, external accounts, infrastructure, classification, criticality, coverage, models near the limit, business areas, inventory evolution and a workspace list with drill-down. | Everyone |
| [Capacity Dashboard](/en/power-monitor/dashboards/dashboard-de-capacidade.md) | Capacity Units consumption today × yesterday, health and executive alerts, usage curve with the SKU limit, consumer rankings, consumption by item type, weekly heatmap and operation drill-down. | Everyone (Refresh button: administrators) |
| [Capacity Overview](/en/power-monitor/dashboards/visao-geral-de-capacidades.md) | Distribution of workspaces by region, SKU and configuration; identities per capacity; 12-month growth; artifacts and utilization per capacity; governance signals. | Everyone |
| [Efficiency Dashboard](/en/power-monitor/dashboards/dashboard-de-eficiencia.md) | Classifies reports and models as Dead artifact, Phantom refresh, Over-refreshing or Healthy and shows the wasted Capacity Units. | Everyone |
| [Monitoring Dashboard](/en/power-monitor/dashboards/dashboard-de-monitoramento.md) | TV-mode panel that shows, with automatic rotation, only what is wrong right now. | Everyone |
| [Report Access Dashboard](/en/power-monitor/dashboards/dashboard-de-visualizacoes.md) | Report accesses: KPIs, monthly evolution, peak times, geography, users and most, least and not accessed reports. | According to the page access of the profile (see the note below) |
| [Permissions Dashboard](/en/power-monitor/dashboards/dashboard-de-permissoes.md) | Aggregated view of who has access to what: identities, access levels, risk findings, environment × workload matrix, groups and external accounts. | According to the page access of the profile (see the note below) |
| [Capacity Cost](/en/power-monitor/dashboards/custo-de-capacidade.md) | Actual cost of the capacities in Azure, reservations, estimated allocation by workspace, item and user, points of attention and cost alerts. | Everyone (alerts and scan: administrators) |
| [Artifact Refreshes](/en/power-monitor/dashboards/atualizacoes-de-artefatos.md) | How many refreshes of semantic models and Fabric jobs ran and failed, what stopped refreshing and the most frequent error causes. | Everyone |
{% hint style="info" %}
The **Report Access Dashboard** and the **Permissions Dashboard** show the behavior and access of each person, so they are not open to all profiles by default. They are **no longer Administrator-only**: who sees them is defined by the page access of each user's profile (the **Audit** profile comes with both screens enabled, and the **Member** profile comes with them blocked). Administrators always have access. See [Users](/en/power-monitor/usuarios.md).
{% endhint %}
### Which dashboard to use
| Question | Dashboard |
| ------------------------------------------------------ | -------------------------------------------------------------------------------------------------------------------------------------------------------------------- |
| Is everything OK in the environment today? | [Dashboard](/en/power-monitor/dashboards/dashboard-principal.md) |
| Is any problem happening right now (TV view)? | [Monitoring Dashboard](/en/power-monitor/dashboards/dashboard-de-monitoramento.md) |
| Who has access to what and where are the risks? | [Governance Dashboard](/en/power-monitor/dashboards/dashboard-de-governanca.md) and [Permissions Dashboard](/en/power-monitor/dashboards/dashboard-de-permissoes.md) |
| What is consuming the capacity? | [Capacity Dashboard](/en/power-monitor/dashboards/dashboard-de-capacidade.md) |
| How is the environment distributed across capacities? | [Capacity Overview](/en/power-monitor/dashboards/visao-geral-de-capacidades.md) |
| How much does each capacity, workspace or user cost? | [Capacity Cost](/en/power-monitor/dashboards/custo-de-capacidade.md) |
| Where are Capacity Units being wasted? | [Efficiency Dashboard](/en/power-monitor/dashboards/dashboard-de-eficiencia.md) |
| How many refreshes failed and what stopped refreshing? | [Artifact Refreshes](/en/power-monitor/dashboards/atualizacoes-de-artefatos.md) |
| Which reports are used and by whom? | [Report Access Dashboard](/en/power-monitor/dashboards/dashboard-de-visualizacoes.md) |
## Features
### Dashboards area menu
**What it is:** the panel that opens next to the main menu when you click **Dashboards**, with the list of dashboards in the order of the table above.
**What it is for:** switching between dashboards without going back to Home.
**How to use:**
1. In the main menu, click **Dashboards**. The area panel opens with the list of dashboards.
2. Click the desired dashboard (for example, **Capacity Dashboard**). The open item is highlighted.
3. If a dashboard does not appear in the menu, it has been blocked for your user (a common case for the **Report Access Dashboard** and the **Permissions Dashboard**, depending on the profile).
**Rules:** the **Capacity Dashboard**, the **Capacity Overview** and **Capacity Cost** also appear in the **Capacities** area of the menu. It is the same screen, with the same data. Menu details in [Overview](/en/power-monitor/visao-geral.md).
### Quick access on Home
**What it is:** the **Quick access** panel on the [Home](/en/power-monitor/pagina-inicial.md) page, with a large card for each dashboard your user can open.
**What it is for:** opening a dashboard right after signing in, with one click.
Quick access panel on Home
**How to use:**
1. Click **Home** (house icon) at the top of the main menu.
2. In the **Quick access** panel, click the dashboard card.
### Export
**What it is:** buttons that save the dashboard as a file. The formats vary by screen:
| Dashboard | Formats |
| ----------------------------------------------------------------------------------- | ----------------------------------------------------------------- |
| Governance Dashboard, Capacity Dashboard, Permissions Dashboard, Artifact Refreshes | **Export PDF** and **Export PNG** (the page) |
| Report Access Dashboard | **Export**: **CSV** or **JSON** (data) |
| Capacity Cost | **Export**: **CSV** or **JSON** (tab data) or **PNG** (tab image) |
| Dashboard, Capacity Overview, Efficiency Dashboard, Monitoring Dashboard | No export |
**What it is for:** attaching the overview to a monthly report, a presentation or a support ticket.
**How to use:**
1. Apply the filters for the desired scope.
2. On dashboards with **Export PDF** / **Export PNG**, click the format. On dashboards with the **Export** button, choose **CSV**, **JSON** or, when available, **PNG**.
3. Before sharing files with people's names and emails, use **Hide data** when the screen offers this option (Permissions Dashboard and Report Access Dashboard).
The details of each export are on the dashboard's page.
{% hint style="warning" %}
Exported files may contain names of workspaces, items and people in your organization. Be careful when sharing them outside the company.
{% endhint %}
### AI analysis
**What it is:** buttons that ask Power AI for a reading of the current scope: **View recommendations** (the **Power AI recommendation** banner on the [Dashboard](/en/power-monitor/dashboards/dashboard-principal.md)) and **Explain with AI** ([Capacity Dashboard](/en/power-monitor/dashboards/dashboard-de-capacidade.md) and [Efficiency Dashboard](/en/power-monitor/dashboards/dashboard-de-eficiencia.md)).
**What it is for:** getting a natural-language diagnosis, with recommendations, without cross-referencing the numbers manually.
**How to use:**
1. Confirm with an administrator that an AI provider is configured in *Settings › AI*.
2. Apply the filters and click **View recommendations** (Dashboard) or **Explain with AI** (Capacity Dashboard and Efficiency Dashboard).
3. Read the analysis and check the numbers before acting.
**Rules:** the analysis uses the provider configured by the organization and consumes the organization's and the user's AI spending limits. If the button is disabled, hover over it to see the reason. See also the [AI Assistant](/en/power-monitor/assistente-de-ia.md).
## Rules and behavior
* **Time zone:** "today", days and hours are displayed in the organization's time zone, unless otherwise indicated on each dashboard.
* **Workspace scope:** inventory, artifact and access data respect the workspaces the user can see. Organization-wide resources, such as capacities and gateways, appear for everyone. Each page details what is filtered.
* **Monitored capacities:** the consumption and cost dashboards consider only capacities with monitoring enabled.
### Key concepts
| Concept | Definition |
| --------------------------- | -------------------------------------------------------------------------------------------------------------------------------------------------------------------------------------------------- |
| **Capacity Units (CU)** | Microsoft Fabric's unit of compute capacity. Consumption is measured in **Capacity Units (s)** (CU × seconds). An F64 SKU, for example, provides 64 Capacity Units per second. |
| **Interactive** | Operations triggered directly by users (opening a report, applying a filter, DAX queries). |
| **Background** | Background operations (semantic model refreshes, pipelines, notebooks). In Fabric, the cost of these operations is smoothed over 24 hours. |
| **Timepoint** | A 30-second sample of a capacity's usage, published by the Microsoft Fabric Capacity Metrics App. |
| **Monitored capacity** | Capacity with monitoring enabled in *Settings › Monitoring*. The consumption and cost dashboards consider only these capacities. |
| **Dead artifact** | Report or semantic model with no access and no Capacity Units consumption in the period. |
| **Phantom refresh** | Report or semantic model that refreshes and/or consumes Capacity Units, but had no access in the period. |
| **Over-refreshing** | Artifact with a number of refreshes greater than or equal to 2 × the days in the period and at most 2 accesses. |
| **Actual × estimated cost** | The **actual** cost is the amount charged by Azure for the capacity; the **estimated** cost is the allocation of that cost by workspace, item or user, proportional to Capacity Units consumption. |
## Frequently asked questions
I don't see the Report Access Dashboard (or the Permissions Dashboard) in the menu. Why?
These screens show the usage and access profile of each person in the organization, and access to them is controlled by the page access of the user's profile. If the page is blocked for your user, the item does not appear in the menu or in Quick access on Home. Ask an administrator to review your profile in [Users](/en/power-monitor/usuarios.md).
What is the difference between the Dashboard and the Monitoring Dashboard?
The [Dashboard](/en/power-monitor/dashboards/dashboard-principal.md) is a general overview for consultation (capacity state, inventory, alerts, scans). The [Monitoring Dashboard](/en/power-monitor/dashboards/dashboard-de-monitoramento.md) is designed to stay open on a TV and shows, with automatic rotation, only what is wrong at the moment.
Why does my colleague see different numbers than I do on the same dashboard?
The dashboards respect each user's **workspace scope**. Users with visibility restricted to some workspaces see only the data for those workspaces. Numbers for organization-wide resources, such as capacities and gateways, are the same for everyone.
## Related pages
* [Home](/en/power-monitor/pagina-inicial.md)
* [Overview](/en/power-monitor/visao-geral.md)
* [Monitoring](/en/power-monitor/monitoramento.md)
* [Governance](/en/power-monitor/governanca.md)
* [Audit](/en/power-monitor/auditoria.md)
* [AI Assistant](/en/power-monitor/assistente-de-ia.md)
---
# Agent Instructions
This documentation is published with GitBook. GitBook is the documentation platform designed so that both humans and AI agents can read, navigate, and reason over technical content effectively. Learn more at gitbook.com.
## Querying This Documentation
If you need additional information that is not directly available in this page, you can query the documentation by asking a question.
Perform an HTTP GET request on the following URL with the `ask` and `goal` query parameters:
```
GET https://docs.powermonitor.com.br/en/power-monitor/dashboards.md?ask=&goal=
```
`ask` is the immediate question: it should be specific, self-contained, and written in natural language.
`goal` is what the user is ultimately trying to achieve, the reason they need the answer. Sharing it helps GitBook give you a better, more relevant answer. A goal is most helpful when it describes the outcome the user wants rather than restating the question. For example, with `ask=how do I create an API token`, a goal like `automate deployments from our CI pipeline` lets GitBook tailor the answer to that use case.
The response will contain a direct answer to the question and relevant excerpts and sources from the documentation.
Use this mechanism when the answer is not explicitly present in the current page, you need clarification or additional context, or you want to retrieve related documentation sections.