> For the complete documentation index, see [llms.txt](https://docs.powermonitor.com.br/llms.txt). Markdown versions of documentation pages are available by appending `.md` to page URLs; this page is available as [Markdown](https://docs.powermonitor.com.br/en/power-monitor/dashboards/atualizacoes-de-artefatos.md).
# Artifact Refreshes
Track how many semantic model and Fabric job refreshes ran and failed, how they compare with the previous period, what stopped refreshing and why it failed.
The **Artifact Refreshes** dashboard brings together, in a single view, the runs of **semantic models** (Power BI refreshes) and **Microsoft Fabric jobs** (Data Pipeline, Copy Job, Notebook and Dataflow Gen2). It answers questions such as: *how many refreshes ran and failed?*, *are we better or worse than in the previous period?*, *what stopped refreshing?* and *why do refreshes fail?*
**How to access:** menu *Dashboards › Artifact Refreshes*. The screen used to be under Monitoring and was rebuilt; the old address keeps working and opens this screen.
The screen is available to **all user profiles**, because the people who follow refreshes are not always administrators. The numbers respect each user's **workspace scope**: someone with visibility restricted to some workspaces sees only the runs of those workspaces. An administrator can block this page for specific users, like any other Power Monitor page (see [Users](/en/power-monitor/usuarios.md)). The data **collection** (the **Run now** button) now lives in [Mapping › Refreshes and Schedules](/en/power-monitor/mapeamento/atualizacoes-e-agendamentos.md), for administrators only.
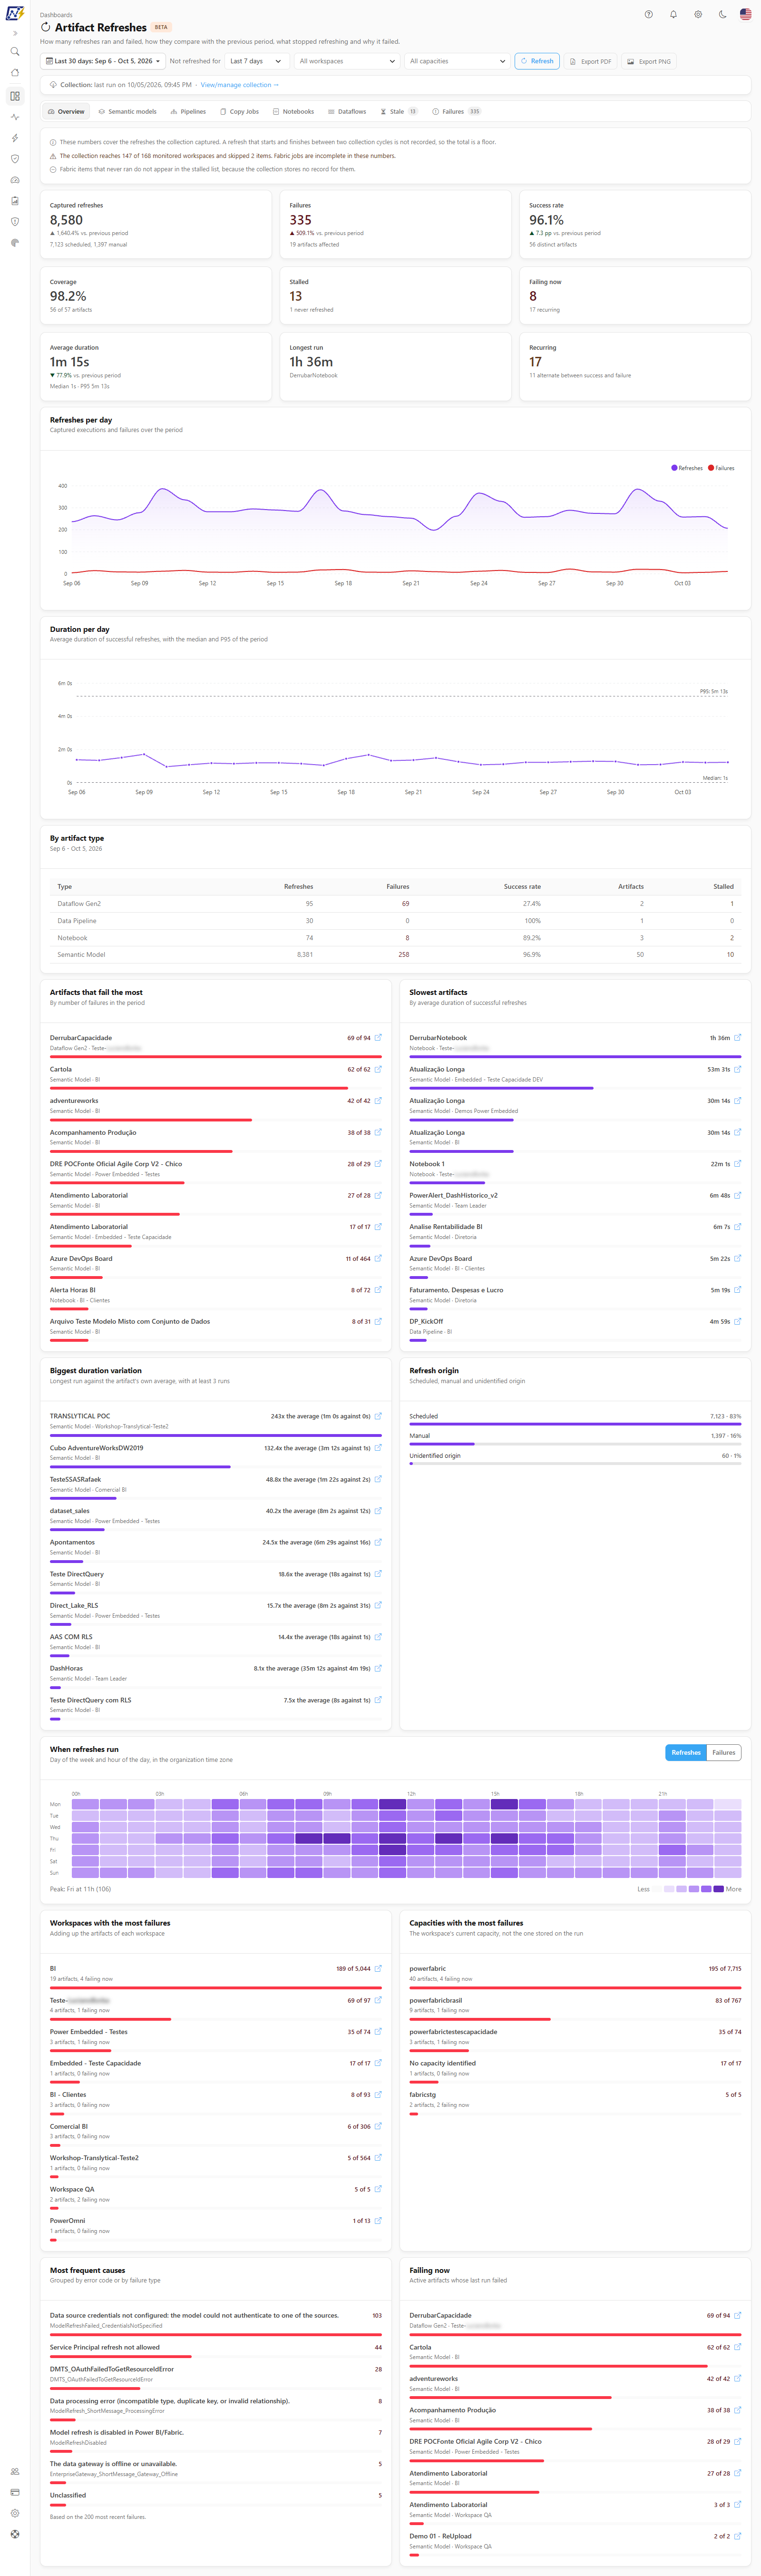
Overview of the Artifact Refreshes dashboard
{% hint style="warning" %}
The screen shows the **beta** badge. It indicates that the numbers depend on collections that do not yet cover the whole environment. Treat the totals as a **floor** (the minimum that actually happened) and always read the collection notice at the top before drawing conclusions.
{% endhint %}
## What it is for
* **Follow the health of refreshes day by day:** captured refreshes, failures, success rate and duration, always compared with the previous period.
* **Discover forgotten or broken artifacts:** the **Stale** tab lists what has had no captured refresh for more than N days, including models that **never** refreshed.
* **Understand the failures:** the **Failures** tab groups the most frequent causes and shows recent failures, with the cause explained.
* **Find patterns:** the heatmap shows on which day and hour refreshes run and fail; the rankings show who fails the most, who is the slowest and who strayed from its own average duration.
* **Validate collection coverage:** the collection notice shows whether Power Monitor can see all monitored workspaces.
## Screen components
### Filters and actions
**What it is:** the row below the title, which applies to **all tabs**.
| Control | What it does |
| -------------------------- | --------------------------------------------------------------------------------------------------------------------------------------------------------------------------------------------------------------------------------------- |
| **Period** (calendar icon) | Chooses the analyzed range: **Yesterday**, **Last 7**, **14**, **30** (default), **60**, **90** or **180 days**, or **Custom** (**From** and **To** fields, up to 366 days, no future dates). Days follow the organization's time zone. |
| **Not refreshed for** | How many days without a refresh make an artifact "stalled": 1, 3, 7 (default), 15 or 30 days. |
| **All workspaces** | Restricts the analysis to one or more workspaces. |
| **All capacities** | Restricts the analysis to the workspaces of one or more capacities. |
| **Refresh** | Rereads the data already collected, without triggering any new collection. Shows **Refreshing** while it loads. |
| PDF and PNG | Export the whole screen. |
Next to the filters, the **Collection** link shows when the collections the screen depends on last ran and, through **View/manage collection →**, leads to the collection screen (only administrators can open that screen).
### Collection notice
**What it is:** the block above the content, always present.
**What it is for:** Power Monitor's collection is incomplete by nature. This notice tells you **what is missing** so you can read the numbers honestly.
| Notice | When it appears | What to do |
| ----------------------------------------------------------------------------------------- | ------------------------------------------------------------------------------------------------------------------ | --------------------------------------------------------------------------------------------------------------------------------------------- |
| *These numbers cover the refreshes the collection captured...* | Always. A refresh that starts and finishes between two collection cycles is not recorded, so the total is a floor. | Nothing: it is a characteristic of the collection. |
| *Fabric item monitoring is turned off...* | Fabric item monitoring is disabled in the organization, so no Fabric job enters the numbers. | Turn monitoring on in Settings. |
| *Fabric item collection has not run yet...* | Monitoring is on, but the first cycle has not finished. | Wait for the automatic cycle or run the collection in [Refreshes and Schedules](/en/power-monitor/mapeamento/atualizacoes-e-agendamentos.md). |
| *We could not verify which workspaces the collection can reach...* | The workspace access check failed, so Fabric job coverage is unknown. | Check the Service Principal permissions. |
| *The collection reaches X of Y monitored workspaces and skipped Z items...* (highlighted) | The Service Principal has no access to part of the monitored workspaces. Fabric jobs are incomplete. | Add the Service Principal to the missing workspaces (see [Governance › Workspaces](/en/power-monitor/governanca/workspaces.md)). |
| *Fabric items that never ran do not appear in the stalled list...* | Always, because the Fabric collection stores no record for an item that never ran. | Nothing. For those items, check the inventory in [Fabric Items](/en/power-monitor/monitoramento/itens-do-microsoft-fabric.md). |
| *The scan hit its row ceiling. These counts are a floor.* | Very large environments. | Reduce the period or use the workspace and capacity filters. |
### Tabs
**What it is:** the tab bar below the filters. The filter applies to all of them.
| Tab | What it shows |
| ------------------------------------------------------------------------------- | ----------------------------------------------------------------------------------------------------------- |
| **Overview** | All artifact types together: KPIs, charts, table by type, rankings, heatmap and failure causes |
| **Semantic models**, **Pipelines**, **Copy Jobs**, **Notebooks**, **Dataflows** | The same view, restricted to one type. The tab numbers are exact for the type (not a slice of the overview) |
| **Stale** | What stopped refreshing (with the total in the tab label) |
| **Failures** | Most frequent causes, what fails now and recent failures (with the total in the tab label) |
Dashboard tabs
Each type tab shows a note about where the data comes from: semantic models are read from Power BI every 15 minutes; pipelines, Copy Jobs, notebooks and Dataflows Gen2 are read from the Fabric job scheduler (Gen1 dataflows belong to Power BI and do not appear here).
### Overview and type tab KPIs
Each KPI shows the **change against the previous period** (of the same length) when there is a comparison base; without one, *No comparable previous period* appears. Hover over the icon of each card to see the explanation.
| KPI | What it shows |
| ---------------------- | ------------------------------------------------------------------------------------------------------------------------------- |
| **Captured refreshes** | Runs captured in the period, with the footer showing how many were scheduled and how many manual |
| **Failures** | Runs that failed (in Fabric, cancelled also counts as a failure), with how many artifacts were affected |
| **Success rate** | Share of captured runs that did not fail, with the number of distinct artifacts |
| **Coverage** | Share of the artifacts known to the scan that had at least one captured refresh in the period |
| **Stalled** | Artifacts with no captured refresh for more days than the *Not refreshed for* value, with how many never refreshed |
| **Failing now** | Active artifacts whose last captured run failed, with how many are recurring |
| **Average duration** | Average of **successful** refreshes with a duration (failures are left out because they tend to end early), with median and P95 |
| **Longest run** | The longest run of the period, whatever its outcome |
| **Recurring** | Artifacts that failed twice or more, with how many alternate between success and failure |
| **Artifacts affected** | Artifacts with at least one failure, and their share among those that ran |
| **Intermittent** | Artifacts that both failed and succeeded in the period |
### Overview charts and tables
* **Refreshes per day:** captured runs and failures over the period.
* **Duration per day:** average duration of successful refreshes, with the median and P95 of the period (computed over the most recent runs when there are many).
* **By artifact type** (overview only): table with **Type**, **Refreshes**, **Failures**, **Artifacts**, **Stalled** and **Success rate**.
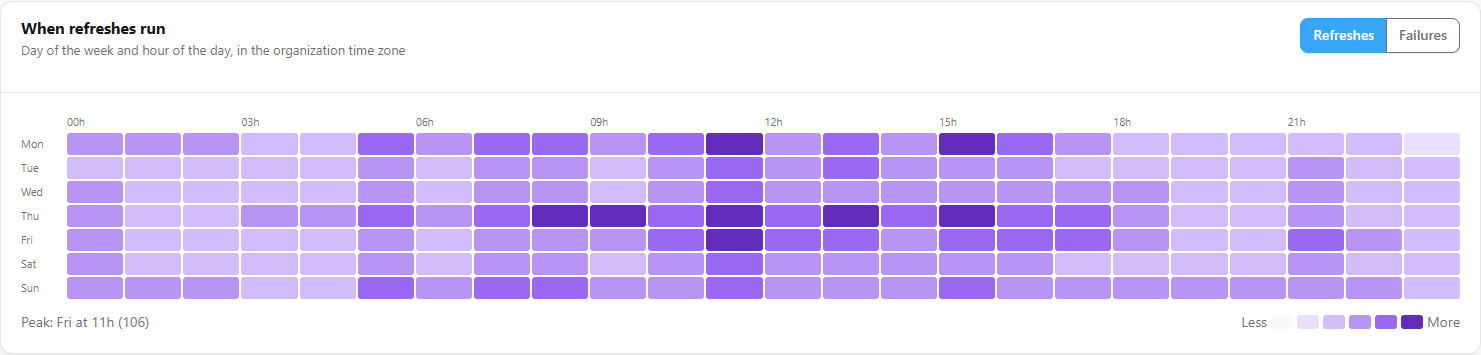
* **When refreshes run:** heatmap of day of the week by hour of the day, in the organization time zone, which can show **Refreshes** or **Failures** (**Measure shown** selector), with the peak indicated.
* **Refresh origin:** scheduled, manual and unidentified origin.
* **Rankings:** **Artifacts that fail the most**, **Slowest artifacts** (by average duration of successful ones), **Biggest duration variation** (longest run against the artifact's own average, with at least 3 runs), **Workspaces with the most failures** and **Capacities with the most failures** (the workspace's current capacity). Where it makes sense, the **Open in the portal** link takes you to the artifact in Power BI or Fabric.
* **Most frequent causes** and **Failing now**: see the Failures tab.
Refresh heatmap
### Stale tab
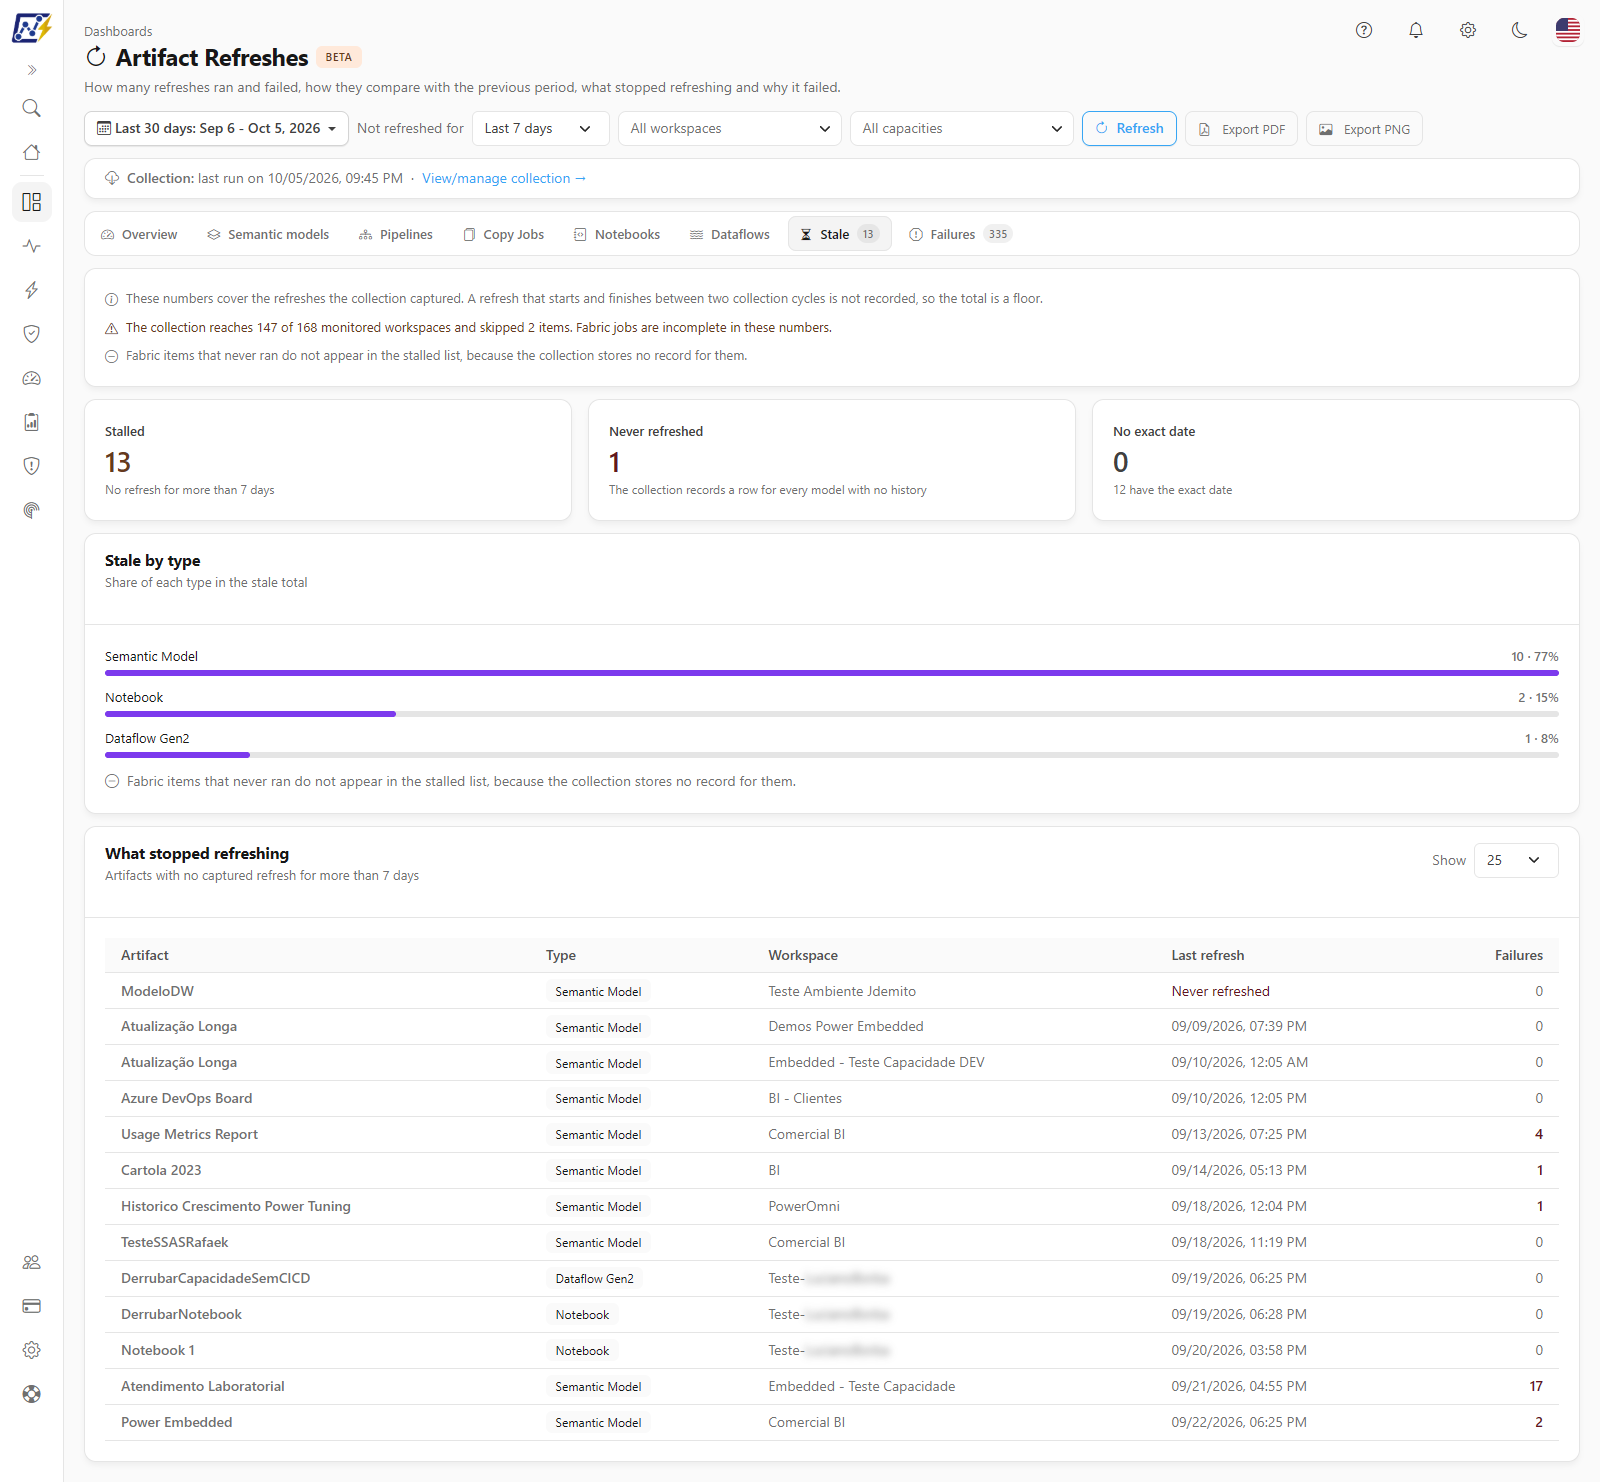
**What it is:** the list of what stopped refreshing, plus three cards: **Stalled** (with the chosen threshold), **Never refreshed** and **No exact date**, and the **Stale by type** distribution.
**What it is for:** finding forgotten, disabled or broken artifacts.
| Column | Meaning |
| ---------------- | ----------------------------------------------------------------------------------- |
| **Artifact** | Name of the semantic model or Fabric item |
| **Type** | Artifact type |
| **Workspace** | The artifact's workspace (or *Unidentified workspace*) |
| **Last refresh** | Date and time of the last captured run, *Never refreshed* or *More than N days ago* |
| **Failures** | The artifact's failures in the period |
**How it works:** the **Show** field (10, 25, 50 or 100; default 25) limits the number of rows and the screen warns *Showing X of Y*. **No exact date** are artifacts whose last refresh was before the scan's reading window (at least 30 days, and more when the chosen period or threshold are larger): they are known to be stalled, but the exact date is not known.
Stale tab
### Failures tab
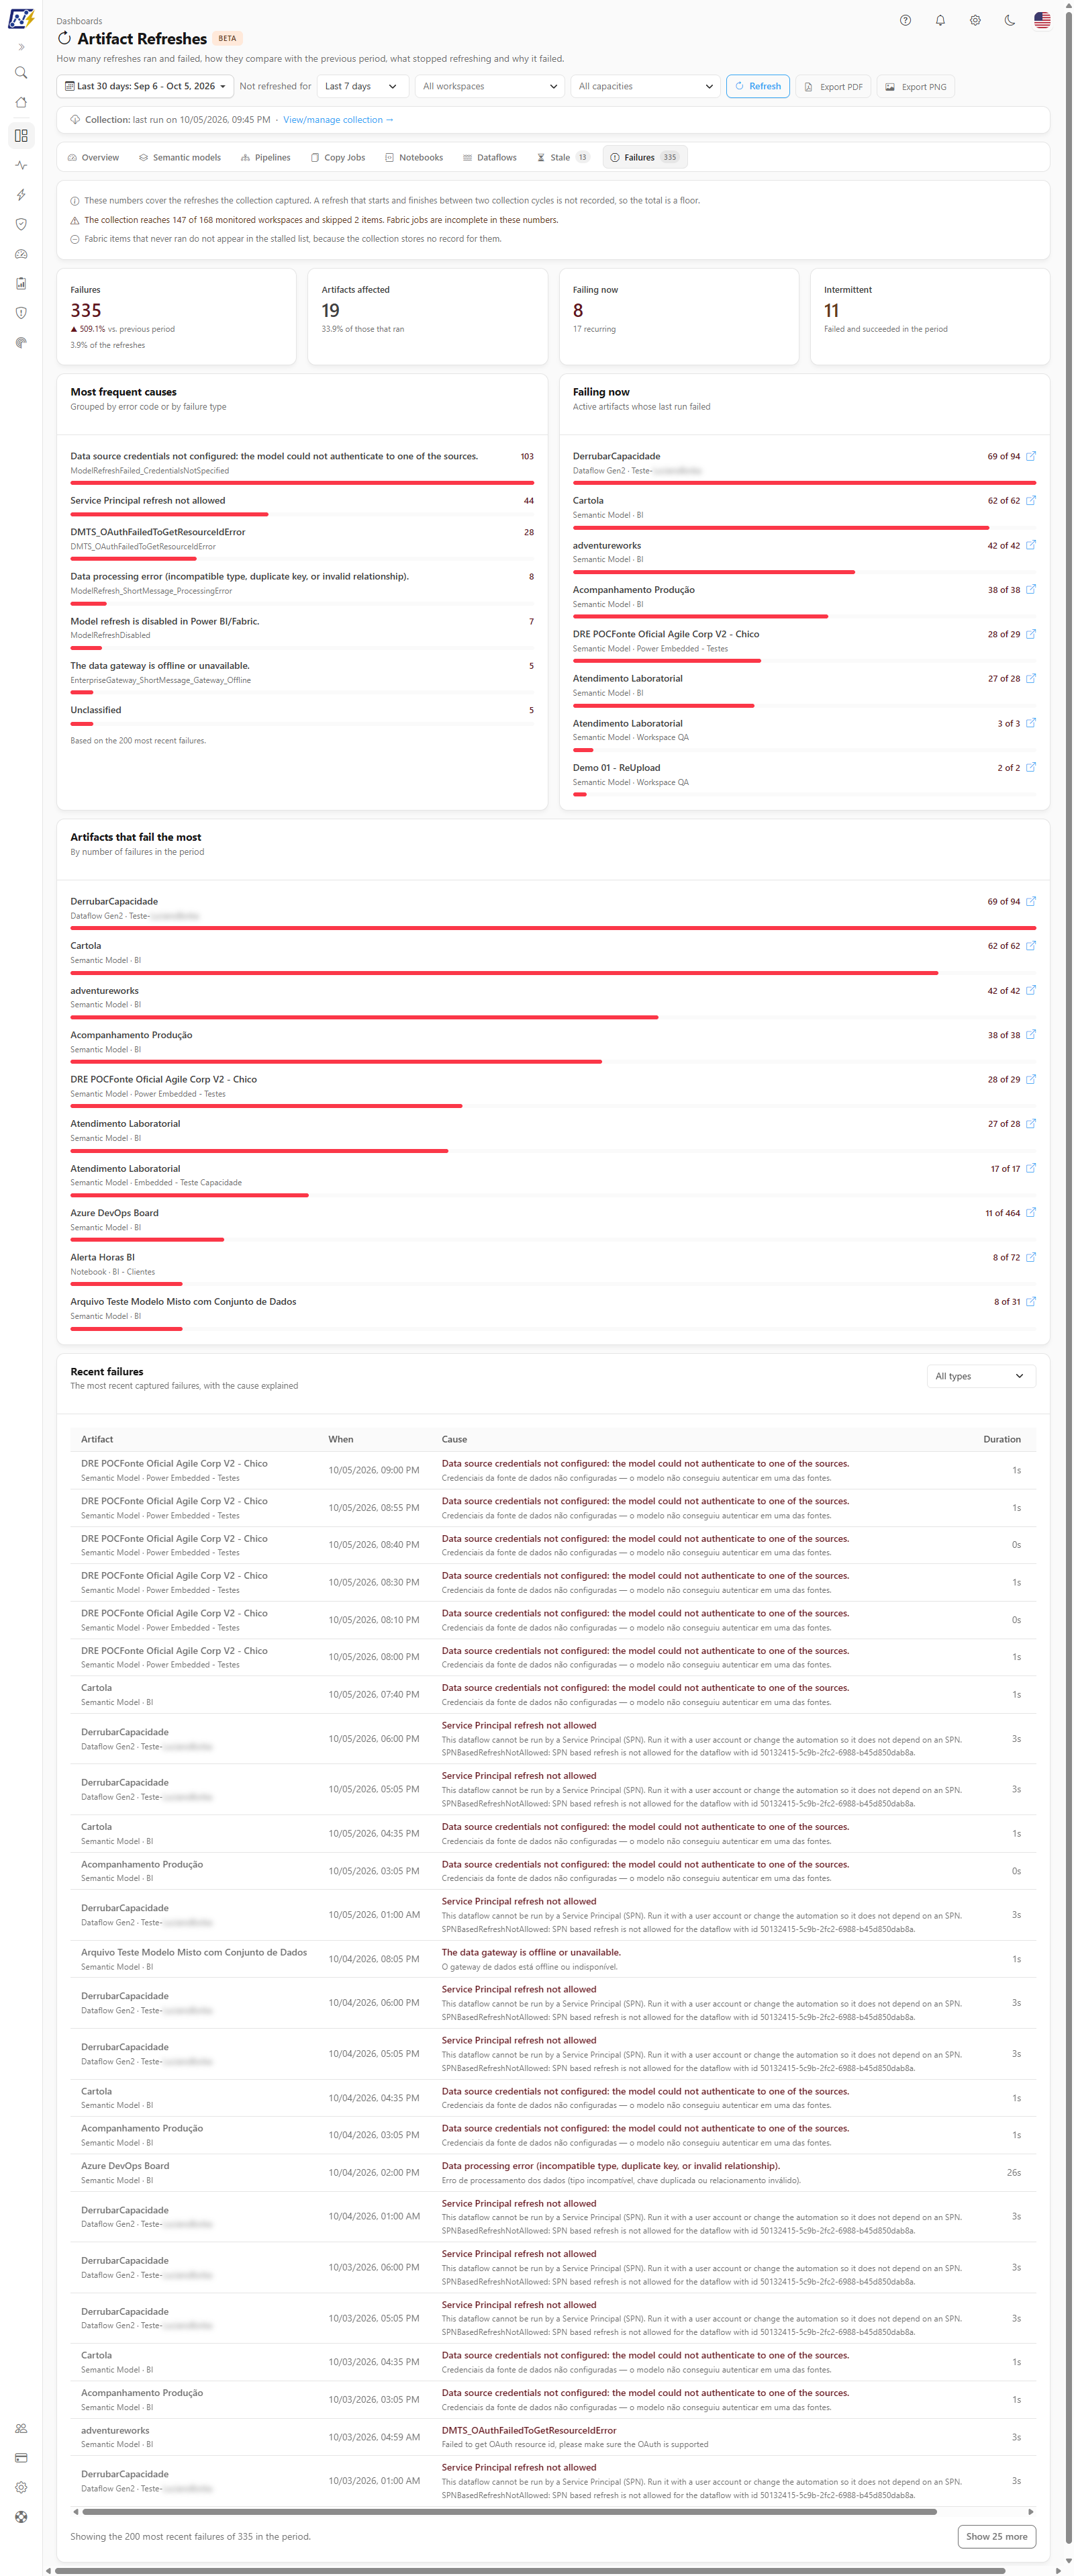
**What it is:** four KPIs at the top (**Failures**, **Artifacts affected**, **Failing now** and **Intermittent**, with the same comparison against the previous period), the **Most frequent causes** (grouped by error code or failure type), **Failing now**, **Artifacts that fail the most** and the **Recent failures** table.
**What it is for:** understanding **why** refreshes fail and prioritizing the fix.
| Recent failures column | Meaning |
| ---------------------- | ------------------------------------------------------------------------------------ |
| **Artifact** | Artifact name |
| **When** | Date and time of the failure |
| **Cause** | Cause explained in plain language; the original text remains available in the detail |
| **Duration** | How long the run lasted |
| **Origin** | Scheduled, manual or unidentified |
**How to use:** use **Filter by type** to see only one type, and **Show more** to extend the list. The screen shows *Showing the X most recent failures of Y in the period*: the most frequent causes are computed over those most recent failures, and the ones Power Monitor cannot explain appear as *Unclassified* instead of getting an invented cause.
Failures tab
## Rules and behavior
### Where the data comes from
| Source | Types covered | Automatic collection frequency |
| --------------------------------------------------------- | ------------------------------------------------ | ------------------------------ |
| Semantic model refreshes (Power BI administration APIs) | Semantic Model | Every 15 minutes |
| Fabric job runs | Data Pipeline, Copy Job, Notebook, Dataflow Gen2 | Every 2 hours |
| Fabric item schedules (used only for the coverage notice) | n/a | Every 6 hours |
### When an artifact is considered "stalled"
An artifact is "stalled" when it has **no captured refresh** within the number of days chosen in **Not refreshed for**, or when the collection knows it **never** refreshed (the case of semantic models with no history). Fabric items that never ran do not appear, because the collection stores no record for them.
### Other rules
* **Comparison with the previous period.** The previous period has the same length and ends the day before the start of the chosen period. For very long periods (when the period and the previous one together would exceed 366 days), the comparison is not computed and the KPIs show *No comparable previous period*.
* **Recurring and intermittent.** Recurring failed twice or more; intermittent had both a failure and a success in the same period.
* **Failures and duration.** Failed runs are left out of the average duration and the median.
* **Capacity.** Rankings by capacity use the workspace's **current** capacity, not the one stored on the run.
* **Workspace filter and scope.** The workspace and capacity filters add to your user's workspace scope.
* **No collection here.** The **Refresh** button only rereads data already collected. To collect again, use the collection screen (administrators).
## Step by step: common scenarios
### Find out what stopped refreshing
{% stepper %}
{% step %}
Open *Dashboards › Artifact Refreshes* and read the collection notice.
{% endstep %}
{% step %}
In **Not refreshed for**, choose the threshold (for example, 7 days) and open the **Stale** tab.
{% endstep %}
{% step %}
Review the table: check the ones that **never refreshed** and those with **No exact date**.
{% endstep %}
{% step %}
Open the artifact in [Semantic Models](/en/power-monitor/monitoramento/modelos-semanticos.md) or [Fabric Items](/en/power-monitor/monitoramento/itens-do-microsoft-fabric.md) to see its history and reactivate the schedule.
{% endstep %}
{% endstepper %}
### Investigate an increase in failures
{% stepper %}
{% step %}
On the **Overview**, compare **Failures** and **Success rate** with the previous period.
{% endstep %}
{% step %}
Look at the heatmap: do the failures concentrate on a certain day or time?
{% endstep %}
{% step %}
Open the **Failures** tab: the **Most frequent causes** tell you whether the problem is credentials, capacity, timeout and so on.
{% endstep %}
{% step %}
Use **Filter by type** or the workspace and capacity filters to isolate the source.
{% endstep %}
{% endstepper %}
## Frequently asked questions
Why is the total of refreshes lower than I expected?
The collection captures the state of refreshes at each cycle (15 minutes for semantic models, 2 hours for Fabric jobs). A refresh that starts and finishes between two cycles is not recorded, so the totals are a **floor**.
Fabric jobs do not appear in the numbers.
Check the collection notice: Fabric item monitoring may be off, the collection may not have run yet, or the Service Principal may lack access to part of the workspaces. Gen1 dataflows belong to Power BI and are not included.
An artifact I know does not refresh does not appear under Stale.
Fabric items that never ran are not listed, because the collection stores no record for them. Check the inventory in [Fabric Items](/en/power-monitor/monitoramento/itens-do-microsoft-fabric.md).
Where is the "Collect now" button?
It was moved to [Mapping › Refreshes and Schedules](/en/power-monitor/mapeamento/atualizacoes-e-agendamentos.md) (**Run now** button, administrators only). Here the **Collection** link shows the status of the last run.
## Related pages
* [Semantic Models](/en/power-monitor/monitoramento/modelos-semanticos.md)
* [Fabric Items](/en/power-monitor/monitoramento/itens-do-microsoft-fabric.md)
* [Data Freshness](/en/power-monitor/monitoramento/atualizacao-de-dados.md)
* [Alerts](/en/power-monitor/monitoramento/alertas.md)
* [Mapping › Refreshes and Schedules](/en/power-monitor/mapeamento/atualizacoes-e-agendamentos.md)
* [Dashboards (overview)](/en/power-monitor/dashboards.md)
---
# Agent Instructions
This documentation is published with GitBook. GitBook is the documentation platform designed so that both humans and AI agents can read, navigate, and reason over technical content effectively. Learn more at gitbook.com.
## Querying This Documentation
If you need additional information that is not directly available in this page, you can query the documentation by asking a question.
Perform an HTTP GET request on the following URL with the `ask` and `goal` query parameters:
```
GET https://docs.powermonitor.com.br/en/power-monitor/dashboards/atualizacoes-de-artefatos.md?ask=&goal=
```
`ask` is the immediate question: it should be specific, self-contained, and written in natural language.
`goal` is what the user is ultimately trying to achieve, the reason they need the answer. Sharing it helps GitBook give you a better, more relevant answer. A goal is most helpful when it describes the outcome the user wants rather than restating the question. For example, with `ask=how do I create an API token`, a goal like `automate deployments from our CI pipeline` lets GitBook tailor the answer to that use case.
The response will contain a direct answer to the question and relevant excerpts and sources from the documentation.
Use this mechanism when the answer is not explicitly present in the current page, you need clarification or additional context, or you want to retrieve related documentation sections.