> For the complete documentation index, see [llms.txt](https://docs.powermonitor.com.br/llms.txt). Markdown versions of documentation pages are available by appending `.md` to page URLs; this page is available as [Markdown](https://docs.powermonitor.com.br/en/power-monitor/dashboards/custo-de-capacidade.md).

# Capacity Cost

Actual cost of Fabric and Power BI Embedded capacities read from Azure Cost Management, with reservations, estimated allocation by workspace, item and user, points of attention and cost alerts.

**Capacity Cost** brings into Power Monitor the **actual** cost of Microsoft Fabric and Power BI Embedded capacities billed in Azure, broken down by day and by operation (meter), together with capacity **reservations**. Based on this cost and on the Capacity Units (CU) consumption of each item, the screen also **estimates** how much each workspace, item and user costs, points out the biggest increases and decreases and projects the next period. It is inspired by the *Fabric Cost Analysis* report of Microsoft's FUAM accelerator.

**How to access:** menu *Dashboards › Capacity Cost*. The same screen also appears in the *Capacities* menu domain. Reading is open to all user profiles; the **Cost Scan** and **Cost Alert** buttons and the creation/editing of alerts are exclusive to **administrators**.

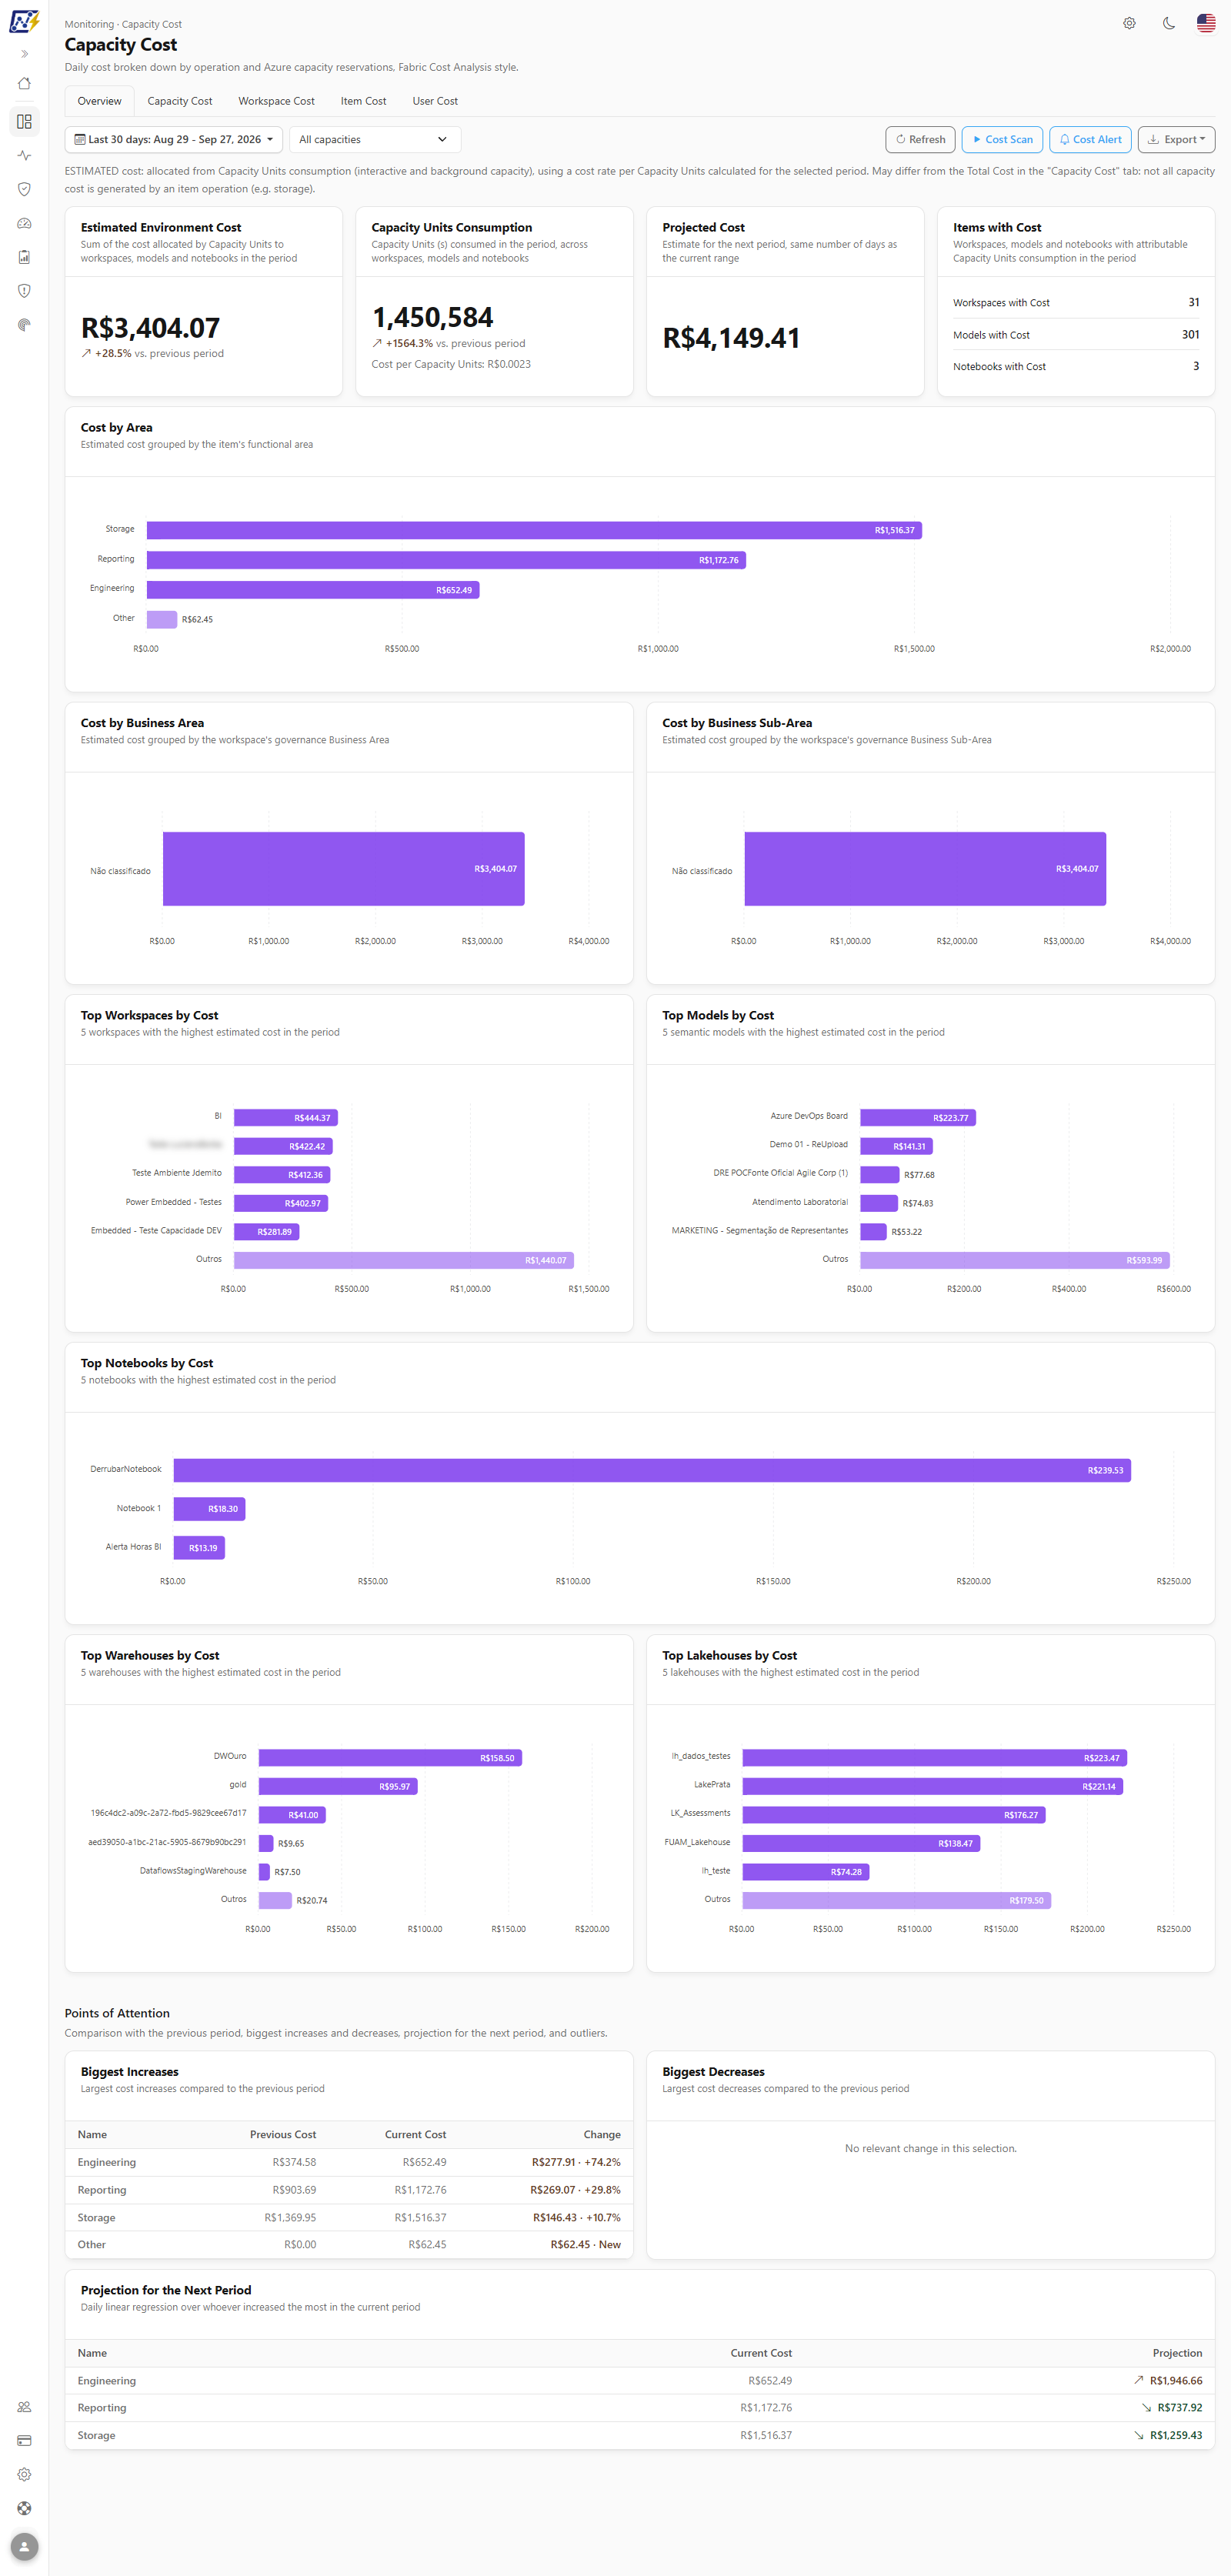
<figure><picture><source srcset="/files/JHhJKhmwxCkYNbI47XCx" media="(prefers-color-scheme: dark)"><img src="https://3938213054-files.gitbook.io/~/files/v0/b/gitbook-x-prod.appspot.com/o/spaces%2FH2bFRBmIfyK3kwVKbldl%2Fuploads%2Fgit-blob-86962ab32fa198a8fc80d199c9013535d307be07%2Fpm-dashboards-custo-capacidade-en.png?alt=media" alt="Capacity Cost, Overview tab, with estimated cost KPIs and rankings by workspace and item"></picture><figcaption><p>Capacity Cost: Overview tab</p></figcaption></figure>

## What it is for

* **Fabric/Power BI FinOps:** seeing how much each capacity cost per day and on which meter (compute, storage etc.) the money was spent.
* **Chargeback/showback:** distributing the capacity cost across workspaces, business areas, items and users, in proportion to Capacity Units consumption.
* **Tracking reservations:** knowing which reservations are active, which capacity they are associated with and when they expire.
* **Detecting deviations early:** receiving an e-mail when a day's cost exceeds the recent average by more than the defined limit.

## Prerequisites

{% hint style="warning" %}
**The screen only shows cost after Power Monitor is granted permission to read Azure costs.** The organization's Service Principal (the same one used in the Power BI/Fabric scans) needs the **Cost Management Reader** role on the **Azure subscriptions** where the capacities are.
{% endhint %}

A Power Monitor administrator grants this permission in *Settings › Additional Permissions*, on the **Capacity Cost** card (or in the additional permissions step of the initial setup):

1. Before any action, the card shows the role that will be assigned, the application and the list of subscriptions found in the organization's capacities.
2. When you click **Grant permissions**, a Microsoft sign-in window opens. The account used must be able to assign roles on the subscription (**Owner** or **User Access Administrator**).
3. After the assignment, Power Monitor tests access with a real query to Cost Management. Propagation in Azure may take a few minutes; the status shows **Waiting for propagation** and is checked automatically until it changes to **Granted**.

Without this permission, the screen appears empty ("No cost in the selected period"). If the account does not have permission to assign roles, ask a subscription Owner to complete the grant (or to assign the role directly in the Azure Portal).

**Reservations:** the list of reservations is read at the Azure *billing account* level. In EA/MCA contracts, the Service Principal may also need the **Reservations Reader** role. In **CSP** contracts (Microsoft Partner Agreement), Microsoft does not make reservation details available to the customer; in that case Power Monitor identifies reservation purchases from Cost Management itself and shows them as "Estimated via Cost Management".

## Features

The screen is organized into five tabs (**Overview**, **Capacity Cost**, **Workspace Cost**, **Item Cost** and **User Cost**) with a filter and action bar shared by all of them. On mobile phones, the tabs become a drop-down selector.

{% hint style="info" %}
**Actual cost × estimated cost.** The **Capacity Cost** tab shows the amount **billed** by Azure. The other tabs show **estimated** amounts, allocated based on Capacity Units consumption. That is why the sum of the items may differ from the total cost: not all capacity cost is generated by item operations (for example, storage).
{% endhint %}

### Period filter

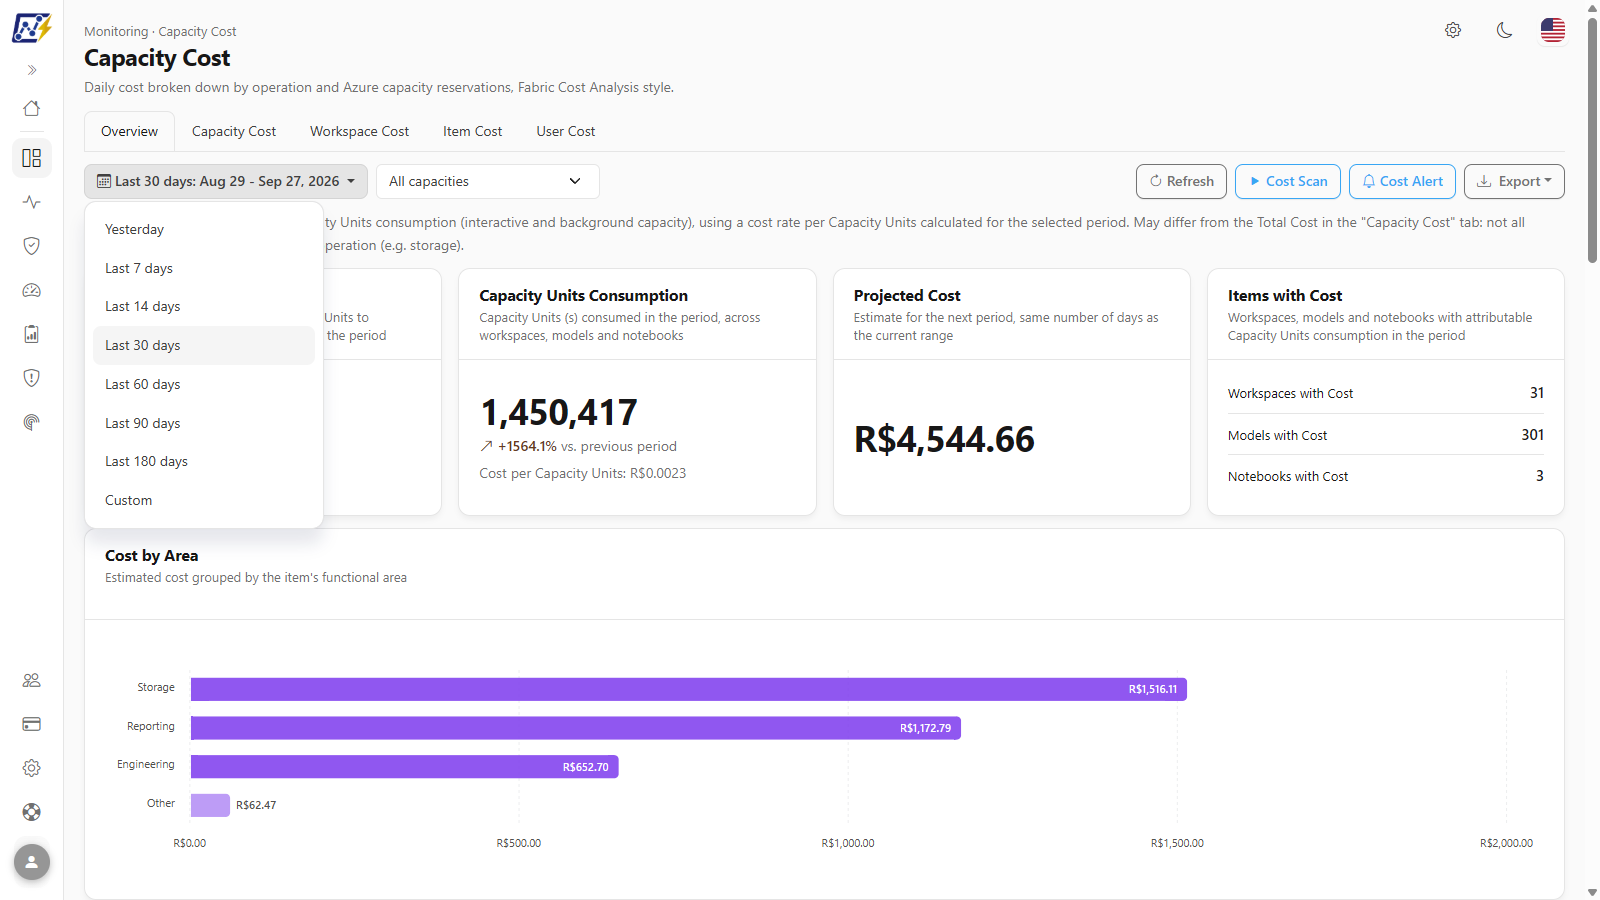
**What it is:** the **Period** drop-down button, which shows the chosen range and the resolved dates.

**What it is for:** analyzing the cost of yesterday, a week, a closing month or a specific range (for example, the month of a migration).

<figure><picture><source srcset="/files/9JxvU97PnEcZGnjQXC0a" media="(prefers-color-scheme: dark)"><img src="https://3938213054-files.gitbook.io/~/files/v0/b/gitbook-x-prod.appspot.com/o/spaces%2FH2bFRBmIfyK3kwVKbldl%2Fuploads%2Fgit-blob-f42e27c928513bfd25af071a9d1f2d2fbd1bd66a%2Fpm-dashboards-custo-capacidade-filtro-periodo-en.png?alt=media" alt="Period menu open with Yesterday, Last 7, 14, 30, 60, 90 and 180 days and Custom"></picture><figcaption><p>Period filter</p></figcaption></figure>

**How to use:**

1. Click the period button (default: **Last 30 days**).
2. Choose **Yesterday**, **Last 7, 14, 30, 60, 90 or 180 days** or **Custom**.
3. In **Custom**, fill in **From** and **To** (up to today's date).

**How it works:** the period applies to all tabs. The **Points of Attention** and the "vs. previous period" variations compare with a period of the same length immediately before the chosen one.

### Capacity filter

**What it is:** the **Capacity** list, with **All capacities** (default) or a specific capacity.

**What it is for:** isolating the cost of one capacity (for example, the production one) or comparing all of them together.

**How to use:** choose the capacity in the list; the current tab is reloaded with the new selection, which also applies to the other tabs.

### Refresh, Cost Scan and Cost Alert

**What it is:** the buttons on the right of the filter bar.

| Button                        | What it does                                                                                                                              | Who sees it    |
| ----------------------------- | ----------------------------------------------------------------------------------------------------------------------------------------- | -------------- |
| **Refresh**                   | Reloads the data of the current tab (shows **Refreshing…** during loading).                                                               | Everyone       |
| **Cost Scan**                 | Opens *Mapping › Capacity and cost › Capacity Cost*, where you track the history of cost collections and can run an immediate collection. | Administrators |
| **Cost Alert**                | Opens the **Cost Alerts** page (see below).                                                                                               | Administrators |
| **Hide data** / **Show data** | Masks e-mails and identities on screen and in exported files (CSV, JSON). It is a screen-sharing convenience, not an access control.      | Everyone       |

**What it is for:** seeing freshly collected data, tracking cost collection and configuring deviation warnings.

**How to use (run the first collection without waiting for the daily schedule):** prerequisite: **Administrator** profile and cost permission granted.

1. Click **Cost Scan**. The *Mapping › Capacity and cost › Capacity Cost* screen opens.
2. Click **Run now**. The message *"Cost collection queued. The history updates when it starts."* confirms the request, and the execution appears in the history when it starts.
3. When the execution is **Completed**, go back to Capacity Cost and click **Refresh**.

### Export

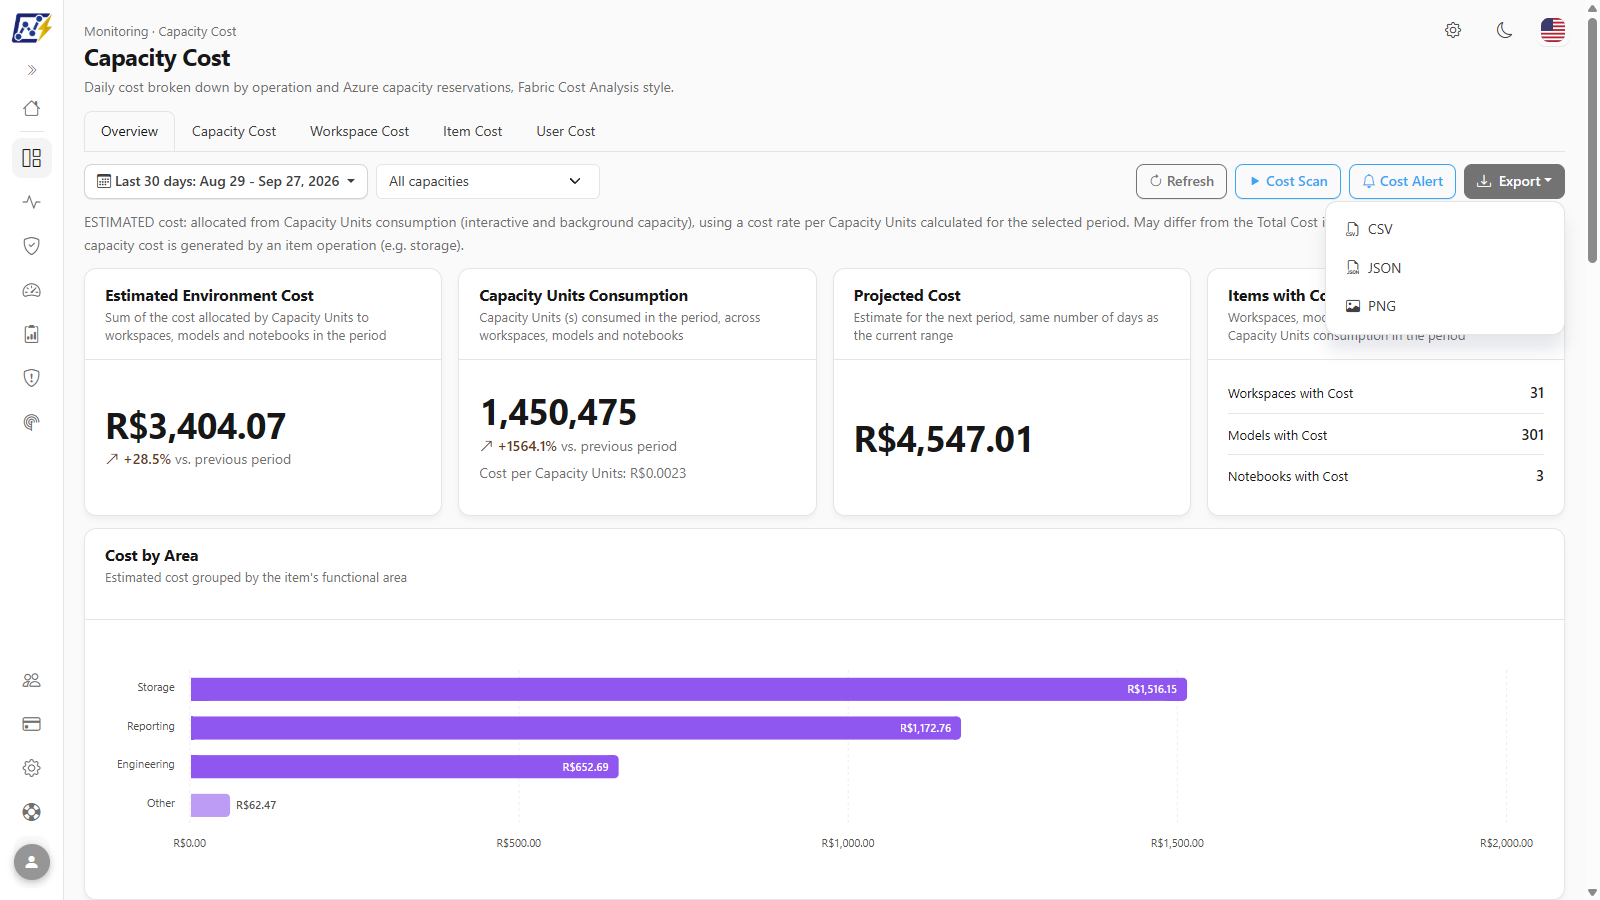
**What it is:** the **Export** menu, with **CSV** and **JSON** (data of the current tab) and **PNG** (image of the current tab).

**What it is for:** taking the numbers to a chargeback spreadsheet or attaching the tab's image to a FinOps report.

<figure><picture><source srcset="/files/fII1TMHmKP7OMuXNwJfO" media="(prefers-color-scheme: dark)"><img src="https://3938213054-files.gitbook.io/~/files/v0/b/gitbook-x-prod.appspot.com/o/spaces%2FH2bFRBmIfyK3kwVKbldl%2Fuploads%2Fgit-blob-84866faa96270e1207c0b2bfd39965849c64614a%2Fpm-dashboards-custo-capacidade-exportar-en.png?alt=media" alt="Export menu open with CSV, JSON and PNG"></picture><figcaption><p>Export menu</p></figcaption></figure>

**How to use:**

1. Open the tab and apply the filters you want.
2. Click **Export** and choose **CSV**, **JSON** or **PNG**. The file is downloaded by the browser.

### Overview: environment indicators

**What it is:** the row of four KPIs on the **Overview** tab, with the estimated cost of the entire environment.

**What it is for:** answering "how much did the environment cost in the period, how much did it consume and how much should it cost in the next period".

<figure><picture><source srcset="/files/oEg2rvpwnLP4txNVCqh6" media="(prefers-color-scheme: dark)"><img src="https://3938213054-files.gitbook.io/~/files/v0/b/gitbook-x-prod.appspot.com/o/spaces%2FH2bFRBmIfyK3kwVKbldl%2Fuploads%2Fgit-blob-657f7566c494eb927e4fa06647b50dbfc9e986d3%2Fpm-dashboards-custo-capacidade-visao-geral-kpis-en.png?alt=media" alt="Estimated Environment Cost, Capacity Units Consumption, Projected Cost and Items with Cost KPIs"></picture><figcaption><p>Overview KPIs</p></figcaption></figure>

| KPI                            | Meaning                                                                                                                                                                                   |
| ------------------------------ | ----------------------------------------------------------------------------------------------------------------------------------------------------------------------------------------- |
| **Estimated Environment Cost** | Sum of the cost allocated by Capacity Units to workspaces, models and notebooks in the period, with the variation **vs. previous period** (period of the same length immediately before). |
| **Capacity Units Consumption** | Capacity Units (s) consumed in the period, with the variation vs. previous period. The footer shows the **Cost per Capacity Units** (rate used in the allocation).                        |
| **Projected Cost**             | Estimate for the next period with the same number of days. Shows "Not enough history to project" when there is not enough data.                                                           |
| **Items with Cost**            | Workspaces, models and notebooks with attributable consumption in the period.                                                                                                             |

### Overview: cost by area and rankings

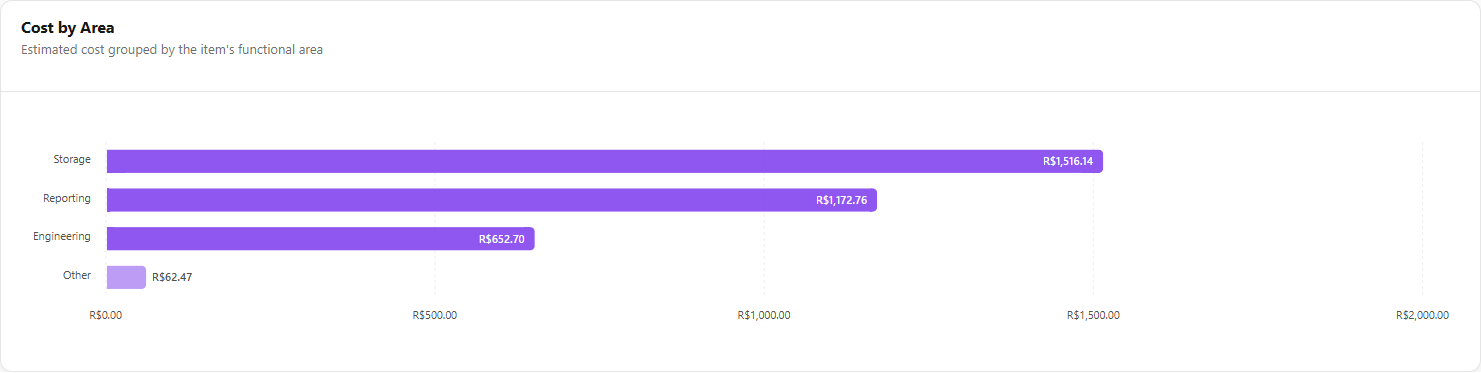
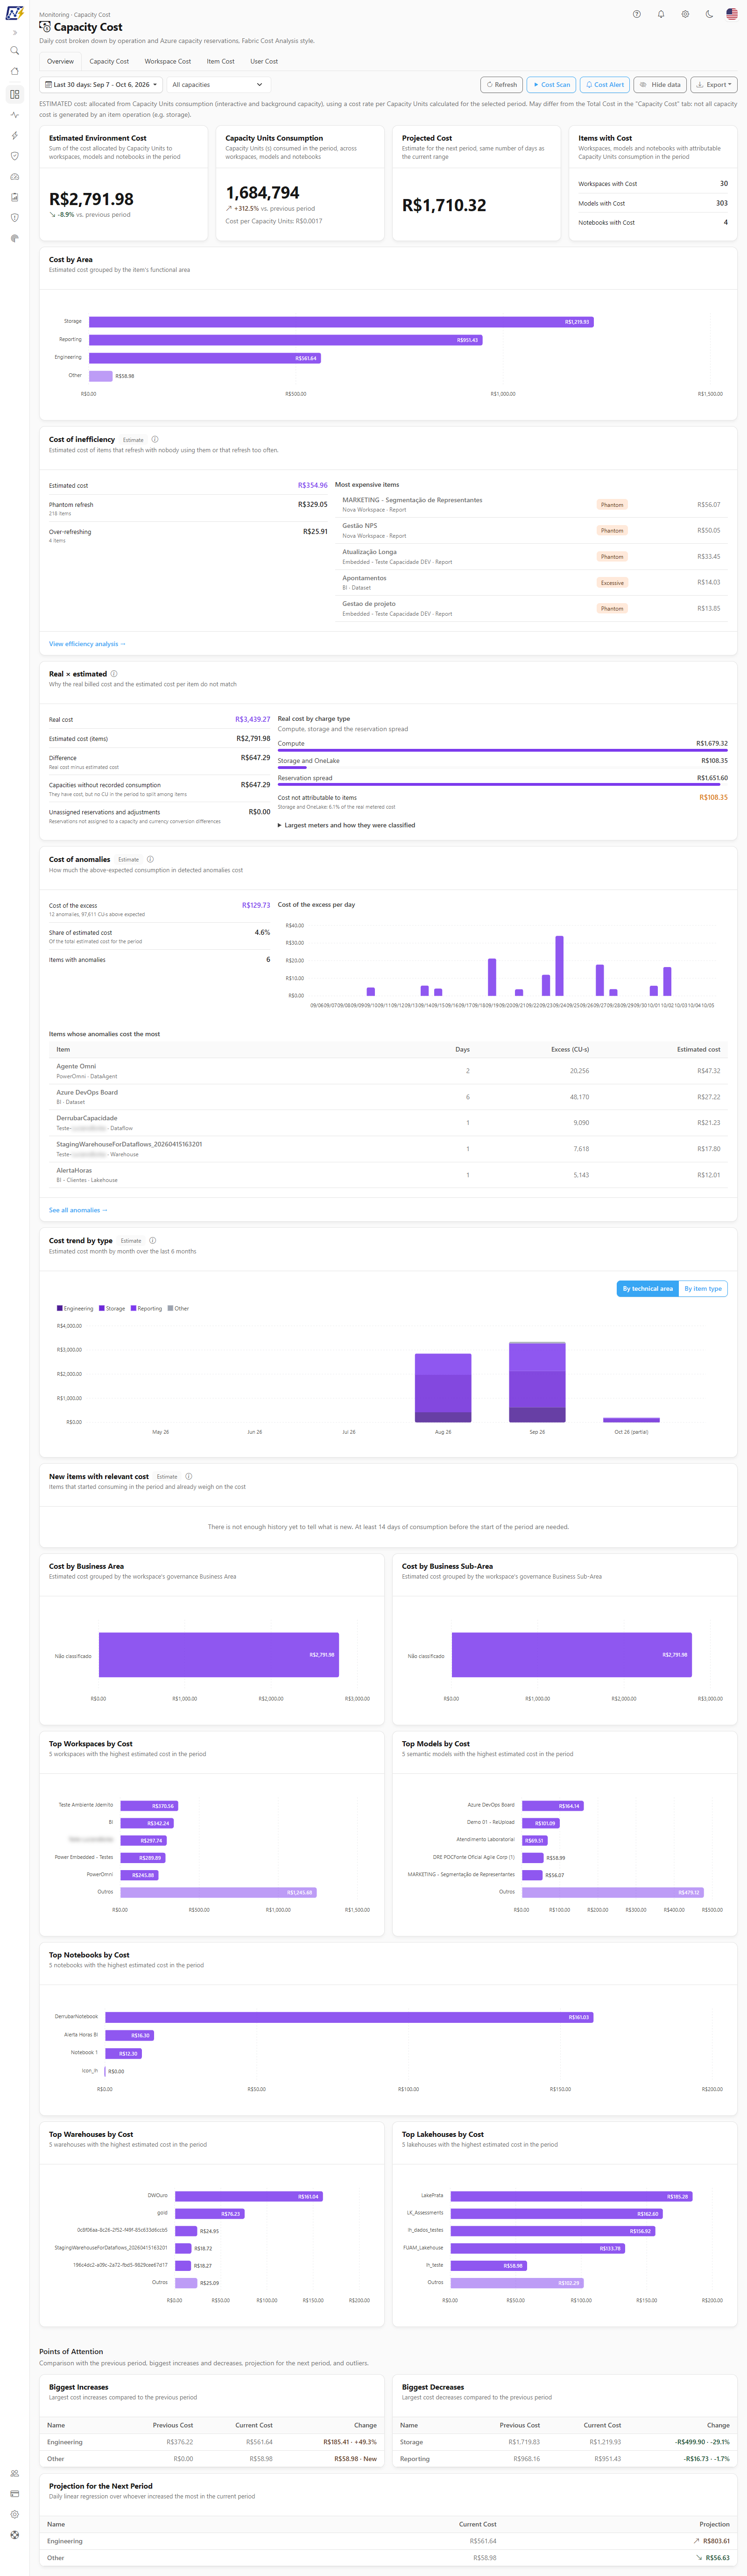
**What it is:** the **Overview** charts: **Cost by Area** (Engineering, Storage, Reporting, Others, with details by item type in the tooltip), **Top Workspaces by Cost**, **Top Models by Cost**, **Top Notebooks by Cost**, **Top Warehouses by Cost** and **Top Lakehouses by Cost** (top 5 of each), **Cost by Business Area** and **Cost by Business Sub-Area**.

**What it is for:** identifying where the money is concentrated (what type of work, which workspaces, which items, which areas of the company) to prioritize optimizations and support showback.

<figure><picture><source srcset="/files/rMvKPWkvcPcxu2E1l97L" media="(prefers-color-scheme: dark)"><img src="https://3938213054-files.gitbook.io/~/files/v0/b/gitbook-x-prod.appspot.com/o/spaces%2FH2bFRBmIfyK3kwVKbldl%2Fuploads%2Fgit-blob-a2fa55e1da843a4d09eb315e031c6b09cf1cfb68%2Fpm-dashboards-custo-capacidade-custo-por-area-en.png?alt=media" alt="Cost by Area chart"></picture><figcaption><p>Cost by Area</p></figcaption></figure>

**How to use:** hover over the bars to see the value and, in **Cost by Area**, the breakdown by item type.

**How it works:** the business area and sub-area charts use the area/sub-area assigned to the workspace in [Workspaces](/en/power-monitor/governanca/workspaces.md); unclassified workspaces are left out or grouped as unclassified. The **Points of Attention** are at the end of the tab.

### Overview: cost analyses

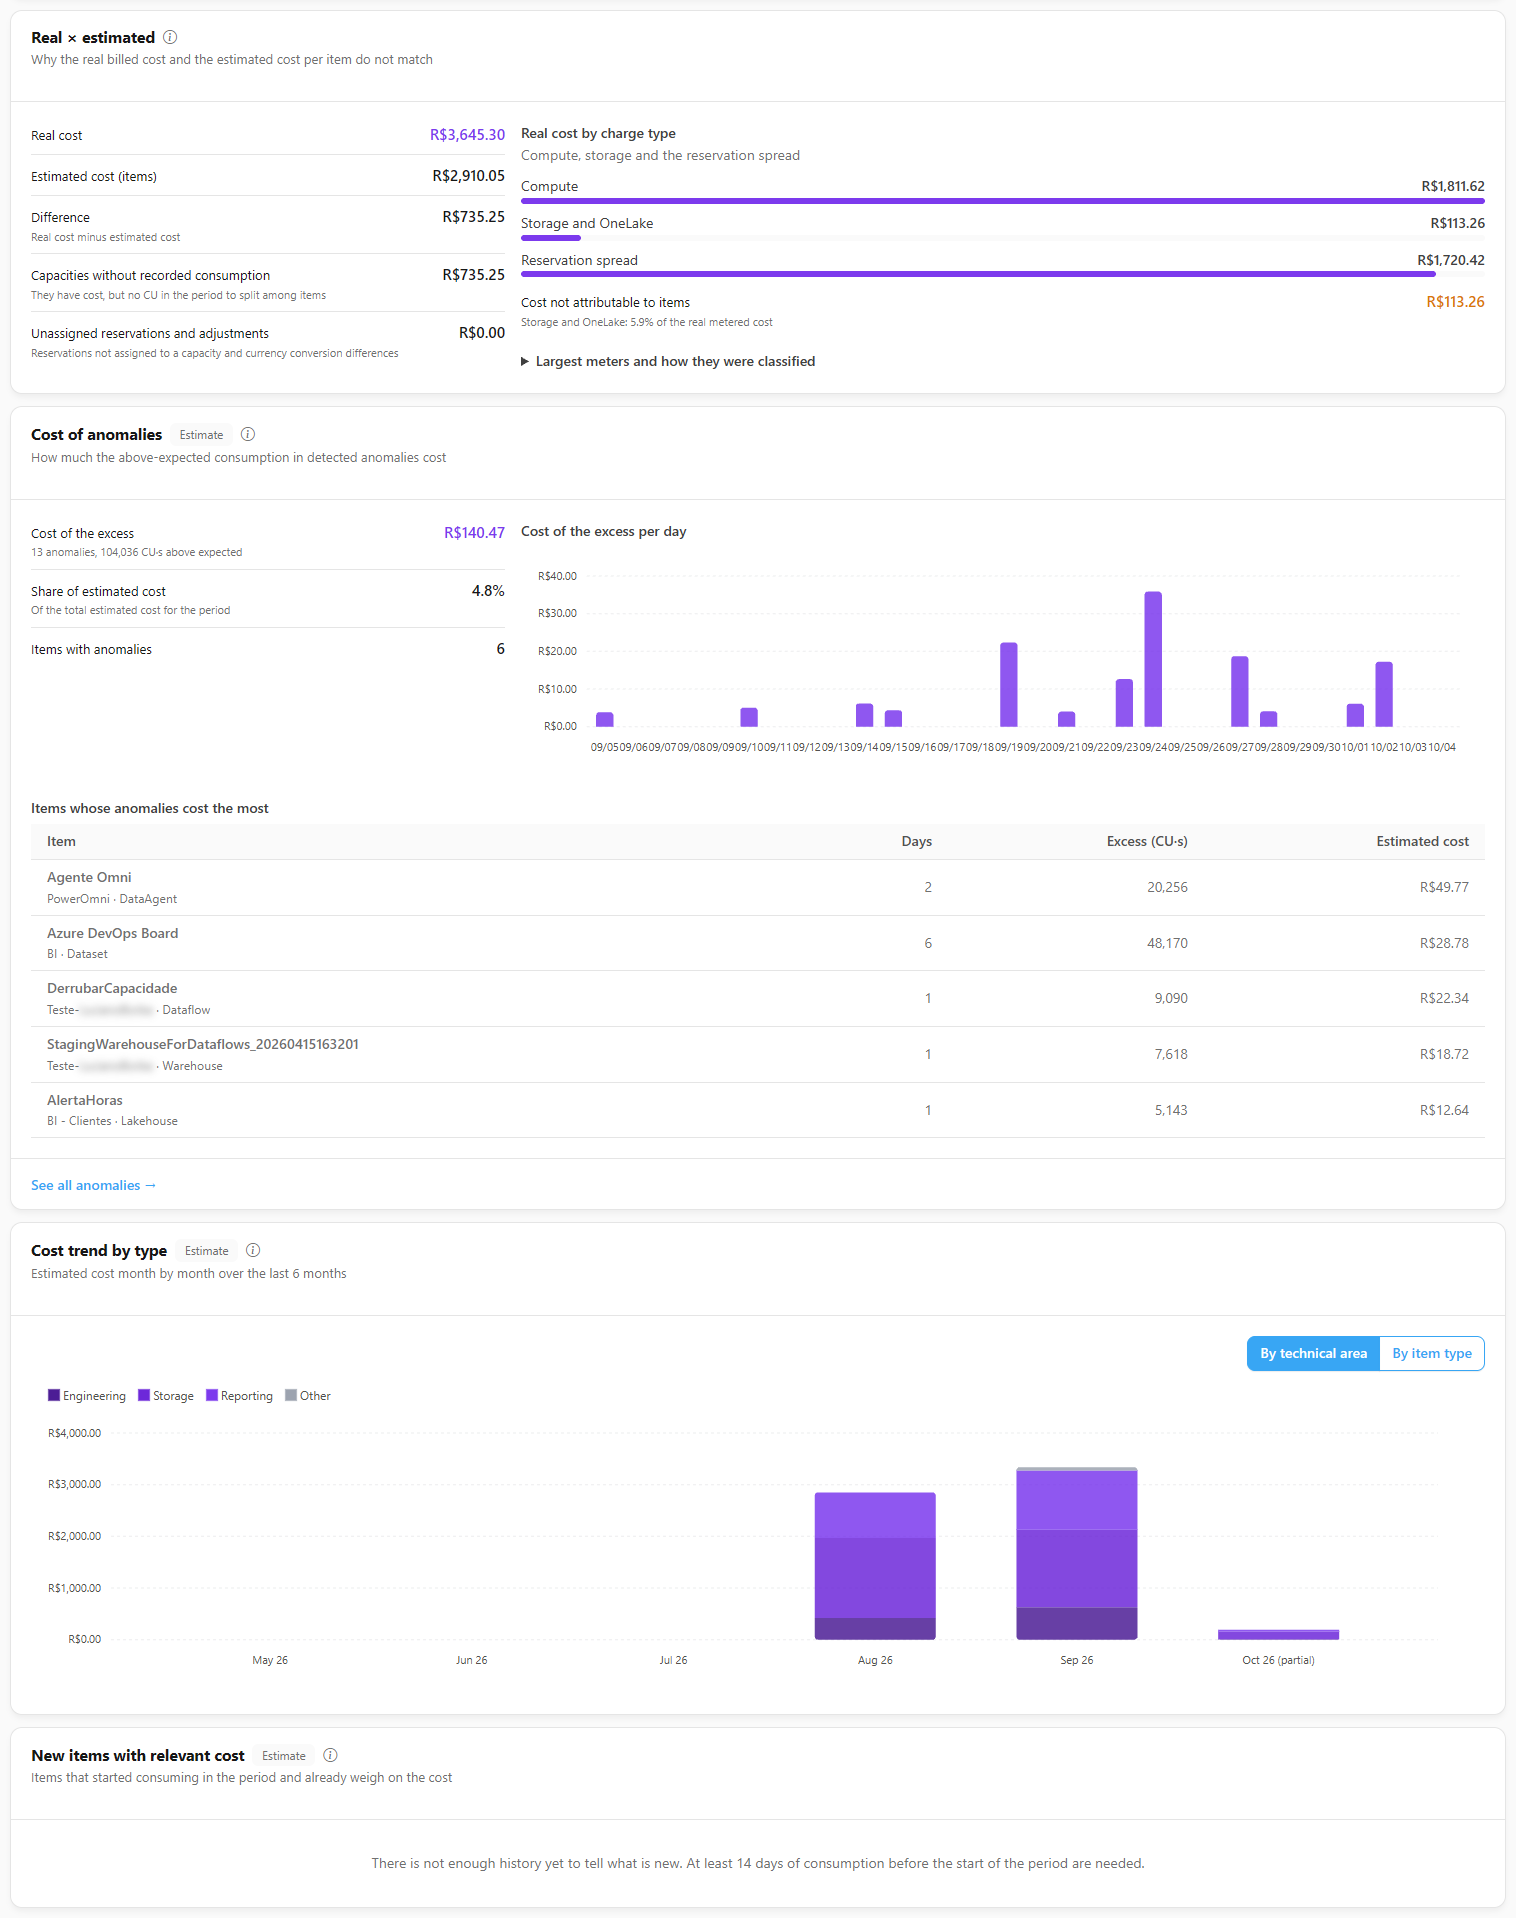
**What it is:** five cards on the **Overview** tab, right below the **Cost by Area** chart and before the rankings by business area, workspace and item, that help you understand **why** the cost is where it is. All of them respect the chosen period and capacity and show the **Estimate** badge, because they use the cost allocated by Capacity Units. Hover over the information icon of each card to see how it is calculated.

<figure><picture><source srcset="/files/PglZEjg9paCJeLD1pGIi" media="(prefers-color-scheme: dark)"><img src="https://3938213054-files.gitbook.io/~/files/v0/b/gitbook-x-prod.appspot.com/o/spaces%2FH2bFRBmIfyK3kwVKbldl%2Fuploads%2Fgit-blob-72632190094f2c0cba00774c5e6a79f0b76729b5%2Fpm-dashboards-custo-capacidade-visao-geral-analises-en.png?alt=media" alt="Real × estimated, Cost of anomalies, Cost trend by type and New items with relevant cost cards"></picture><figcaption><p>Cost analyses on the Overview</p></figcaption></figure>

| Card                             | What it answers                                                                | Main information                                                                                                                                                                                                                                                                                                                                                              |
| -------------------------------- | ------------------------------------------------------------------------------ | ----------------------------------------------------------------------------------------------------------------------------------------------------------------------------------------------------------------------------------------------------------------------------------------------------------------------------------------------------------------------------- |
| **Cost of inefficiency**         | How much items that refresh with nobody using them, or refresh too often, cost | **Estimated cost** of items classified as **Phantom refresh** or **Over-refreshing** (the same ones as in the [Efficiency Dashboard](/en/power-monitor/dashboards/dashboard-de-eficiencia.md)), the most expensive items and the **View efficiency analysis →** link                                                                                                          |
| **Real × estimated**             | Why the real billed cost and the sum estimated per item do not match           | **Real cost**, **Estimated cost (items)** and **Difference**, explained by **Capacities without recorded consumption** (they have cost and no CU to allocate) and **Unassigned reservations and adjustments**; **Real cost by charge type** (compute, storage and OneLake, other charges and reservation spread) and the largest meters with the classification they received |
| **Cost of anomalies**            | How much the above-expected consumption in detected anomalies cost             | **Cost of the excess** (only the consumption above what the item history expected), share of estimated cost, items with anomalies, cost of the excess per day and the items whose anomalies cost the most, with the **See all anomalies →** link                                                                                                                              |
| **Cost trend by type**           | How estimated cost evolved over the last 6 months                              | Month-by-month chart, with the **Group by** selector: **By technical area** or **By item type**. The month in progress appears as *(partial)* and the window ends in the month of the end of the chosen period                                                                                                                                                                |
| **New items with relevant cost** | Which items started consuming in the period and already weigh on the cost      | **Cost of new items** and the list with **Item**, **First consumption** and **Estimated cost**. Only items that cost at least 0.5% of the total estimated cost are included                                                                                                                                                                                                   |

**How it works:**

* The **real cost** comes from Azure Cost Management (the same as the Total Cost KPI). The **estimated** cost splits each capacity's cost by the consumption of items, so it only includes capacities with recorded consumption. Storage and OneLake are already inside the estimate, but no item caused them by consuming CU. The classification by charge type uses the meter name and is **approximate**.
* **New items** require history: the screen warns *There is not enough history yet to tell what is new* when there are fewer than 14 days of consumption before the start of the period. "New" means the first consumption falls within the period, in the stored history; an item idle for a long time may reappear as new.
* The **cost of anomalies** considers only item anomalies (not isolated operations, so the same excess is not counted twice) and only the positive excess.
* Parts of the real cost in a currency without an exchange rate are left out of the split by charge type, and the screen warns you.

### Capacity Cost: actual cost indicators

**What it is:** the row of KPIs on the **Capacity Cost** tab, which shows the **actual** cost billed by Azure.

**What it is for:** checking the capacities' bill and tracking the daily average.

<figure><picture><source srcset="/files/l9NkR6rzNsQwA93OANku" media="(prefers-color-scheme: dark)"><img src="https://3938213054-files.gitbook.io/~/files/v0/b/gitbook-x-prod.appspot.com/o/spaces%2FH2bFRBmIfyK3kwVKbldl%2Fuploads%2Fgit-blob-fd002b2f8b037f6ae25a5027ff1434f209874dcc%2Fpm-dashboards-custo-capacidade-aba-capacidade-en.png?alt=media" alt="Capacity Cost tab with KPIs, daily cost and cost by operation"></picture><figcaption><p>Capacity Cost tab</p></figcaption></figure>

| KPI                      | Meaning                                                                            |
| ------------------------ | ---------------------------------------------------------------------------------- |
| **Total Cost of Period** | Sum of the daily cost in the selected range.                                       |
| **Average Daily Cost**   | Total cost divided by the days in the period.                                      |
| **Median Daily Cost**    | Middle value of the days in the period, less sensitive to isolated peaks.          |
| **Active Reservations**  | Reservations with a future expiration or with an installment billed in the period. |

If any currency in the period has no exchange rate to the organization's currency, a yellow badge above the KPIs warns: "Amounts in *currencies* were not added up because no exchange rate is available". These amounts are left **out** of the totals, instead of being silently dropped.

### Daily Cost

**What it is:** a chart of the day-by-day cost evolution, separating **Reservation cost** and **Capacity cost**.

**What it is for:** finding the most expensive days and noticing changes in level (for example, after a SKU increase).

<figure><picture><source srcset="/files/uYOlxv74p3rQijhUU0GE" media="(prefers-color-scheme: dark)"><img src="https://3938213054-files.gitbook.io/~/files/v0/b/gitbook-x-prod.appspot.com/o/spaces%2FH2bFRBmIfyK3kwVKbldl%2Fuploads%2Fgit-blob-3a29d9a05172b3718ec1543b4e268de5d162ac47%2Fpm-dashboards-custo-capacidade-custo-diario-en.png?alt=media" alt="Daily Cost chart with reservation cost and capacity cost"></picture><figcaption><p>Daily Cost</p></figcaption></figure>

**How to use:** hover over a day to see the reservation and capacity values.

**How it works:** the cost day is the **UTC day** reported by Azure, and the cost is read in the **amortized** model (the reservation appears distributed across the days). Days on which a cost alert fired are marked on the chart (**Cost alert**).

### Cost by Operation, Interactive vs. Background and by Capacity

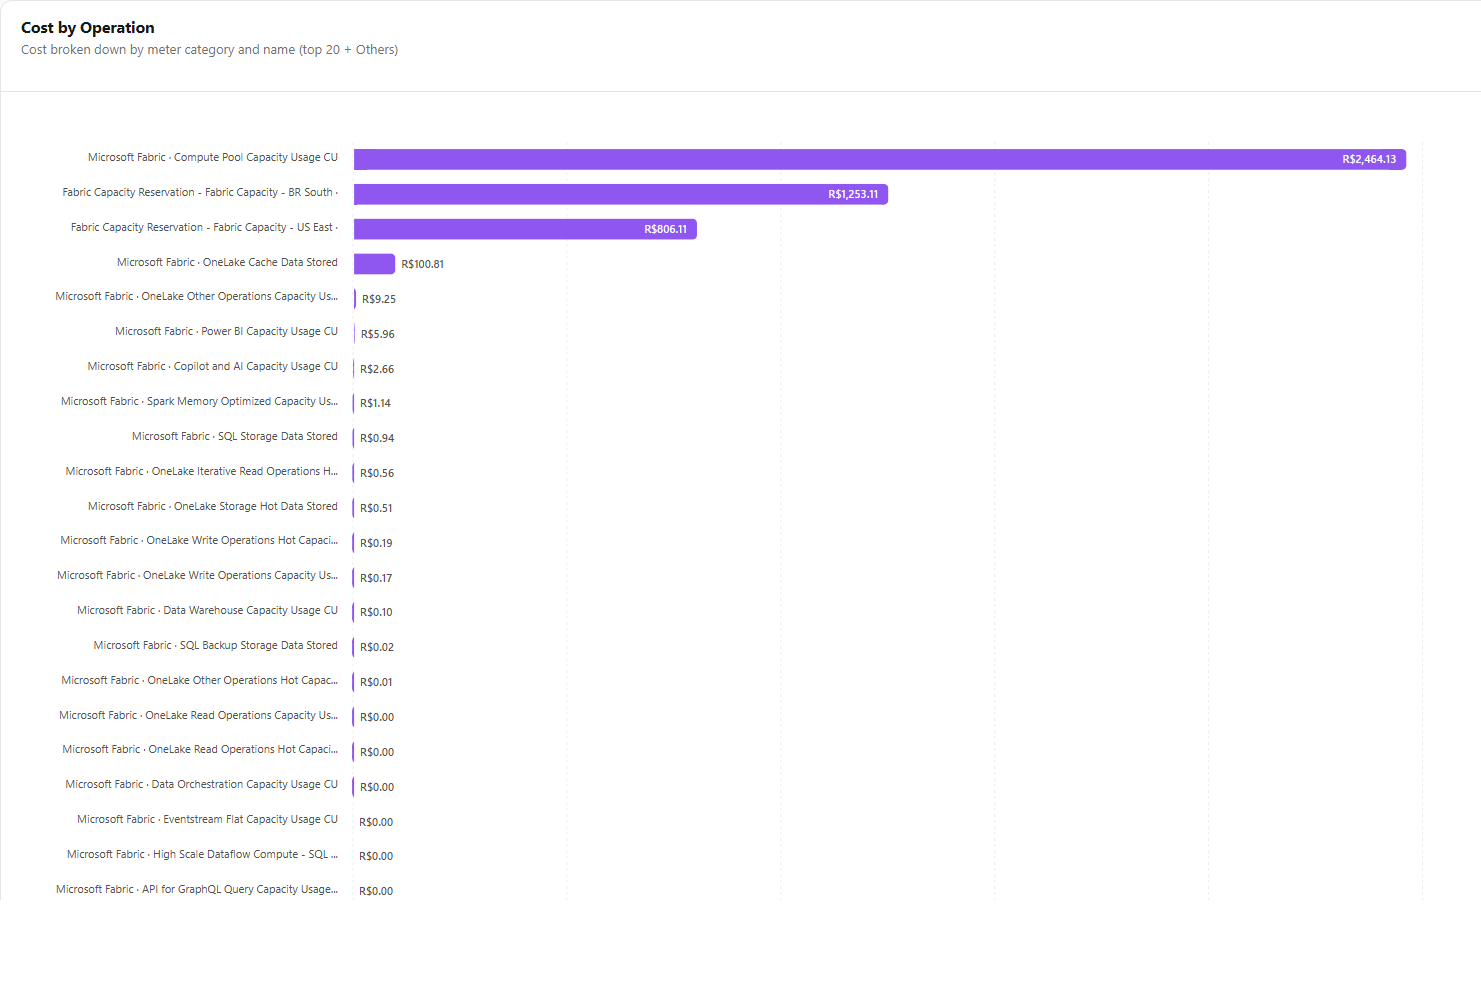
**What it is:** three charts on the **Capacity Cost** tab:

| Chart                               | What it shows                                                                                             |
| ----------------------------------- | --------------------------------------------------------------------------------------------------------- |
| **Cost by Operation**               | Cost broken down by Azure meter category and name (top 20 + Others).                                      |
| **Interactive vs. Background Cost** | Estimate obtained by applying the cost rate per Capacity Units to interactive and background consumption. |
| **Cost by Capacity**                | Distribution of the cost across the monitored capacities.                                                 |

**What it is for:** understanding on which type of charge the money was spent (compute, storage etc.), whether the cost comes from user activity (interactive) or scheduled loads (background) and which capacity weighs the most.

<figure><picture><source srcset="/files/t6vS0qPjbjSL8YOVUrX8" media="(prefers-color-scheme: dark)"><img src="https://3938213054-files.gitbook.io/~/files/v0/b/gitbook-x-prod.appspot.com/o/spaces%2FH2bFRBmIfyK3kwVKbldl%2Fuploads%2Fgit-blob-ee2be0532cef40804d3fdd6f7c0ae3acd0cb6dae%2Fpm-dashboards-custo-capacidade-custo-por-operacao-en.png?alt=media" alt="Cost by Operation chart"></picture><figcaption><p>Cost by Operation</p></figcaption></figure>

### Capacity Cost: Month close and budget

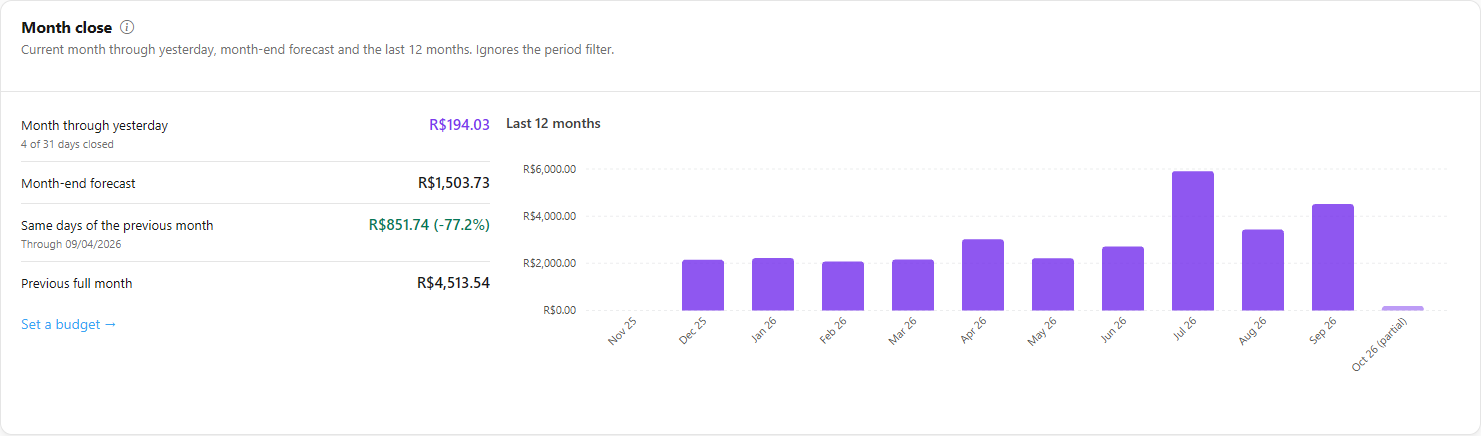
**What it is:** the **Month close** card, at the top of the **Capacity Cost** tab, which shows the real cost of the current month through yesterday, the month-end forecast and the last 12 months. It **does not use the period filter** (only the capacity filter).

**What it is for:** knowing, in the middle of the month, whether the cost will close above expectations, and following the monthly budget.

<figure><picture><source srcset="/files/TDexuJaFy3yfLdotdfPy" media="(prefers-color-scheme: dark)"><img src="https://3938213054-files.gitbook.io/~/files/v0/b/gitbook-x-prod.appspot.com/o/spaces%2FH2bFRBmIfyK3kwVKbldl%2Fuploads%2Fgit-blob-ac9c7746b6727c2871877fb90ad2a4d13b6d1d3a%2Fpm-dashboards-custo-capacidade-fechamento-mes-en.png?alt=media" alt="Month close card with month through yesterday, forecast, same days of the previous month, previous full month and last 12 months chart"></picture><figcaption><p>Month close</p></figcaption></figure>

| Indicator                           | Meaning                                                                                                                                                                                                     |
| ----------------------------------- | ----------------------------------------------------------------------------------------------------------------------------------------------------------------------------------------------------------- |
| **Month through yesterday**         | Real cost of the current month through yesterday (Azure cost arrives with a one-day delay), with the footer *N of M days closed*                                                                            |
| **Month-end forecast**              | The cost through yesterday plus the remaining days at the pace of the last 7 closed days. It shows *Available from the 2nd day of the month* or *Too few days with cost to forecast* when there is no basis |
| **Same days of the previous month** | The cost of the previous month through the same day, for comparison                                                                                                                                         |
| **Previous full month**             | The total cost of the previous month                                                                                                                                                                        |
| **Last 12 months**                  | Monthly chart, with the current month marked as *(partial)*                                                                                                                                                 |

**Budget bar:** when there is a budget for the scope (the filtered capacity or all capacities), the card shows **Budget used** and **Forecast vs. budget**, with the state **Within budget**, **At risk** or **Budget exceeded**, and the **Configure budget →** link. Without a budget, **Set a budget →** appears. If the budget was saved in a currency different from the organization's current one, it is converted at the day's exchange rate and compared normally; hover over the amount to see the tooltip "Converted from *original amount* (rate *rate* on *date*)". Only when there is no exchange rate for that currency does the card ask you to save the budget again in the organization's currency.

| State               | When it happens                                                                                   |
| ------------------- | ------------------------------------------------------------------------------------------------- |
| **Within budget**   | The cost through yesterday is below 80% of the budget and the month forecast does not exceed 100% |
| **At risk**         | The cost through yesterday reached 80% of the budget, or the month-end forecast exceeds 100%      |
| **Budget exceeded** | The cost through yesterday reached 100% of the budget                                             |

The budget is created and edited in [Monthly budget](#monthly-budget), on the **Cost Alerts** page.

### Capacity Cost: Unattributed cost

**What it is:** the **Unattributed cost** warning card (*Cost of Fabric or Power BI Embedded capacities that are not any monitored capacity*), right below the **Month close**, on the **Capacity Cost** tab.

**What it is for:** showing the cost that the Azure subscription charged for Fabric or Power BI Embedded capacities but that Power Monitor could not link to any monitored capacity, for example an A capacity without subscription and resource group filled in. This amount does not enter any KPI or chart on the tab.

**How to use:**

1. On the **Capacity Cost** tab, with the capacity filter set to all capacities, read the card amount (*in the period, not included in the totals above*).
2. In **Top resources**, see the resources with the highest unattributed cost, each with its source subscription (masked).
3. For each resource, complete the capacity subscription and resource group in [Governance › Capacities](/en/power-monitor/governanca/infraestrutura/capacidades.md#details-tab-and-azure-location), or start monitoring it, so its cost gets attributed.

**How it works:**

* The card only appears when there is unattributed cost in the period and the capacity filter is set to all capacities: the warning is about the environment, not about one capacity.
* The list shows up to 5 resources, by name only; if there are more, "and *N* more resource(s)" appears. The full subscription identifier is never displayed.
* The amounts are converted to the organization's currency at each day's exchange rate. If there is no exchange rate for some currency, the card shows "Amount unavailable: no exchange rate for *currencies*".

### Capacity Cost: Reservation coverage

**What it is:** the **Reservation coverage** card, which shows how much of the real cost was covered by a reservation or Savings Plan and how much was charged separately.

**What it is for:** knowing whether reservations are being well used or whether a relevant part of the cost is paid on demand.

**How it works:** the chart separates, per day, **Covered by reservation** and **Overage**, and the card reports **% covered by reservation** and **Overage in the period**. Days collected before the split existed appear as **Not split** (a full cost scan redoes the split). For **CSP** channel reservations the analysis does not apply, because Azure does not report how much of each day the reservation covered (the reservation amount is already spread into the total cost). With no reservation or Savings Plan, the screen warns that all cost was charged on demand.

### Reservations

**What it is:** the **Reservations** table, with the Azure capacity reservations visible to the organization's Service Principal.

**What it is for:** knowing which reservations are active, which capacity they belong to and when they expire, so you can renew them in time.

<figure><picture><source srcset="/files/bN0b9cW8atkR59N3fIWV" media="(prefers-color-scheme: dark)"><img src="https://3938213054-files.gitbook.io/~/files/v0/b/gitbook-x-prod.appspot.com/o/spaces%2FH2bFRBmIfyK3kwVKbldl%2Fuploads%2Fgit-blob-8c2a4ae137534d413d6022be96b236e23da4a4aa%2Fpm-dashboards-custo-capacidade-reservas-en.png?alt=media" alt="Table of Azure capacity reservations"></picture><figcaption><p>Reservations table</p></figcaption></figure>

| Column                               | Description                                                                                                                                |
| ------------------------------------ | ------------------------------------------------------------------------------------------------------------------------------------------ |
| **SKU**                              | Reserved SKU.                                                                                                                              |
| **Term**                             | **1 year**, **3 years** or **Not provided**.                                                                                               |
| **Region**                           | Region of the reservation.                                                                                                                 |
| **Capacity**                         | Capacity associated with the reservation.                                                                                                  |
| **Quantity**                         | Reserved quantity.                                                                                                                         |
| **Status**                           | Status of the reservation.                                                                                                                 |
| **Purchase Date** / **Expiry Date**  | Reservation dates. The expiration is highlighted as **Expired**, **Expiring soon** (less than 30 days) or **Warning** (less than 90 days). |
| **Total Price** / **Monthly Amount** | Total amount and monthly installment.                                                                                                      |
| **Billing Plan**                     | Upfront or monthly payment.                                                                                                                |

**How to use (assign a reservation to a capacity):** use this when the reservation was identified via Cost Management (CSP contracts) and Power Monitor found more than one candidate capacity.

1. Find the reservation in the table (source **Estimated via Cost Management**).
2. In the **Capacity** column, choose the capacity in **Select a capacity**.
3. Click **Assign**. The reservation is then considered in that capacity's cost.

**How it works:** the source of each row appears as **Via billing details** or **Estimated via Cost Management**. The list of candidates shows capacities of the same product family (Fabric or Power BI Embedded) and the same region as the reservation, with those of the same subscription first. If *"No capacity in the same subscription/region"* appears, there is no candidate for the reservation. The **Points of Attention** are at the end of the tab.

### Reservations timeline

**What it is:** the **Reservations timeline** card, with one bar per reservation from the purchase date to the expiry and a vertical line marking **Today**.

**What it is for:** planning renewals and anticipating the installments still to be paid.

**How it works:**

* The state of each reservation appears as **Active**, **Expired**, **Not started yet** or **No expiry date**; those expiring within **90 days** get the **Expiring soon** highlight, and the **Expiring in the next 90 days** list summarizes what to renew.
* **Monthly installments due** lists the upcoming installments (up to 12 months) only for reservations with **monthly** billing, in the reservation's own currency and without conversion.
* **CSP** partner reservations do not report the expiry: they appear without a bar, with the last known installment.

### Reservation vs actual usage

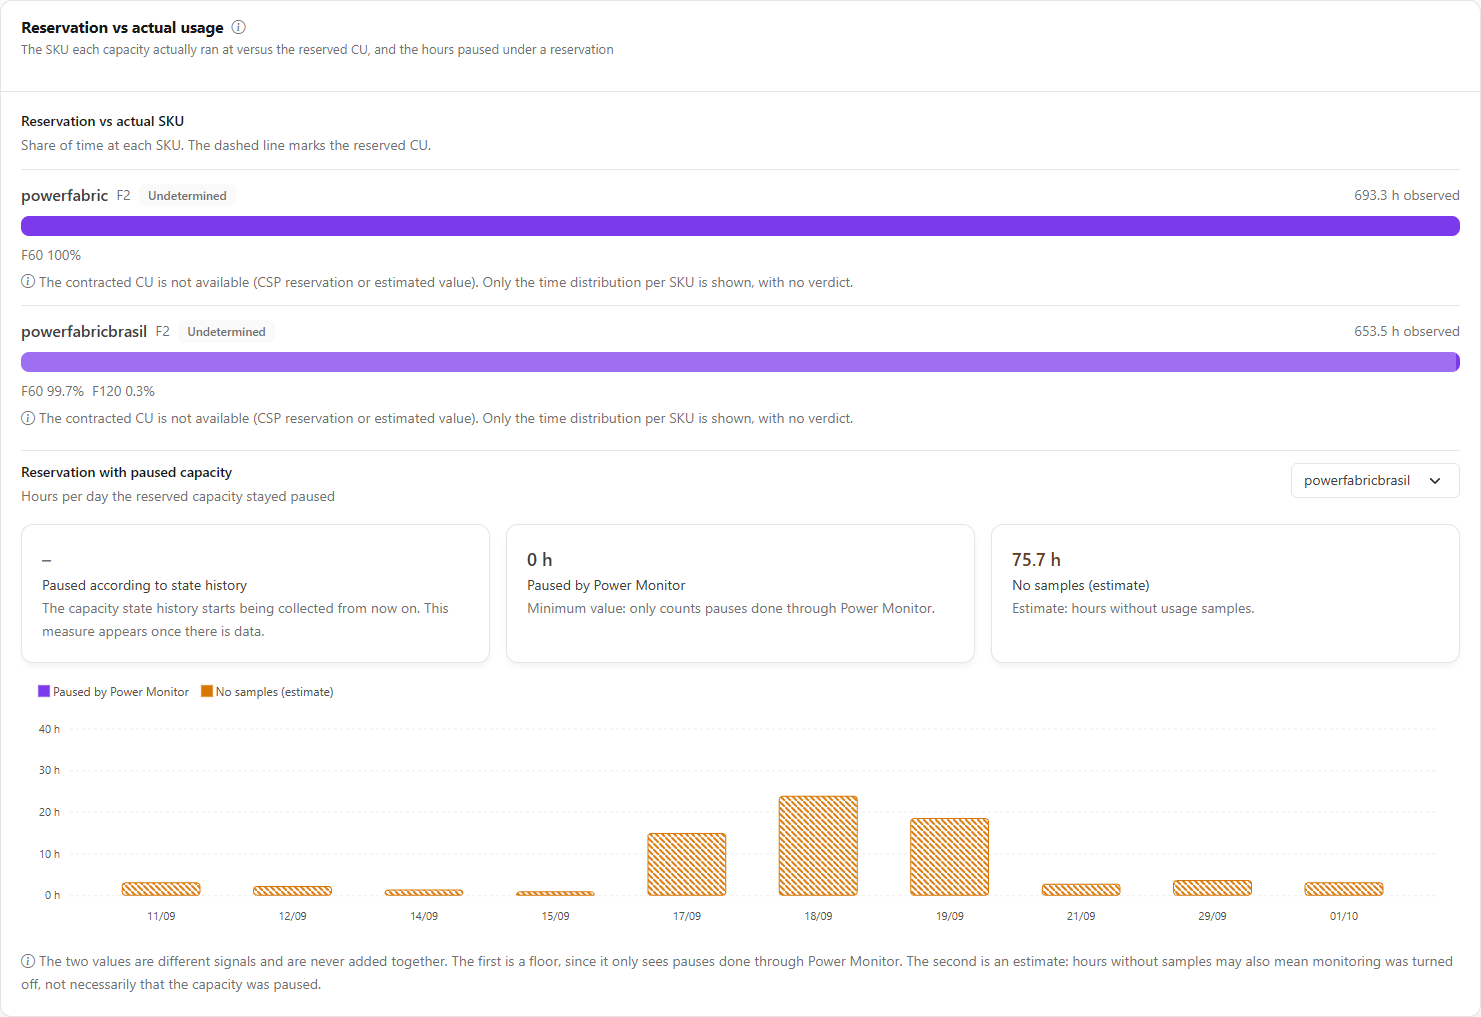
**What it is:** the **Reservation vs actual usage** card, which compares, hour by hour, the SKU each capacity with a linked reservation actually ran at against the contracted CU, and shows the hours the capacity was **paused** while the reservation is still paid.

**What it is for:** discovering reservations that are too small (part of the usage is paid on demand), too large (reserved CU going unused) or paused capacities that keep costing.

<figure><picture><source srcset="/files/pBFH4raKI96pLHaJUBEB" media="(prefers-color-scheme: dark)"><img src="https://3938213054-files.gitbook.io/~/files/v0/b/gitbook-x-prod.appspot.com/o/spaces%2FH2bFRBmIfyK3kwVKbldl%2Fuploads%2Fgit-blob-8f13f415038c1ed16364f668b95dabeaabba73f4%2Fpm-dashboards-custo-capacidade-reserva-uso-real-en.png?alt=media" alt="Reservation vs actual usage card with the verdict, the time distribution by SKU and the paused hours"></picture><figcaption><p>Reservation vs actual usage</p></figcaption></figure>

| Verdict                   | When it appears                                                                                                                    |
| ------------------------- | ---------------------------------------------------------------------------------------------------------------------------------- |
| **Reservation too small** | In 50% or more of the observed hours the capacity ran above the reserved CU. The excess is paid on demand                          |
| **Reservation too large** | In 50% or more of the observed hours the capacity ran below the reserved CU                                                        |
| **Partially covered**     | The capacity was above (or below) the reserved CU for 5% or more of the time                                                       |
| **Covered**               | Usage stays within the reserved CU                                                                                                 |
| **Undetermined**          | Data is missing, or the contracted CU is not known (CSP reservations): only the time distribution by SKU is shown, with no verdict |

**Reservation with paused capacity:** shows, per day, the paused hours from three signals **that are never added together**: **Paused by Power Monitor** (a floor, because pauses done outside Power Monitor, such as in the Azure portal, do not appear), **No samples (estimate)** (weak, because missing samples can also mean monitoring was off) and **Paused according to state history** (the most reliable signal, but only valid from the first collected record of each capacity).

**How it works:** only reservations **linked** to a capacity enter (the screen warns how many reservations were left out and tells you to link them in the [Reservations](#reservations) table). The window is cut to the reservation's validity.

### Automation savings

**What it is:** the **Automation savings** card, which adds up the hours a capacity stayed **paused** or on a **smaller SKU** because of Power Monitor actions (**Manual**, **Schedule** or **Auto-scale**) and values them at the public Azure list price.

**What it is for:** showing the return of capacity automations.

**How it works:** the value is an **estimate at list price**, not the billed amount, and is never added to the real cost. Capacities with an active reservation generate no savings (the reservation is paid anyway) and appear under **No savings (covered by reservation)**. The card shows **Estimated savings**, **Paused hours**, **Hours on a smaller SKU**, **Actions in the period**, the split **By origin** and **By capacity**. Pauses done outside Power Monitor do not appear.

### Where to save: idle hours, SKU, business hours and cost per CU

Four cards on the **Capacity Cost** tab point to saving opportunities. The first two use the **list price** (badge *Estimate at list price*) and are **never added to the real cost**; the others use measured consumption or the real cost.

<figure><picture><source srcset="/files/jEkHe4I2RHQh3myHXIH3" media="(prefers-color-scheme: dark)"><img src="https://3938213054-files.gitbook.io/~/files/v0/b/gitbook-x-prod.appspot.com/o/spaces%2FH2bFRBmIfyK3kwVKbldl%2Fuploads%2Fgit-blob-e133641787932f4f6cfa146e9b5c6a0163af948d%2Fpm-dashboards-custo-capacidade-onde-economizar-en.png?alt=media" alt="Idle hours and pause savings, SKU sizing, Consumption outside business hours and Real cost per CU cards"></picture><figcaption><p>Saving opportunity cards</p></figcaption></figure>

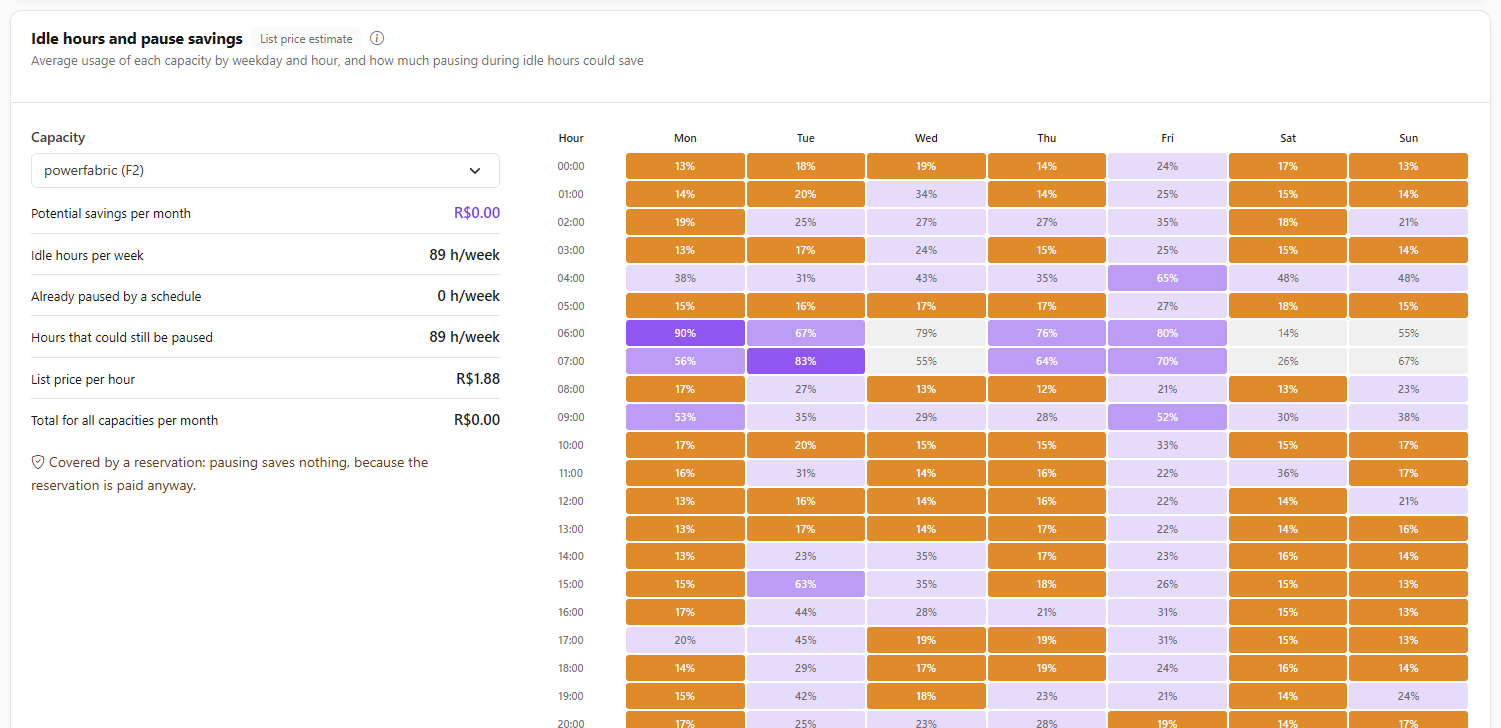
**Idle hours and pause savings.** A heatmap of each capacity's average usage by **weekday and hour**, in the organization's time zone, and how much pausing during idle hours could save.

* An hour is **idle** when the average is below **20%** and that weekday and hour was observed on at least 2 different dates (and 6 samples).
* Hours that a recurring schedule already pauses do not enter the savings (legend **Paused by a schedule**). The map legend also has **Few samples**, **Idle (below 20%)**, **Up to 50%**, **50% to 80%** and **Above 80%**, and the **Capacity** selector chooses which capacity the map shows.
* The card shows **Potential savings per month**, **Idle hours per week**, **Already paused by a schedule**, **Hours that could still be paused** and the **List price per hour**.
* Savings are **zero** (the hours are still counted) when pausing does not reduce the bill: a capacity **covered by a reservation** or a SKU with no dedicated capacity (PPU, trial).

**SKU sizing.** For each capacity: **Average**, **P95**, **Maximum**, **Days with sustained overload**, **Throttling**, **Suggestion** and the monthly **Difference** at list price.

| Suggestion            | Rule                                                                                                                         |
| --------------------- | ---------------------------------------------------------------------------------------------------------------------------- |
| **Increase to {SKU}** | There was throttling, or 3 or more days with **sustained overload** (at least 5% of the day's samples at 100% or more usage) |
| **Reduce to {SKU}**   | P95 below 40%, no throttling and no day of overload                                                                          |
| **Keep**              | None of the conditions above                                                                                                 |
| **Not enough data**   | Fewer than 7 days with data                                                                                                  |
| **Not applicable**    | PPU, trial or a SKU outside the catalog                                                                                      |

The **Maximum** is informational only (*Isolated peak, not used in the suggestion*), because the metric has very high isolated peaks. Capacities covered by a reservation warn that a smaller SKU does not lower the reservation amount.

**Consumption outside business hours.** How much of the consumption (in CU) happens **outside business hours** (Monday to Friday, 8h to 18h, in the organization's time zone; holidays count as workdays) and **on weekends**, with the split **Business hours**, **Weekdays, outside hours** and **Weekend** and the **items consuming the most outside business hours** (top 10). Data from before the time zone fix of the hourly history is left out, and the screen shows the cutoff date.

**Real cost per CU.** The real cost of each capacity divided by the CU-hours consumed, to find who pays for the whole capacity and uses little. It shows **Real cost**, **CU consumed**, **Cost per CU-hour** and **Compared to average**. The **Worst cost-benefit** is only highlighted with at least two capacities compared and when it is 1.25 times above the average or more. Capacities **covered by a reservation** and those without enough measured consumption are left out of the comparison.

### Throttling risk

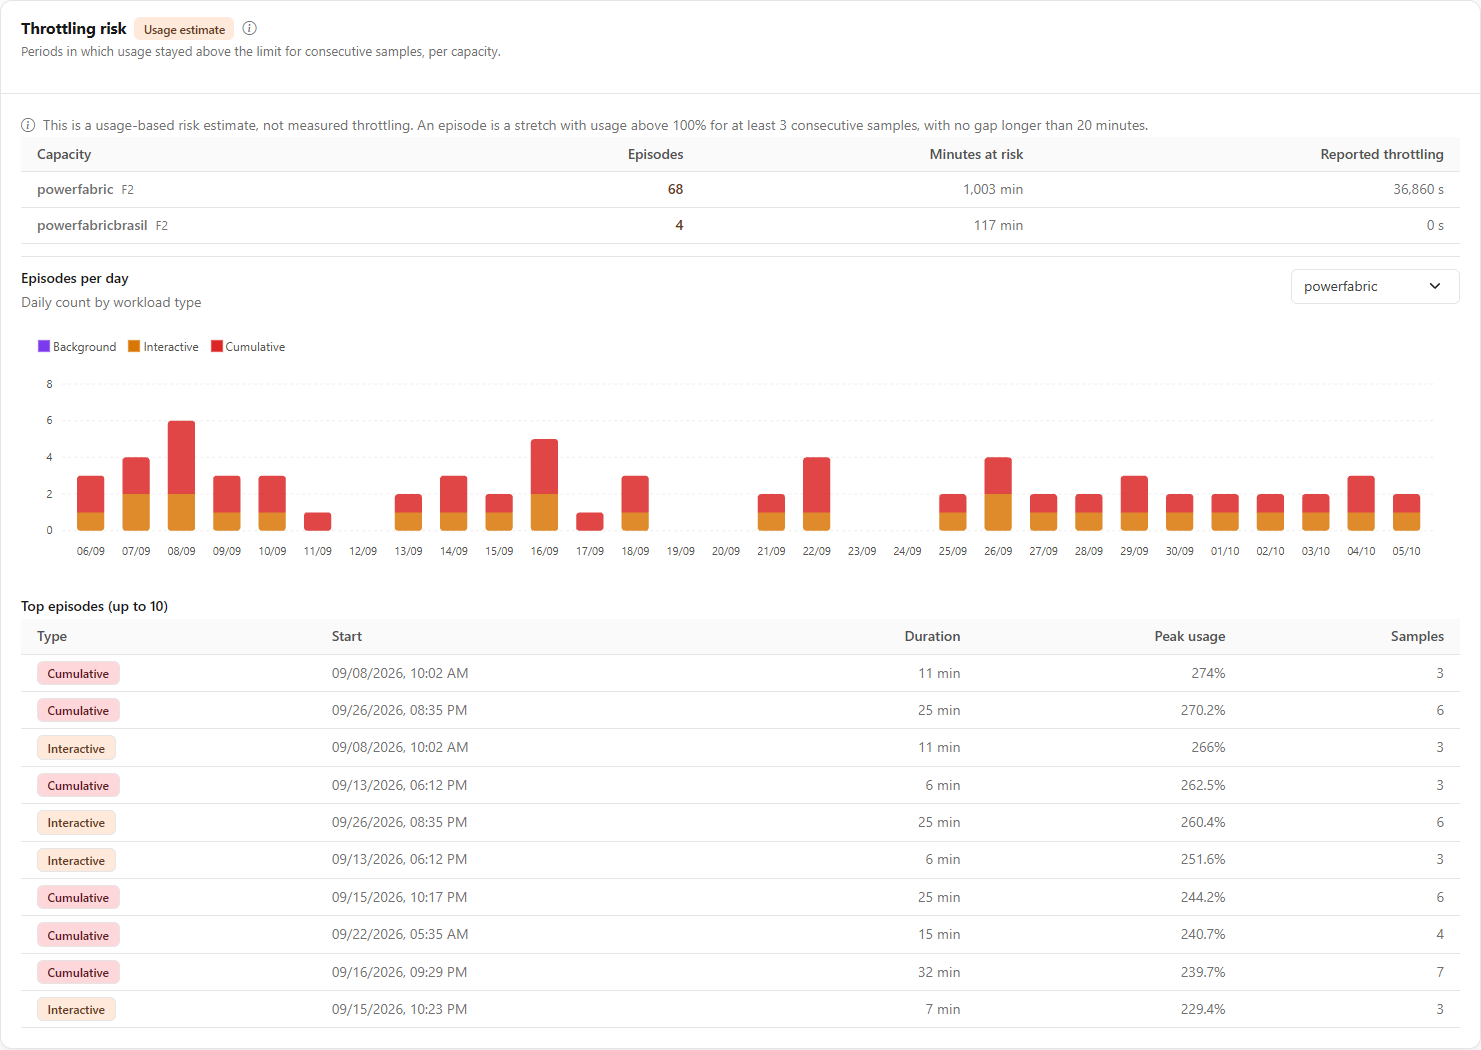
**What it is:** the **Throttling risk** card, with the **Usage estimate** badge: periods in which a capacity's usage stayed at **100% or more for consecutive samples**, per capacity.

**What it is for:** anticipating performance degradation before increasing the SKU.

<figure><picture><source srcset="/files/0MT3ZVFeJHP8g5KGcrZI" media="(prefers-color-scheme: dark)"><img src="https://3938213054-files.gitbook.io/~/files/v0/b/gitbook-x-prod.appspot.com/o/spaces%2FH2bFRBmIfyK3kwVKbldl%2Fuploads%2Fgit-blob-510e1cd5320598b065a2e833574f9a2d54c60a5d%2Fpm-dashboards-custo-capacidade-throttling-en.png?alt=media" alt="Throttling risk card with the table by capacity, the episodes per day and the list of top episodes"></picture><figcaption><p>Throttling risk</p></figcaption></figure>

**How it works:**

* An **episode** is a stretch with usage above 100% for at least **3 consecutive samples** (about 15 minutes), with no gap longer than 20 minutes. The three workload types, **Background**, **Interactive** and **Cumulative**, are detected separately.
* It is a **usage risk estimate**, not measured throttling: Power Monitor does not receive Fabric's rejection or delay counters. The **Reported throttling** column shows the seconds of throttling that the Capacity Metrics App recorded, when available, and they do not enter the estimate.
* The table has **Capacity**, **Episodes**, **Minutes at risk** and **Reported throttling**; the **Episodes per day** chart shows the daily count by type, and the **Top episodes** list has **Type**, **Start**, **Duration**, **Peak usage** and **Samples** (up to 200 per capacity).
* The **Capacity** selector of the card limits the chart and the episode list to one capacity.
* The analyzed period is limited to **31 days**; longer periods are reduced, with a warning.

### Workspace Cost

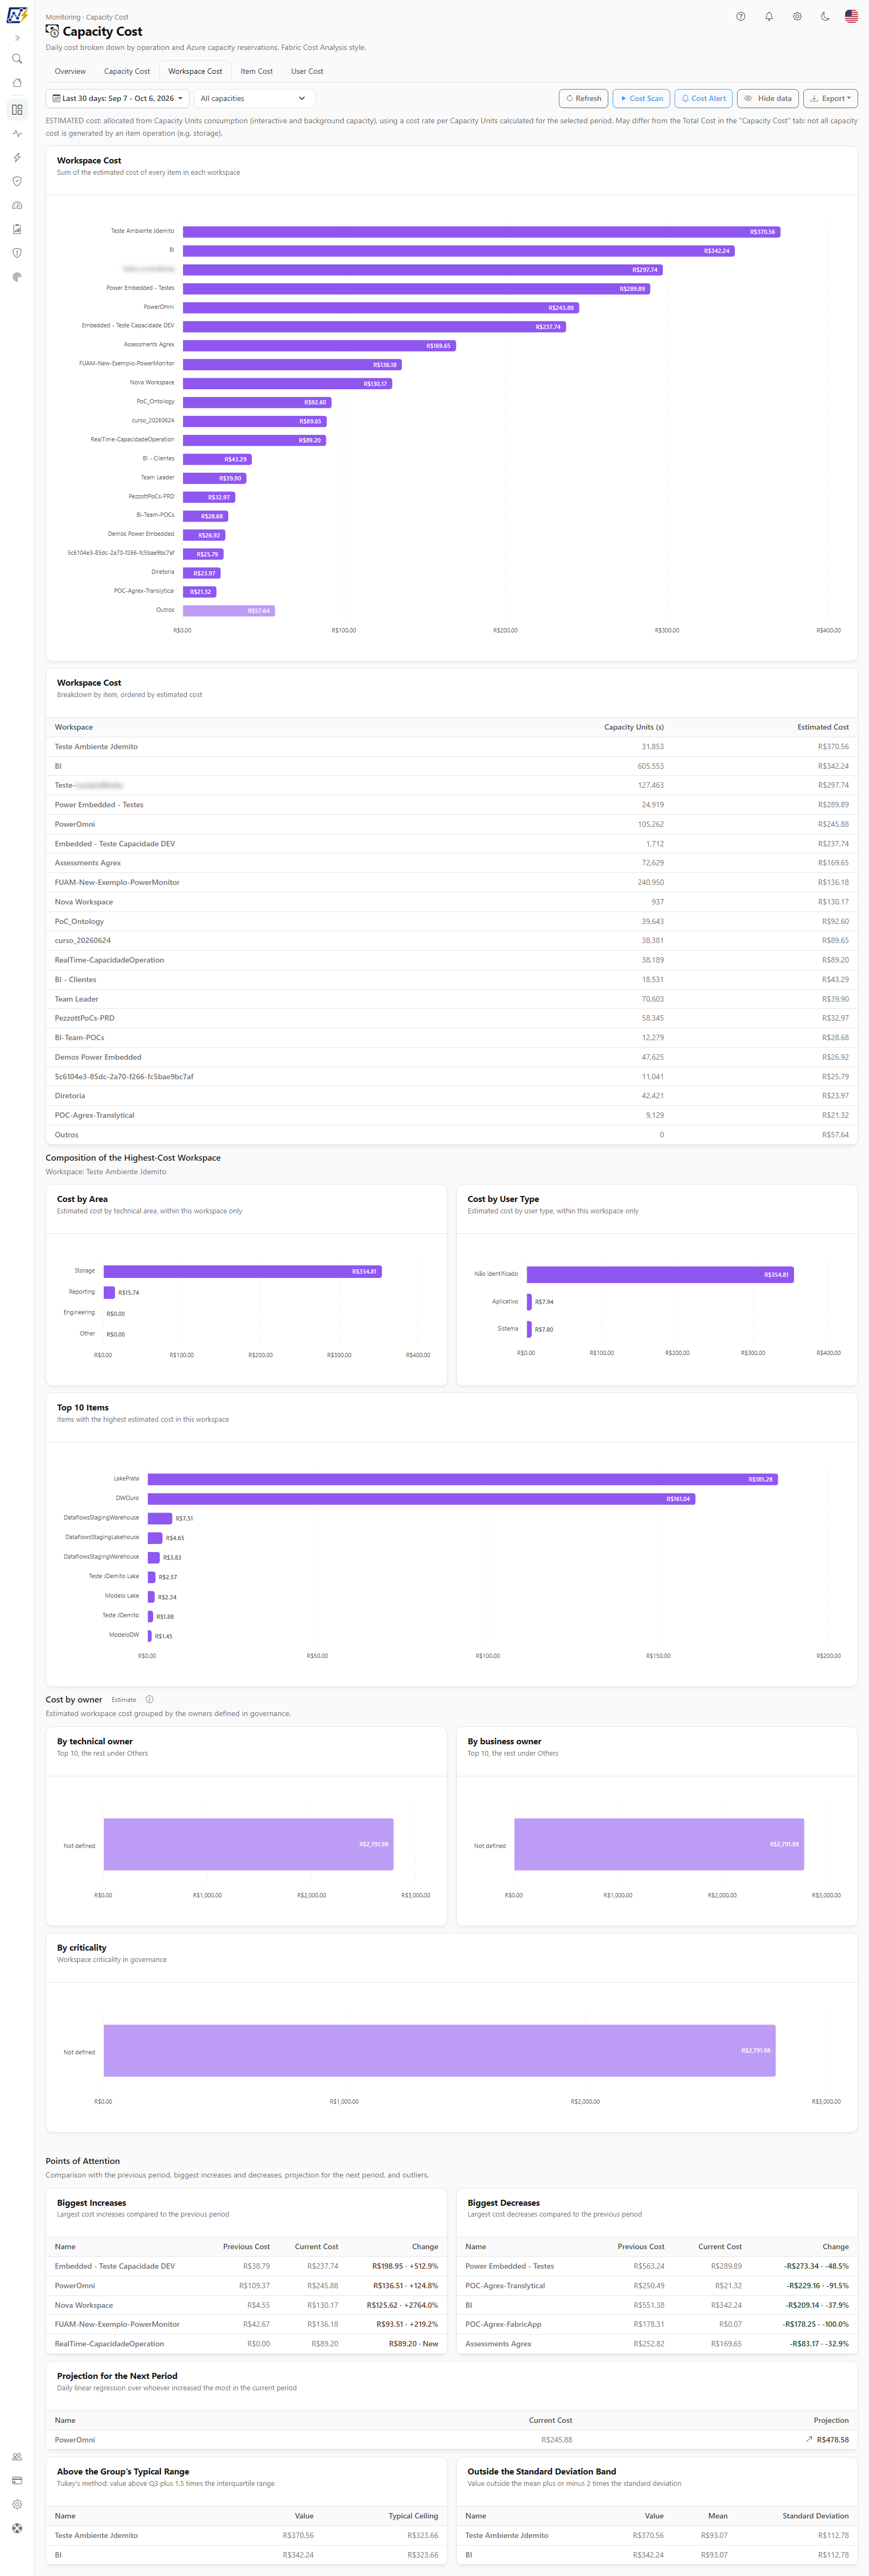
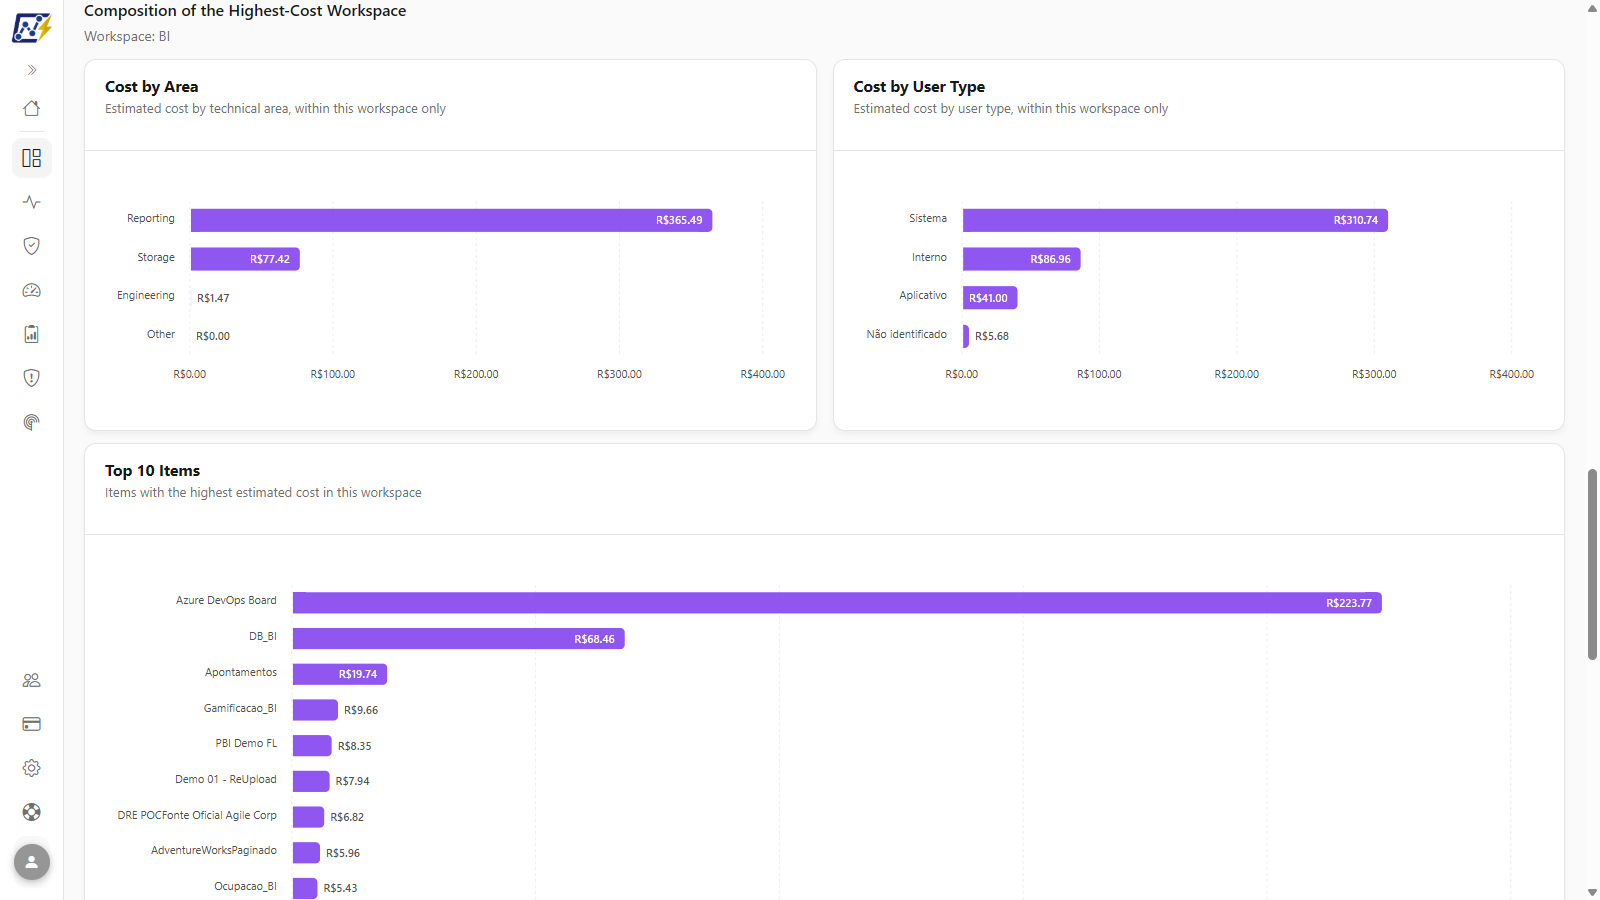
**What it is:** the **Workspace Cost** tab, with the table of the **estimated cost of each workspace** (sum of the estimated cost of all the workspace's items) (**Workspace**, **Capacity Units (s)** and **Estimated Cost** columns, sorted by highest cost), a ranking chart at the top and the **Composition of the Highest-Cost Workspace** block. Further down is the **Cost by owner** section (see below).

**What it is for:** doing showback per workspace (area, project, internal client) and understanding what makes the most expensive workspace expensive.

<figure><picture><source srcset="/files/ZKOv1iXvfUe21I5T6gtq" media="(prefers-color-scheme: dark)"><img src="https://3938213054-files.gitbook.io/~/files/v0/b/gitbook-x-prod.appspot.com/o/spaces%2FH2bFRBmIfyK3kwVKbldl%2Fuploads%2Fgit-blob-85c514f99a66d9be182c48b356a02828d0f70421%2Fpm-dashboards-custo-capacidade-aba-workspace-en.png?alt=media" alt="Workspace Cost tab"></picture><figcaption><p>Workspace Cost tab</p></figcaption></figure>

<figure><picture><source srcset="/files/mKcxlnUHLdTSr0tIXgxv" media="(prefers-color-scheme: dark)"><img src="https://3938213054-files.gitbook.io/~/files/v0/b/gitbook-x-prod.appspot.com/o/spaces%2FH2bFRBmIfyK3kwVKbldl%2Fuploads%2Fgit-blob-083e2d25588ad402d338b27cb916eb498af66eb1%2Fpm-dashboards-custo-capacidade-composicao-workspace-en.png?alt=media" alt="Composition of the Highest-Cost Workspace block with Cost by Area, Cost by User Type and Top 10 Items"></picture><figcaption><p>Composition of the Highest-Cost Workspace</p></figcaption></figure>
**How to use:**

1. Set **Period** and **Capacity** and click the **Workspace Cost** tab.
2. Read the table from top to bottom (highest cost first).
3. In the **Composition of the Highest-Cost Workspace** block, see **Cost by Area**, **Cost by User Type** and **Top 10 Items** of the most expensive workspace.
4. Further down, in **Cost by owner**, see the workspace cost by technical owner, business owner and criticality.

### Workspace Cost: cost by owner

**What it is:** the **Cost by owner** section, with the **Estimate** badge, at the end of the **Workspace Cost** tab (before the **Points of Attention**). It groups the estimated cost of the workspaces by the owners defined in the workspace governance.

**What it is for:** charging each owner for what their set of workspaces consumes (showback) and finding out how much the workspaces that still have no owner defined cost.

| Chart                  | What it shows                                                               |
| ---------------------- | --------------------------------------------------------------------------- |
| **By technical owner** | The 10 technical owners with the highest cost; the rest under **Others**    |
| **By business owner**  | The 10 business owners with the highest cost; the rest under **Others**     |
| **By criticality**     | Cost by workspace criticality (**Critical**, **High**, **Medium**, **Low**) |

**How it works:** workspaces without the governance field filled in appear as **Not defined**, which is never grouped into **Others**, so the missing registration stays visible. With no cost in the period, the section shows "No estimated cost in the selected period." The data of this section is also included in the CSV and JSON exported from the tab.

### Item Cost

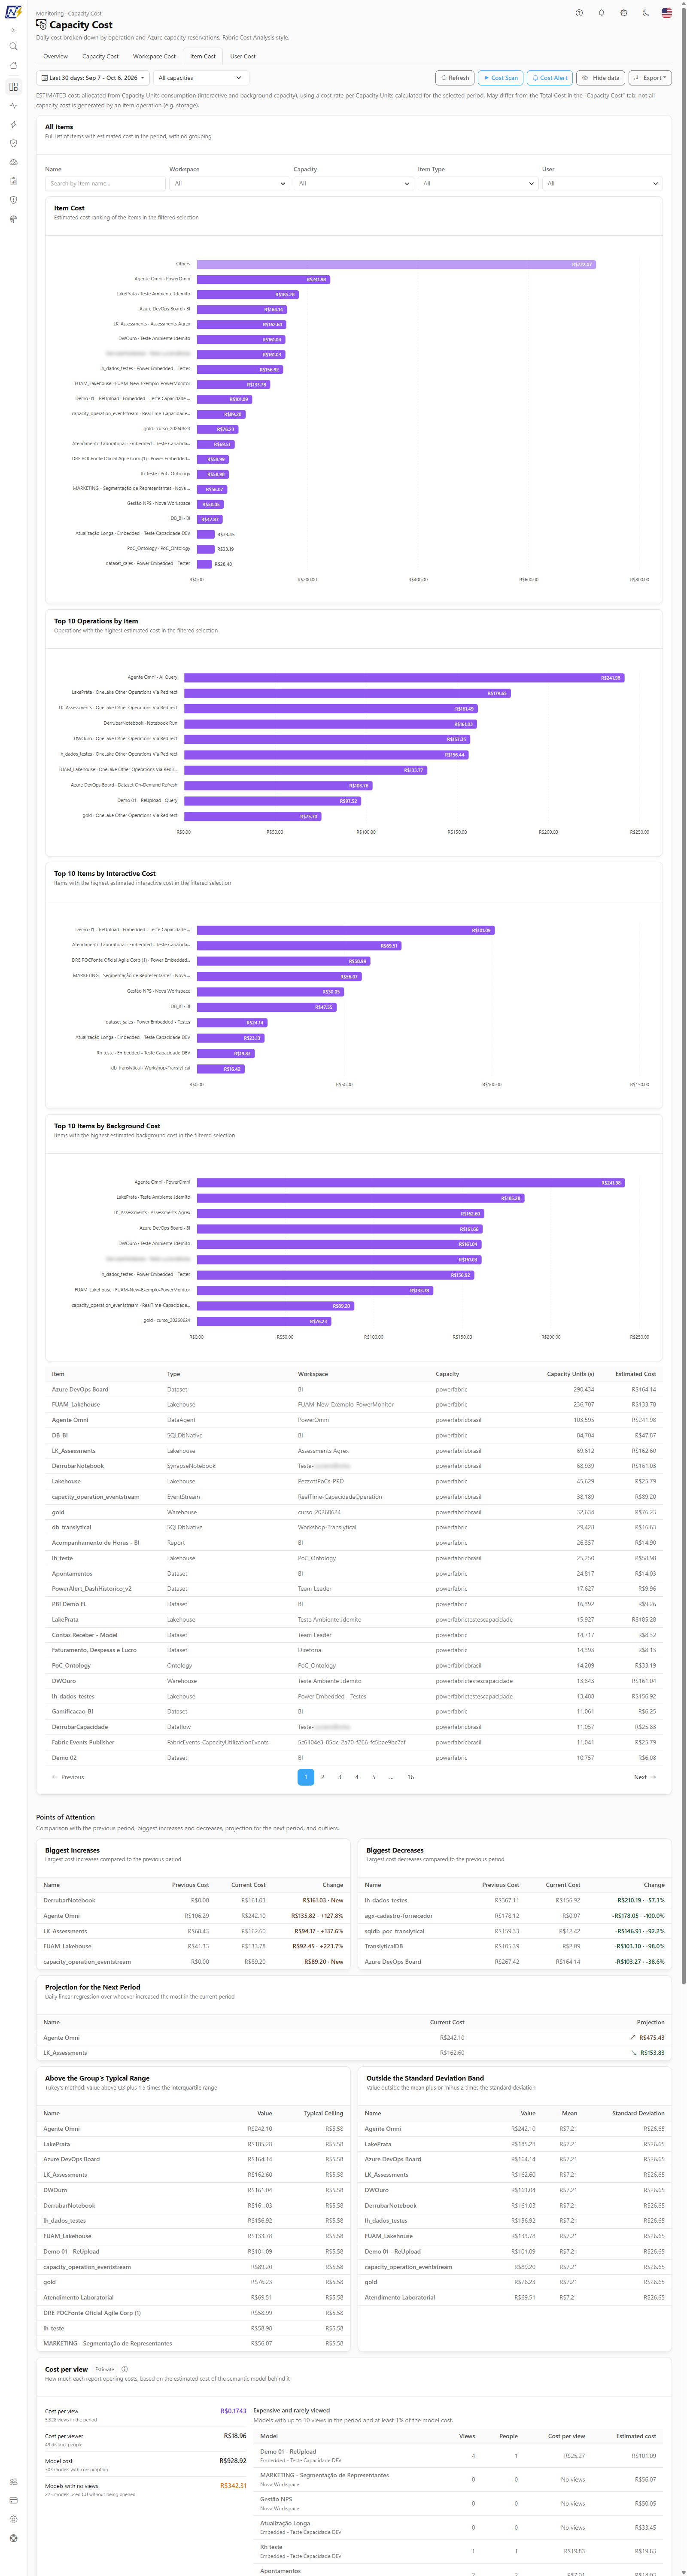
**What it is:** the **Item Cost** tab, with the complete list (**All Items**) of items with estimated cost in the period, without grouping, paginated (25 per page), and charts on the filtered selection.

**What it is for:** finding the report, model, notebook or pipeline that costs the most and measuring the effect of an optimization.

<figure><picture><source srcset="/files/bFwFmUZi3tJWyqGqrwDx" media="(prefers-color-scheme: dark)"><img src="https://3938213054-files.gitbook.io/~/files/v0/b/gitbook-x-prod.appspot.com/o/spaces%2FH2bFRBmIfyK3kwVKbldl%2Fuploads%2Fgit-blob-0b86e2d8b7d26b95fb350e8bbfa5e7f85922bb81%2Fpm-dashboards-custo-capacidade-aba-item-en.png?alt=media" alt="Item Cost tab with filters and the items table"></picture><figcaption><p>Item Cost tab</p></figcaption></figure>

**How to use:**

1. Use the **Name** ("Search by item name..."), **Workspace**, **Capacity**, **Item Type** and **User** filters. The counter shows "{n} of {total} items".
2. Click **Clear filters** to return to the full list.
3. Navigate through the table pages (the **Items per page** selector changes the page size) and check the **Item Cost** (ranking), **Top 10 Operations by Item**, **Top 10 Items by Interactive Cost** and **Top 10 Items by Background Cost** charts, all on the filtered selection.

**How it works:** **Item**, **Item ID**, **Type**, **Workspace**, **Capacity**, **Capacity Units (s)** and **Estimated Cost** columns. Items already removed from the tenant appear as "Name not available". When no item matches the filters, the screen shows "No item matches the selected filters". The **Points of Attention** are at the end of the tab.

### Item Cost: cost per view and cost of failures

**What it is:** two cards at the end of the **Item Cost** tab.

| Card                    | What it answers                                                                                 | Main information                                                                                                                                                                                              |
| ----------------------- | ----------------------------------------------------------------------------------------------- | ------------------------------------------------------------------------------------------------------------------------------------------------------------------------------------------------------------- |
| **Cost per view**       | How much each report opening costs, based on the estimated cost of the semantic model behind it | **Cost per view**, **Cost per viewer**, **Model cost**, **Models with no views** and the **Expensive and rarely viewed** list with **Model**, **Views**, **People**, **Cost per view** and **Estimated cost** |
| **Cost of failed runs** | How much CU was spent on runs that ended in failure, without delivering a result                | **Cost of failures**, **Share of estimated cost**, **Items with failures**, **Items that spent the most on failures** and the cost by workspace                                                               |

**How it works:**

* **Cost per view** divides the estimated cost of each semantic model by the number of times the reports linked to it were opened or exported in the period, according to the activity log. The **Expensive and rarely viewed** ranking lists models with up to 10 views that account for at least 1% of the models' cost (top 10).
* If the **activity log** is stopped or starts after the beginning of the period, the split by views is not shown (or comes with a warning), so it does not look artificially high.
* The **cost of failures** adds up the CU of failed runs recorded by the Capacity Metrics App, multiplied by the cost per CU of each item's capacity. Runs that failed without recording CU count in the quantity, but not in the cost.

### User Cost

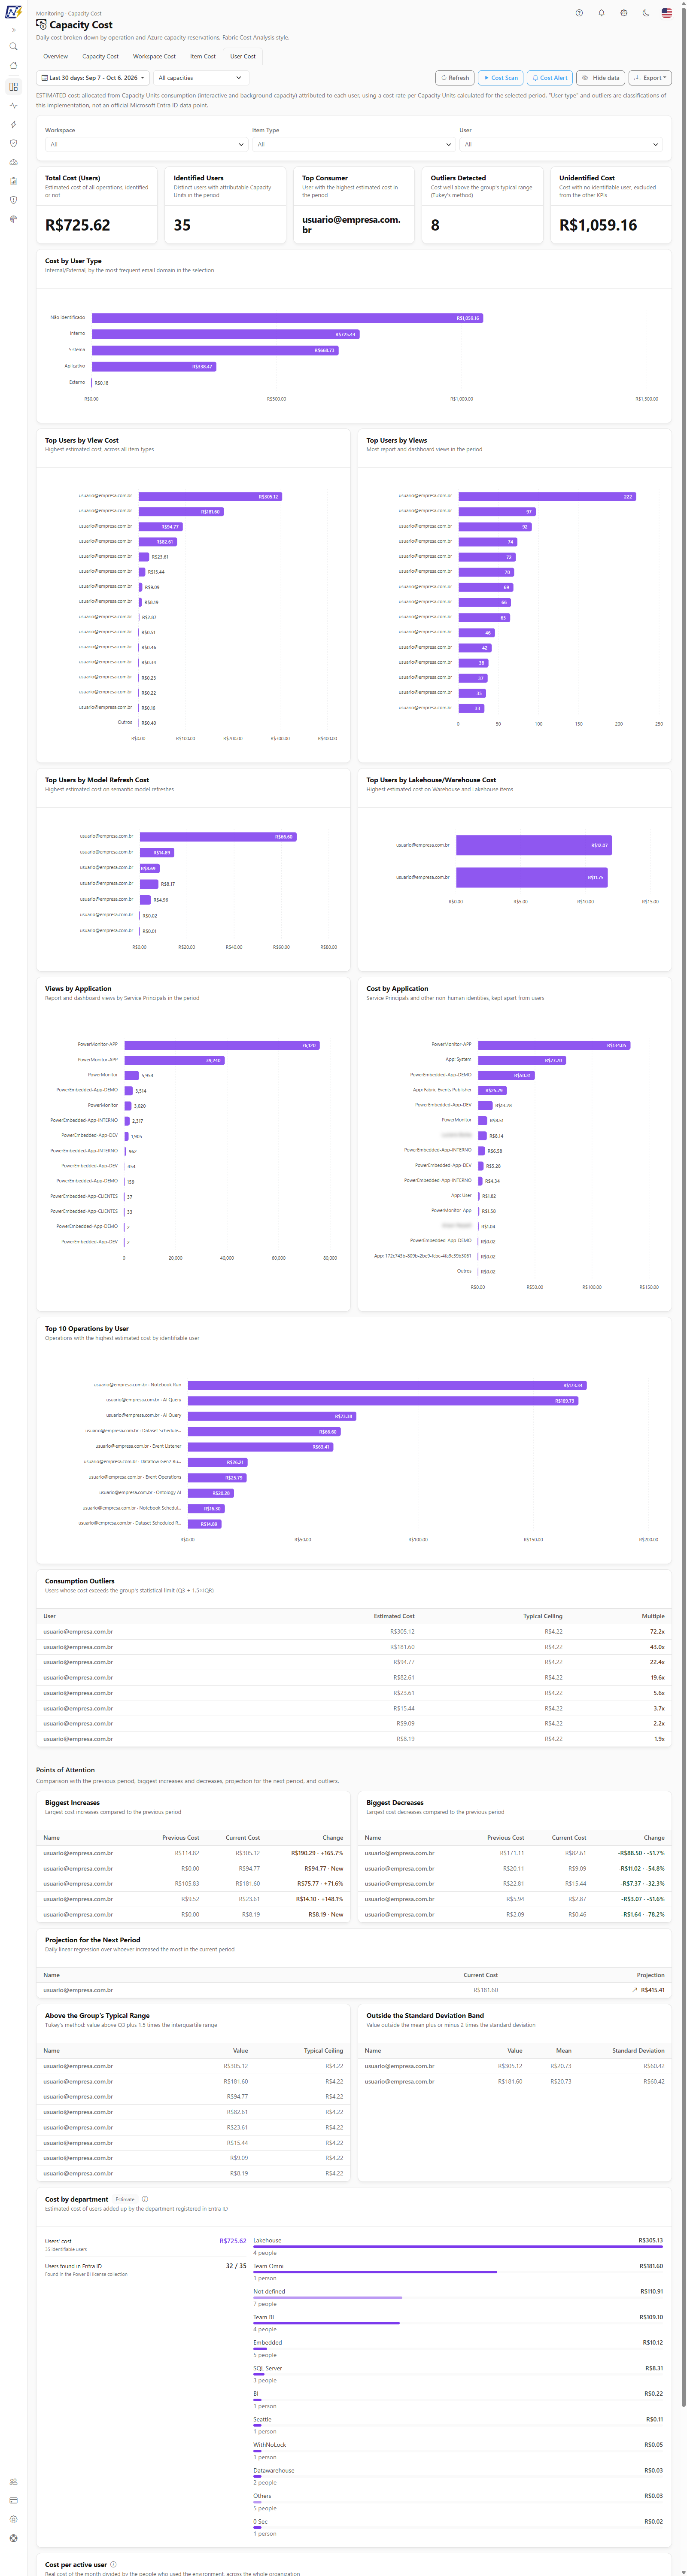
**What it is:** the **User Cost** tab, with KPIs, rankings and the table of consumption outliers per person.

**What it is for:** identifying who generates the most cost (in views, model refreshes, Lakehouse/Warehouse) and users outside the norm, as well as the cost of applications (service principals).

<figure><picture><source srcset="/files/AbEMqxOUN6ZAec0cgWcc" media="(prefers-color-scheme: dark)"><img src="https://3938213054-files.gitbook.io/~/files/v0/b/gitbook-x-prod.appspot.com/o/spaces%2FH2bFRBmIfyK3kwVKbldl%2Fuploads%2Fgit-blob-c99fca199221004c2006b5962c5bb420f1feb187%2Fpm-dashboards-custo-capacidade-aba-usuario-en.png?alt=media" alt="User Cost tab with KPIs and rankings"></picture><figcaption><p>User Cost tab</p></figcaption></figure>

Before the KPIs there are three searchable multi-select filters: **Workspace**, **Item Type** and **User**, plus the **Clear filters** link when any is active. The rankings on this tab show the top 15 of each (the rest under **Others**); **Top 10 Operations by User** shows 10.

| KPI                    | Meaning                                                                   |
| ---------------------- | ------------------------------------------------------------------------- |
| **Total Cost (Users)** | Estimated cost of all operations, with or without an identified user.     |
| **Identified Users**   | Distinct users with attributable Capacity Units in the period.            |
| **Top Consumer**       | User with the highest estimated cost.                                     |
| **Outliers Detected**  | Users with a cost well above the group's typical range (Tukey's method).  |
| **Unidentified Cost**  | Cost of operations with no identifiable user, kept out of the other KPIs. |

Charts: **Cost by User Type** (Internal/External, by the most frequent e-mail domain in the selection; also Application, System and Unidentified), **Top Users by View Cost**, **Top Users by Views**, **Top Users by Model Refresh Cost**, **Top Users by Lakehouse/Warehouse Cost**, **Cost by Application** (service principals and non-human identities), **Views by Application** and **Top 10 Operations by User**.

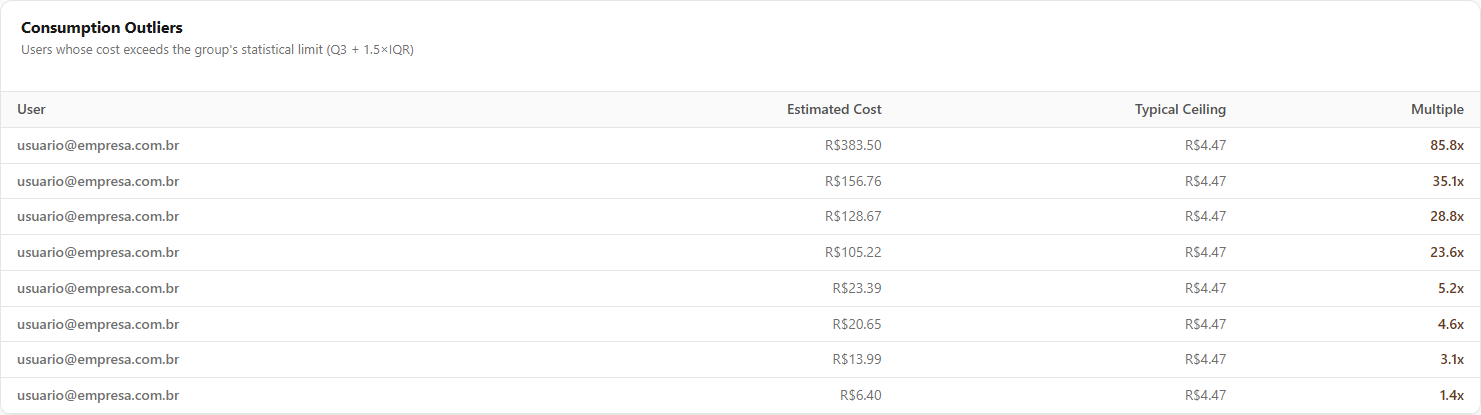
<figure><picture><source srcset="/files/qHbyS8hL94kXrzLtgAtU" media="(prefers-color-scheme: dark)"><img src="https://3938213054-files.gitbook.io/~/files/v0/b/gitbook-x-prod.appspot.com/o/spaces%2FH2bFRBmIfyK3kwVKbldl%2Fuploads%2Fgit-blob-181763052a080138dec1e7ce8216f60fb76e387a%2Fpm-dashboards-custo-capacidade-outliers-usuarios-en.png?alt=media" alt="Consumption Outliers table"></picture><figcaption><p>Consumption Outliers table</p></figcaption></figure>

**Consumption Outliers table:** users whose cost exceeds the group's statistical limit (Q3 + 1.5 × IQR), with **User**, **Estimated Cost**, **Typical Ceiling** and **Multiple** (how many times the limit was exceeded).

{% hint style="info" %}
"User type" and outliers are classifications calculated by Power Monitor, not official Microsoft Entra ID data. Be careful when sharing this tab: it displays people's e-mails.
{% endhint %}

### User Cost: by department and per active user

**What it is:** two cards at the end of the **User Cost** tab.

| Card                     | What it answers                                                           | Main information                                                                                                                                   |
| ------------------------ | ------------------------------------------------------------------------- | -------------------------------------------------------------------------------------------------------------------------------------------------- |
| **Cost by department**   | How much each department costs, adding up the estimated cost of its users | **Users' cost**, **Users found in Entra ID** and the cost by department (top 10, the rest under **Others**; with no registration, **Not defined**) |
| **Cost per active user** | How much each person who used the environment costs                       | The **Last closed month**, the **Change from the previous month** and the **Cost per active user, month by month** chart for the last 6 months     |

**How it works:**

* The **department** comes from Entra ID, obtained in the Power BI license collection, and the user is matched by e-mail. The card shows **only totals by department, never people**. Without the license collection, the screen tells you to run it.
* **Cost per active user** divides the **real** cost of the month (all capacities) by the number of different people who opened any content in the month, according to the activity log. It does not follow the tab filters or the capacity filter, because the log does not say in which capacity each person consumed.

### Points of Attention

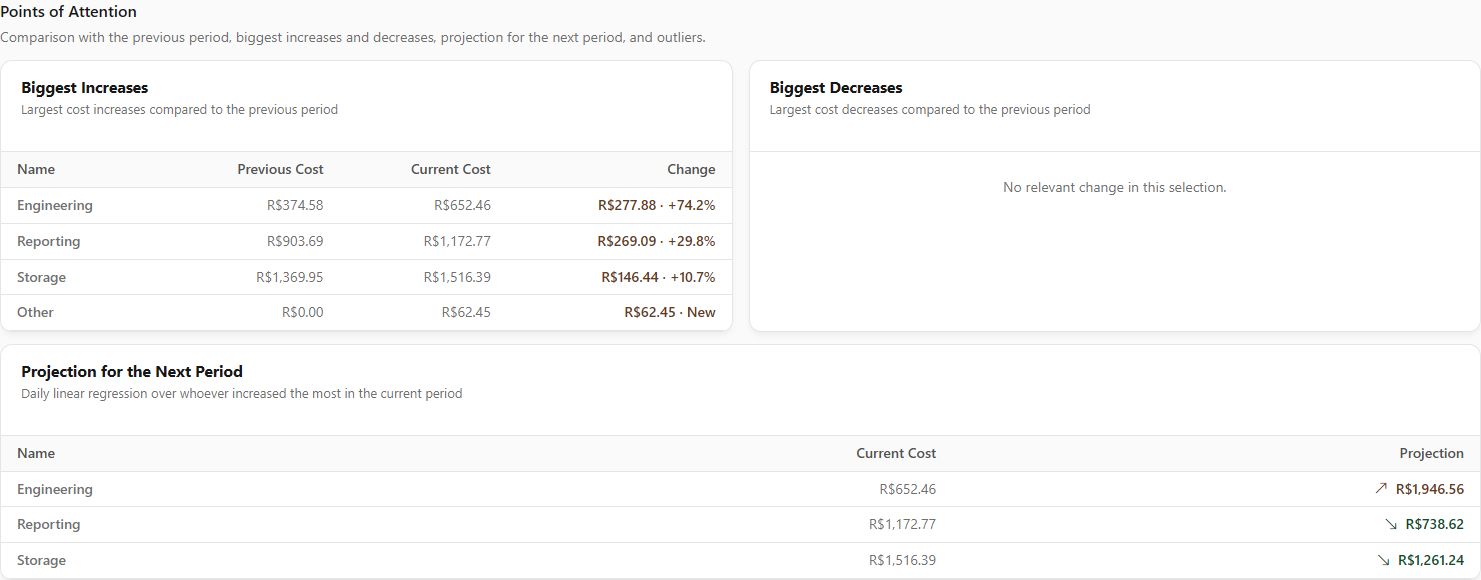
**What it is:** a section at the end of every tab, which compares the current period with the previous period of the same length, within the tab's scope (capacities, workspaces, items or users).

**What it is for:** calling attention to deviations without having to compare charts manually.

<figure><picture><source srcset="/files/TRWtYpzGx3uNDRaLHWEt" media="(prefers-color-scheme: dark)"><img src="https://3938213054-files.gitbook.io/~/files/v0/b/gitbook-x-prod.appspot.com/o/spaces%2FH2bFRBmIfyK3kwVKbldl%2Fuploads%2Fgit-blob-e6e4e24f1ebc3b0e897da8c4f1d20ddb1240238a%2Fpm-dashboards-custo-capacidade-pontos-atencao-en.png?alt=media" alt="Points of Attention section with biggest increases, decreases and projection"></picture><figcaption><p>Points of Attention</p></figcaption></figure>

| Block                                         | Content                                                                                                                                 |
| --------------------------------------------- | --------------------------------------------------------------------------------------------------------------------------------------- |
| **Biggest Increases** / **Biggest Decreases** | Largest cost increases and reductions, with **Previous Cost**, **Current Cost** and **Change** (**New** when there was no cost before). |
| **Projection for the Next Period**            | Daily linear regression on those that increased the most in the current period (includes the **Total Environment Cost**).               |
| **Above the Group's Typical Range**           | Outliers by Tukey's method (above Q3 + 1.5 × interquartile range), with the **Typical Ceiling**.                                        |
| **Outside the Standard Deviation Band**       | Values outside the mean ± 2 standard deviations band, with **Average** and **Standard Deviation**.                                      |

**How it works:** when there is nothing relevant, the section shows "Nothing unusual in this selection."

### Cost Alerts

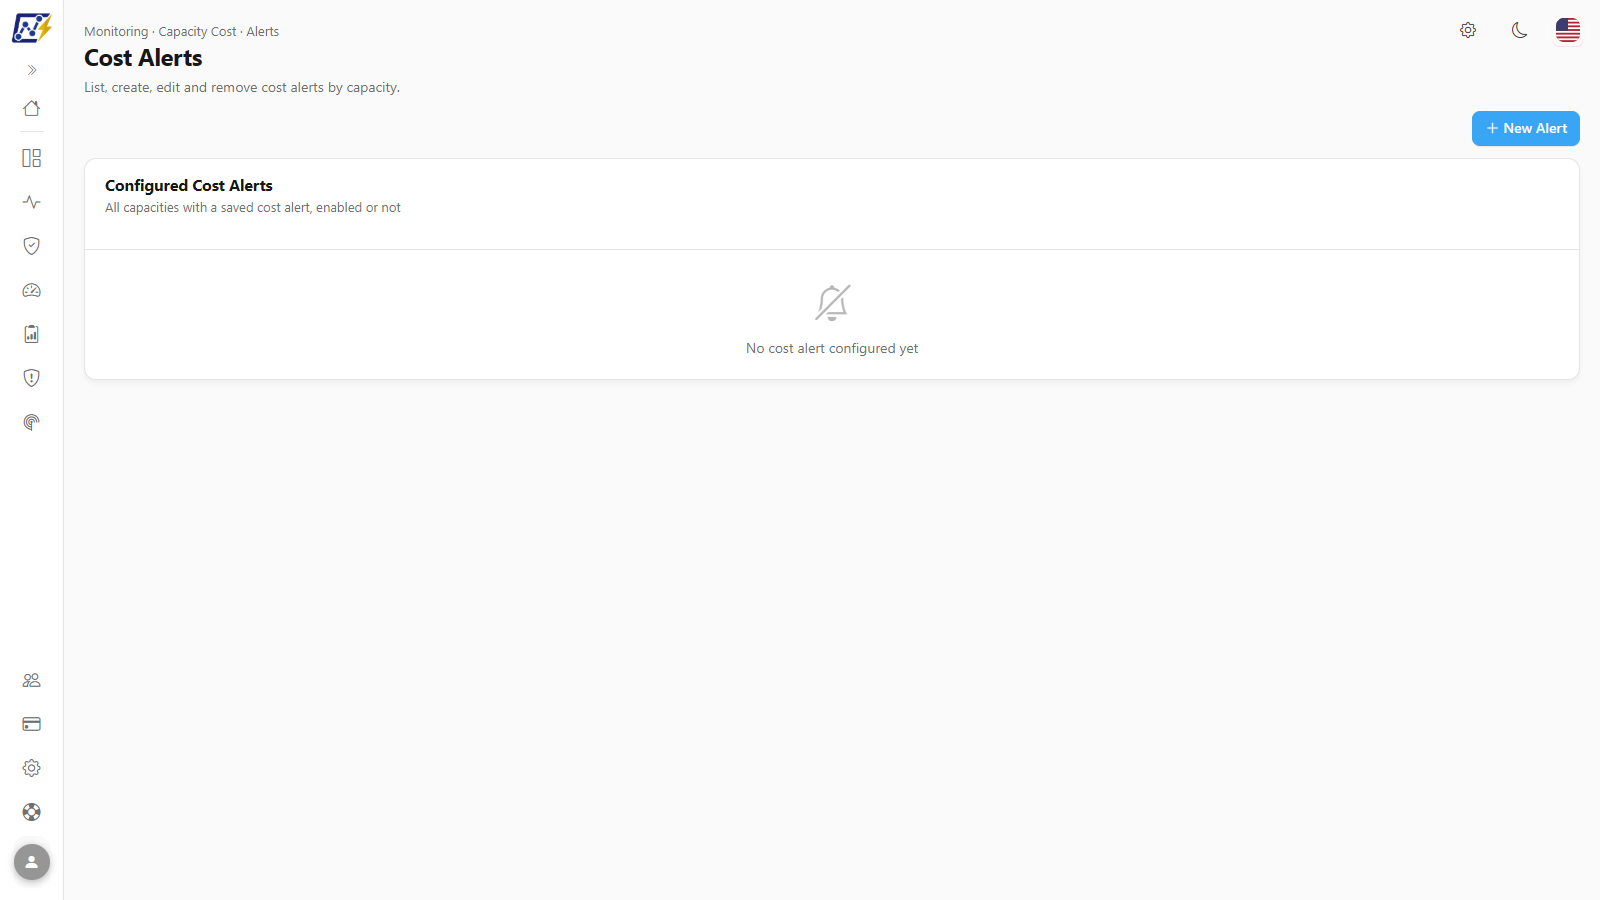
**What it is:** the **Cost Alerts** page, opened by the **Cost Alert** button (its own route, with no menu item). The **Configured Cost Alerts** table lists all capacities with a saved cost alert, enabled or not. Reading is open to everyone; creating, editing and removing are exclusive to administrators.

**What it is for:** receiving an e-mail when a day's cost exceeds the recent average by more than the defined limit.

<figure><picture><source srcset="/files/w2xwjNcf4aadTC9NWwkv" media="(prefers-color-scheme: dark)"><img src="https://3938213054-files.gitbook.io/~/files/v0/b/gitbook-x-prod.appspot.com/o/spaces%2FH2bFRBmIfyK3kwVKbldl%2Fuploads%2Fgit-blob-6eacc10c54c40f2e8f283a9827cb037a3b6e2668%2Fpm-dashboards-custo-capacidade-alertas-en.png?alt=media" alt="Cost Alerts page with the table of configured alerts"></picture><figcaption><p>Cost Alerts</p></figcaption></figure>

| Column                 | Description                                             |
| ---------------------- | ------------------------------------------------------- |
| **Capacity**           | Capacity of the alert, or **All capacities**.           |
| **SKU**                | Capacity SKU.                                           |
| **Average Daily Cost** | Daily average of the last 30 days.                      |
| **Threshold**          | Percentage above the average that triggers the alert.   |
| **Status**             | **Active** or **Inactive**.                             |
| **Notifications**      | **Administrators** and/or number of additional e-mails. |
| *(action)*             | **Edit** opens the modal.                               |

### Create a cost alert

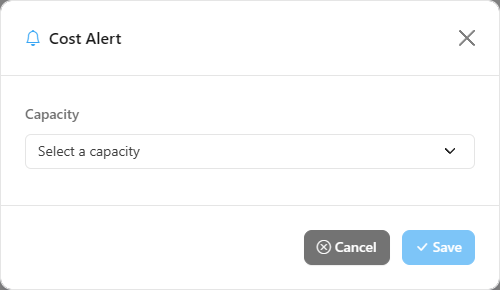
**What it is:** the **Cost Alert** modal, opened by **New Alert** (or **Edit**).

<figure><picture><source srcset="/files/sJe6BvDo3DIeJZTxjzEo" media="(prefers-color-scheme: dark)"><img src="https://3938213054-files.gitbook.io/~/files/v0/b/gitbook-x-prod.appspot.com/o/spaces%2FH2bFRBmIfyK3kwVKbldl%2Fuploads%2Fgit-blob-3938612d59b15d6acecedbfe3568a505481cda27%2Fpm-dashboards-custo-capacidade-modal-alerta-en.png?alt=media" alt="Cost Alert modal with capacity, threshold and recipients"></picture><figcaption><p>Cost Alert modal</p></figcaption></figure>

| Field                                                                   | Description                                                                                                                                                                                                          |
| ----------------------------------------------------------------------- | -------------------------------------------------------------------------------------------------------------------------------------------------------------------------------------------------------------------- |
| **Capacity**                                                            | Capacity to monitor, or **All capacities**: applies the same limit to **each** monitored capacity individually and triggers a separate alert for each one that exceeds it; it never adds up the cost of all of them. |
| **SKU** / **Daily average (last 30 days)**                              | Informational. With no cost recorded in the last 30 days, the screen warns that the alert will take effect when there is enough data.                                                                                |
| **Trigger alert when yesterday's cost goes above (% over the average)** | Threshold between **1% and 1000%**. The tip shows the currency amount that triggers the alert ("With the current value, the alert triggers above {limit} for the day").                                              |
| **Alert enabled**                                                       | Turns it on/off without deleting the configuration.                                                                                                                                                                  |
| **Alert recipients**                                                    | **Notify system administrators** and/or **Notify other people** (with the list of **Additional e-mails**). At least one recipient is required.                                                                       |
| **Remove alert**                                                        | Deletes the configuration, after confirmation.                                                                                                                                                                       |

**How to use:** prerequisite: **Administrator** profile. Only capacities with monitoring active are evaluated.

{% stepper %}
{% step %}

### Open the alerts page

In the filter bar, click **Cost Alert**.
{% endstep %}

{% step %}

### Start a new alert

Click **New Alert**. The **Cost Alert** modal opens.
{% endstep %}

{% step %}

### Choose the capacity

In **Capacity**, select a capacity or **All capacities** (the same limit applies to each capacity, individually). Check the **SKU** and the **Daily average (last 30 days)**.
{% endstep %}

{% step %}

### Define the threshold

In **Trigger alert when yesterday's cost goes above (% over the average)**, enter a value between 1% and 1000%. The tip shows the currency amount that triggers the alert.
{% endstep %}

{% step %}

### Choose the recipients

In **Alert recipients**, check **Notify system administrators** and/or **Notify other people**. In **Additional e-mails**, type an e-mail and press **Enter** for each recipient. At least one recipient is required.
{% endstep %}

{% step %}

### Save

Keep **Alert enabled** turned on and click **Save**. The message *"Cost alert saved successfully."* confirms the save, and the alert appears in the table.
{% endstep %}
{% endstepper %}

### Edit, disable or remove a cost alert

**What it is:** maintenance of saved alerts, through the **Edit** button on each row. Prerequisite: **Administrator** profile.

**How to use:**

1. On the **Cost Alerts** page, click **Edit** on the alert's row.
2. To **change** it, adjust the threshold or the recipients and click **Save**.
3. To **disable** it without losing the configuration, turn off **Alert enabled** and click **Save**. The status changes to **Inactive**.
4. To **remove** it, click **Remove alert** and confirm with **Remove alert** in the question *"Remove this cost alert?"*. This action cannot be undone.

### Monthly budget

**What it is:** the **Monthly budget** section, on the **Cost Alerts** page, with the **real cost per month** limit and the e-mail alert when the cost or the forecast gets close to the limit.

**What it is for:** controlling the month's spending without opening the dashboard every day.

<figure><picture><source srcset="/files/n20rNSIsCIi5YbqKbTA1" media="(prefers-color-scheme: dark)"><img src="https://3938213054-files.gitbook.io/~/files/v0/b/gitbook-x-prod.appspot.com/o/spaces%2FH2bFRBmIfyK3kwVKbldl%2Fuploads%2Fgit-blob-e607dbb55c0a96e2829c7d16a9c8796cca94123c%2Fpm-dashboards-custo-capacidade-orcamento-en.png?alt=media" alt="Monthly budget section with the budgets table and the New budget modal"></picture><figcaption><p>Monthly budget</p></figcaption></figure>

**Who uses it:** the page is open to everyone, but **creating, editing and removing** budgets is exclusive to **Administrators**; non-administrators see the list without the buttons.

| Column             | Description                                                                                                                                                    |
| ------------------ | -------------------------------------------------------------------------------------------------------------------------------------------------------------- |
| **Scope**          | A specific capacity or **All capacities**                                                                                                                      |
| **Monthly budget** | The amount, in the organization's currency. A budget saved in another currency appears converted, with the tooltip "Converted from *original amount*" on hover |
| **Status**         | **Active** or **Inactive**                                                                                                                                     |
| **Recipients**     | **Administrators** and/or the number of additional e-mails                                                                                                     |

**How to create one:**

{% stepper %}
{% step %}
In *Dashboards › Capacity Cost*, click **Cost Alert** and go to the **Monthly budget** section.
{% endstep %}

{% step %}
Click **New budget**. In the modal, choose the **Scope** (a capacity or all) and enter the **Monthly amount**.
{% endstep %}

{% step %}
Keep **Alert active** on and choose **Who receives the alert**: **System administrators** and/or **Other people** (type the e-mail and press **Enter**). At least one recipient is required.
{% endstep %}

{% step %}
Click **Save**. The e-mail will be sent in the organization's default language (*Settings › Organization*).
{% endstep %}
{% endstepper %}

**Edit and remove:** use **Edit** on the budget row to change the amount, the recipients or to turn the alert on/off. In the modal, **Remove** opens the question *"Remove budget?"* (the budget alert is no longer evaluated) and requires confirmation.

**How it works:**

* The amount is compared with the **real cost** of the [Month close](#capacity-cost-month-close-and-budget) card (the same as the Total Cost KPI, including the spread of CSP reservations).
* There are three alerts: month cost through yesterday at **80%** of the budget, at **100%** of the budget and **month-end forecast above the budget**. Each type is sent at most **once a month**, in the daily evaluation at **11:00 UTC**; when the 100% one is pending, the 80% notice is omitted to avoid noise.
* There can be one budget per capacity and one for all capacities. Changing the amount or the currency lets the alert fire again in the same month.
* A capacity budget is only evaluated while the capacity exists and is monitored. If the cost currency differs from the budget currency (for example, because the organization's currency changed after the budget was saved), the budget is converted at the exchange rate of the evaluation day. Only when there is no exchange rate is the evaluation skipped and the card asks you to save the budget again.
* The budget e-mail does not create an alert in the [Alerts](/en/power-monitor/monitoramento/alertas.md) list, is not sent to Teams, Slack or Telegram and does not appear in *Settings › Notifications*.

### Monthly report by e-mail

**What it is:** the **Monthly report by e-mail** section, on the same page, which sends a summary of the previous month's cost in the first days of each month. It is **off by default**.

**What it is for:** keeping managers informed without platform access.

<figure><picture><source srcset="/files/S1p0SN8F4XVfojzqpypN" media="(prefers-color-scheme: dark)"><img src="https://3938213054-files.gitbook.io/~/files/v0/b/gitbook-x-prod.appspot.com/o/spaces%2FH2bFRBmIfyK3kwVKbldl%2Fuploads%2Fgit-blob-e3b57d40906ea5e5aeb0dc94d8121a129abf46cf%2Fpm-dashboards-custo-capacidade-relatorio-mensal-en.png?alt=media" alt="Monthly report by e-mail section with the Send the monthly report switch and the recipients"></picture><figcaption><p>Monthly report by e-mail</p></figcaption></figure>

**How to use (Administrators only):**

1. Turn on **Send the monthly report**.
2. In **Who receives it**, select **System administrators** and/or **Other people** (e-mails typed with **Enter**). A recipient is only required while sending is on.
3. Click **Save**. The section shows **Last sent** (or *Not sent yet*).

**What the e-mail brings:** the **previous month's total** and the comparison with the month before it, the **highest-cost capacities** (real cost), the **highest-cost workspaces** (estimated) and the cost by **owner** and **criticality** (estimated, when metadata is defined). Each ranking lists up to 5 items; sections in a currency different from the close currency are left empty, so currencies are never mixed.

**How it works:** sending happens **only once a month**, on **days 1 to 3** (in the organization's calendar), after the cost collection and the alert evaluation. If no cost is recorded, nothing is sent. The e-mail goes out in the organization's default language (defined in *Settings › Organization*) and, like the budget, does not go through Alerts or chat channels.

## Rules and behavior

### Cost and reservation collection

* Collection runs **once a day, at 05:27 (Brasília time, UTC-3)**, for each subscription with the permission granted. It can also be triggered by an administrator in *Mapping › Capacity and cost › Capacity Cost*.
* On the first collection, Power Monitor fetches up to **180 days** of history. On subsequent ones, it fetches the new days and **always reprocesses the last 7 days**, because Azure still adjusts recent values.
* Cost is read in the **amortized** model: the value of reservations appears distributed across the days and the capacity that consumed them, instead of zeroed out.
* The cost day is the **UTC day** reported by Azure. The Cost Management API has low query quotas; in case of throttling, collection is retried later.

### Currency

* All values are displayed in the **organization's currency** (defined in the organization's registration).
* Costs billed in another currency are **converted and added up**, using public daily exchange rates synchronized once a day. Each day's cost is converted at **that day's** exchange rate.
* A currency with no exchange rate at all is left **out of the sum**, and the badge "Amounts in *currencies* were not added up because no exchange rate is available" warns which ones were left out.
* Amounts converted from another currency (for example, a budget saved before the organization's currency changed) show, on hover, the tooltip "Converted from *original amount* (rate *rate* on *date*)".
* The conversion applies to **all tabs**: both the actual cost (**Capacity Cost**, **Reservations**) and the costs estimated by allocation (**Overview**, **Workspace Cost**, **Item Cost** and **User Cost**).
* If the organization has no currency defined, or if **no** currency in the period can be converted, Power Monitor uses only the costs in the period's **predominant currency**, in the original currency, without converting the others.

### Estimated cost (allocation)

For each capacity, Power Monitor divides the total cost of the period by the total Capacity Units consumed in the same period, obtaining a **cost rate per Capacity Units**, and applies this rate to the consumption of each item and user (data from the Capacity Metrics App). Reservations are included in the total cost used for the rate. Before the calculation, costs and reservations billed in another currency are converted to the organization's currency (see [Currency](#currency)).

### Cost alerts

* Evaluated **once a day, at 08:00 (Brasília time, UTC-3)**, after the cost collection.
* Compares the cost of the **previous day (UTC)** with the daily average of the **30 days before it**. The average considers only days with recorded cost (days without collection do not count as zero cost).
* Triggers when `yesterday's cost > average × (1 + threshold/100)`. Without history, it never triggers.
* Each capacity generates at most **one alert per day**. The alert is recorded in *Monitoring › Alerts* and sent by e-mail to the chosen recipients. Administrators can turn off receiving it in *Settings › Notifications*.
* Only capacities with **monitoring active** are evaluated.

## Frequently asked questions

<details>

<summary>The screen is empty. What should I check?</summary>

Confirm in *Settings › Additional Permissions* whether the **Capacity Cost** card shows **Granted** for all subscriptions and whether collection has already run (*Mapping › Capacity and cost › Capacity Cost*). Capacities on shared capacity, PPU or trial have no cost in Azure.

</details>

<details>

<summary>Why is the sum of the cost per item different from the Total Cost?</summary>

The cost per item is an estimate proportional to Capacity Units consumption. Part of the capacity cost (for example, storage or idle capacity) is not generated by item operations.

</details>

<details>

<summary>The reservations do not appear.</summary>

In CSP contracts, reservation details stay with the partner; Power Monitor shows what it can identify via Cost Management. In EA/MCA, check whether the Service Principal has read access to reservations (for example, **Reservations Reader**).

</details>

<details>

<summary>Yesterday's cost does not appear yet.</summary>

Azure may take hours to consolidate a day's cost, and collection runs once a day. The last 7 days are always reprocessed, so recent values may change slightly.

</details>

## Related pages

* [Dashboards](/en/power-monitor/dashboards.md)
* [Capacity Dashboard](/en/power-monitor/dashboards/dashboard-de-capacidade.md)
* [Capacity Overview](/en/power-monitor/dashboards/visao-geral-de-capacidades.md)
* [Efficiency Dashboard](/en/power-monitor/dashboards/dashboard-de-eficiencia.md)
* [Alerts](/en/power-monitor/monitoramento/alertas.md)
* [Settings](/en/power-monitor/configuracoes.md)
* [Capacities (Governance)](/en/power-monitor/governanca/infraestrutura/capacidades.md)


---

# Agent Instructions
This documentation is published with GitBook. GitBook is the documentation platform designed so that both humans and AI agents can read, navigate, and reason over technical content effectively. Learn more at gitbook.com.

## Querying This Documentation
If you need additional information that is not directly available in this page, you can query the documentation by asking a question.

Perform an HTTP GET request on the following URL with the `ask` and `goal` query parameters:

```
GET https://docs.powermonitor.com.br/en/power-monitor/dashboards/custo-de-capacidade.md?ask=<question>&goal=<user_goal>
```

`ask` is the immediate question: it should be specific, self-contained, and written in natural language.
`goal` is what the user is ultimately trying to achieve, the reason they need the answer. Sharing it helps GitBook give you a better, more relevant answer. A goal is most helpful when it describes the outcome the user wants rather than restating the question. For example, with `ask=how do I create an API token`, a goal like `automate deployments from our CI pipeline` lets GitBook tailor the answer to that use case.

The response will contain a direct answer to the question and relevant excerpts and sources from the documentation.

Use this mechanism when the answer is not explicitly present in the current page, you need clarification or additional context, or you want to retrieve related documentation sections.