> For the complete documentation index, see [llms.txt](https://docs.powermonitor.com.br/llms.txt). Markdown versions of documentation pages are available by appending `.md` to page URLs; this page is available as [Markdown](https://docs.powermonitor.com.br/en/power-monitor/dashboards/dashboard-de-governanca.md).

# Governance Dashboard

Governance overview of the monitored workspaces: inventory, permissions, audit activity, administration concentration, external access and infrastructure, on a single screen.

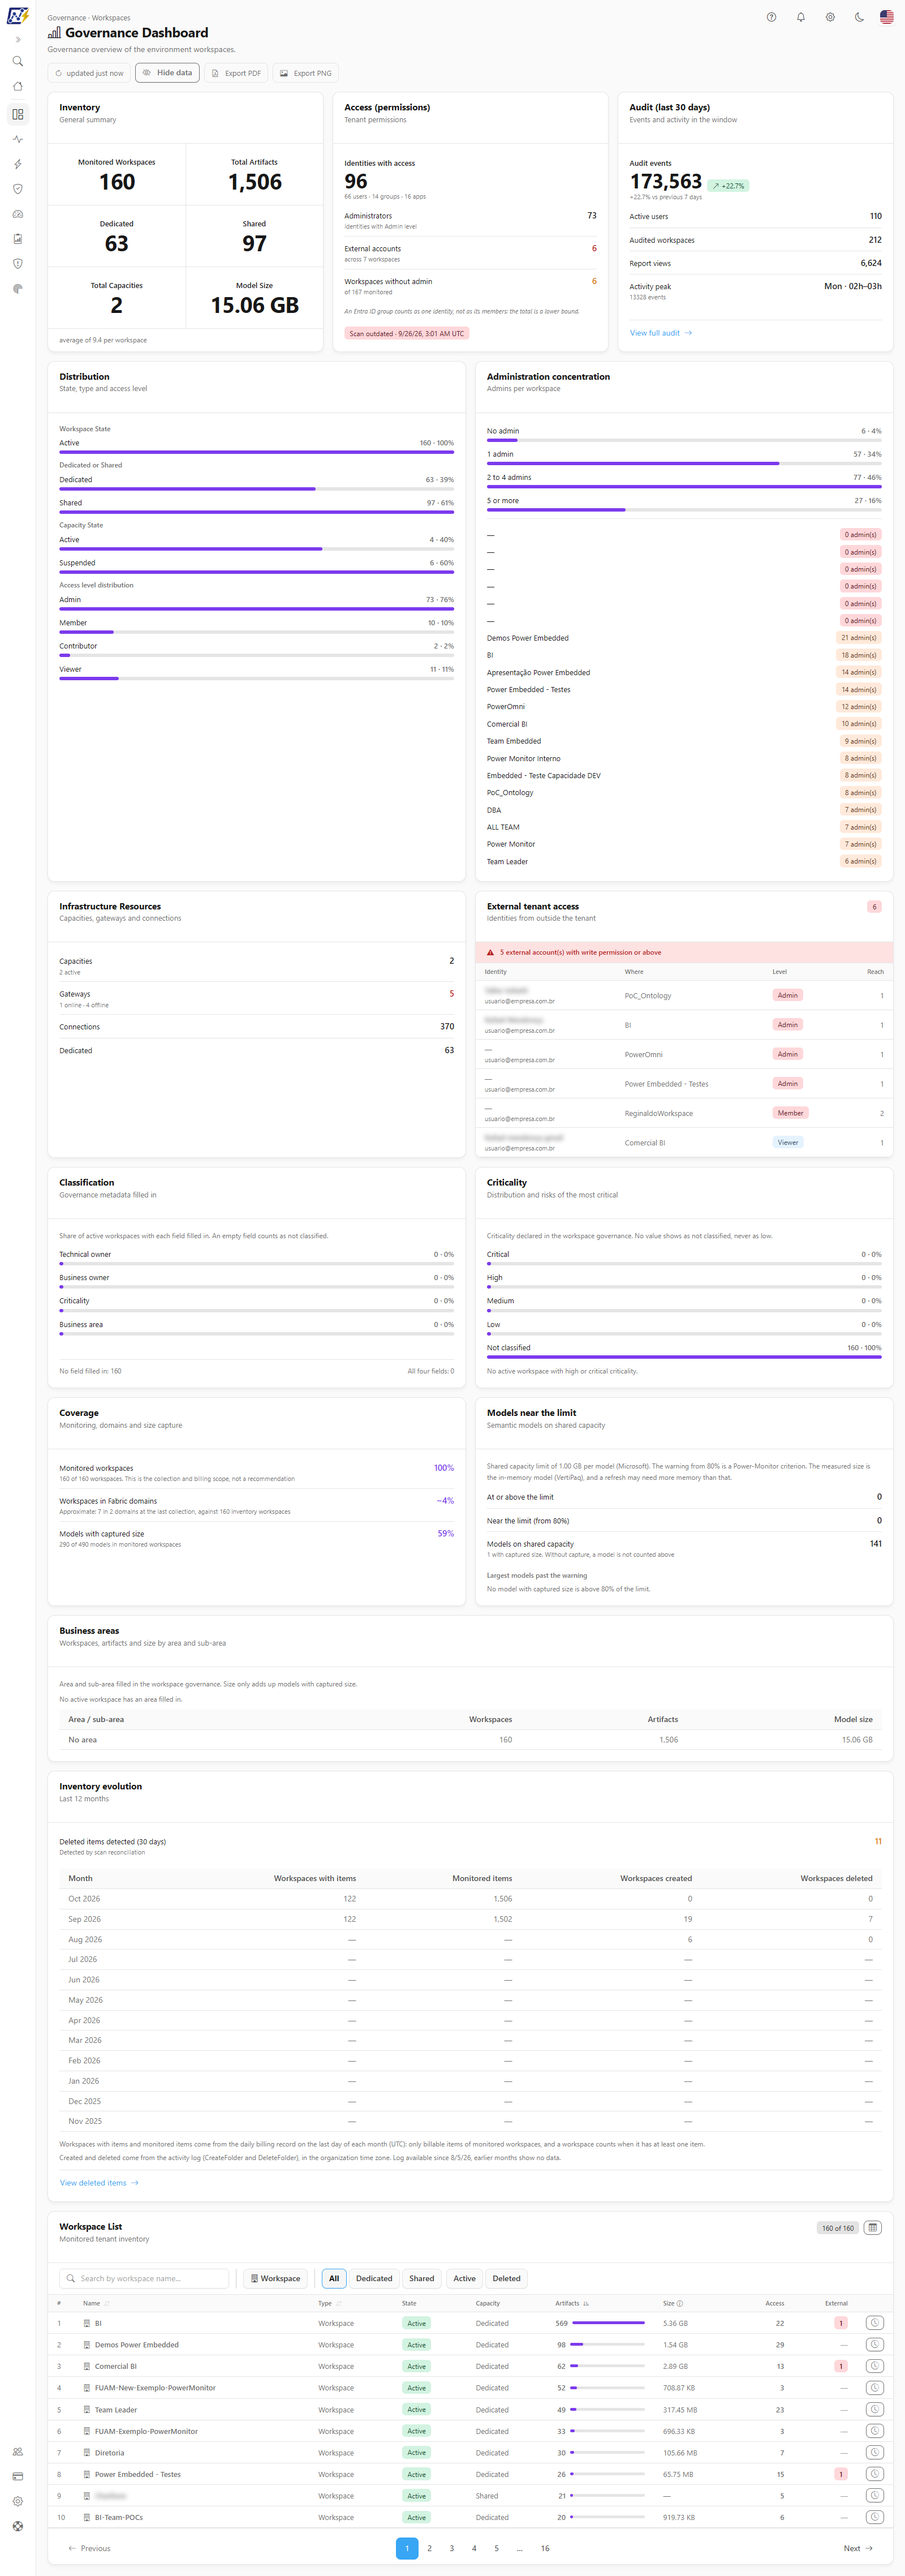
The **Governance Dashboard** brings together, on one page, the numbers that someone responsible for Microsoft Fabric and Power BI governance needs to track about the environment's workspaces: how many there are and where they are hosted, who has access and at what level, how many have been left without an administrator, which external accounts have access and how active the environment is according to the audit.

**How to access:** menu **Dashboards › Governance Dashboard**.

**Who can access:** all user profiles. The screen is read-only: nothing on it changes permissions, workspaces or capacities. The numbers respect the user's **workspace scope** (those with visibility restricted to some workspaces see only their data), and an administrator can **block the page** for specific users on the [Users](/en/power-monitor/usuarios.md) screen.

<figure><picture><source srcset="/files/DczMo8Ep1plZppZ5L23f" media="(prefers-color-scheme: dark)"><img src="https://3938213054-files.gitbook.io/~/files/v0/b/gitbook-x-prod.appspot.com/o/spaces%2FH2bFRBmIfyK3kwVKbldl%2Fuploads%2Fgit-blob-2e81e5774485e2b3ef0b6154d85be72e7977d92c%2Fpm-dashboards-governanca-en.png?alt=media" alt="Governance Dashboard with the Inventory, Access and Audit cards in the first row"></picture><figcaption><p>Governance Dashboard</p></figcaption></figure>

## What it is for

* **Accountability audit:** identifying workspaces **without any administrator** and workspaces with **too many administrators**, two classic signs of weak governance.
* **External access review:** finding out which guest accounts (B2B) have access to the workspaces and, above all, which have **write or higher** permission.
* **Environment hygiene:** finding active workspaces with **no activity** recorded in the last 30 days, candidates for archiving or cleanup.
* **Executive view:** presenting in a meeting or report the size of the environment (workspaces, artifacts, capacities, gateways, connections) and the distribution between dedicated and shared capacity, exporting the page as PDF or PNG.

The page is organized in rows: at the top, the attention banner (when there are inactive workspaces) and the **Inventory**, **Access (permissions)** and **Audit (last 30 days)** cards; then **Distribution** and **Administration concentration**; next **Infrastructure Resources** and **External tenant access**; then the [Governance indicators](#governance-indicators) (**Classification** and **Criticality**; **Coverage** and **Models near the limit**; **Business areas**; **Inventory evolution**); and finally the **Workspace List**.

## Features

### Refresh the data

**What it is:** the button with the refresh icon in the header. Its label shows how long ago the screen was loaded ("updated just now", "updated X min ago", "updated X h ago") and is recalculated every 30 seconds.

**What it is for:** reloading the numbers after a correction made in the Fabric/Power BI portal or when the screen has been open for a long time.

<figure><picture><source srcset="/files/GSg7QEW5wPrXOTbdG340" media="(prefers-color-scheme: dark)"><img src="https://3938213054-files.gitbook.io/~/files/v0/b/gitbook-x-prod.appspot.com/o/spaces%2FH2bFRBmIfyK3kwVKbldl%2Fuploads%2Fgit-blob-825635c3bc2806b80239d2fa0bd154d0fbec306e%2Fpm-interface-exportar-dashboard-en.png?alt=media" alt="Governance Dashboard header with the refresh button and the Export PDF and Export PNG buttons"></picture><figcaption><p>Header with refresh and export</p></figcaption></figure>

**How to use:**

1. In the header, click the refresh button (for example, *"updated 12 min ago"*). The icon spins while the data is reloaded.
2. Inventory, access and audit are reloaded in parallel. If a section fails, the others remain visible and a message indicates which part did not load.

**How it works:** the button rereads the data Power Monitor has already collected; it does not trigger a new collection in Microsoft Fabric. Changes made in the portal only appear after the next run of the [Mapping › Inventory › Inventory](/en/power-monitor/mapeamento/inventarios.md) (inventory and permissions) or the next activity event collection (audit).

### Export PDF and Export PNG

**What it is:** the **Export PDF** and **Export PNG** buttons in the header, which generate a file of the entire page as it is on the screen.

**What it is for:** attaching the governance overview to a monthly report, committee minutes or an executive presentation.

**How to use:**

{% stepper %}
{% step %}

### Prepare the screen

Apply to the **Workspace List** the filters and page that should appear in the file. Widen the window if the table has horizontal scrolling.
{% endstep %}

{% step %}

### Export

In the header, click **Export PDF** or **Export PNG**. While the file is being generated, the button shows **Exporting…** and both buttons are disabled. The `dashboard-governanca-AAAA-MM-DD` file is downloaded by the browser.
{% endstep %}

{% step %}

### Share carefully

The file includes names and e-mails of external accounts, unless **Hide data** is on. Review it before sending it outside the organization.
{% endstep %}
{% endstepper %}

**How it works:** the file reproduces the entire page, including the title, the filters and the current page of the workspace list. The header buttons (refresh and export) do not appear in the exported file.

### Hide data

**What it is:** the **Hide data** button in the header (it becomes **Show data** when on), next to **Export PDF** and **Export PNG**.

**What it is for:** sharing the screen, taking a screenshot or exporting the page without exposing people's names and e-mails.

**How to use:** click **Hide data**. The name and e-mail of the accounts in the **External tenant access** card appear masked (only the end letters are kept), on screen and in the **Export PDF** and **Export PNG** files. Click **Show data** to go back to normal. The button does not appear in exported files.

**How it works:** the button masks the display; it is not an access control. The choice applies to the other screens that have the same button.

### Attention banner: workspaces with no activity

**What it is:** the **Attention · governance** banner at the top of the page, with the message "*N* workspaces with no activity for +30d" and the **View full list** button.

**What it is for:** calling attention to **active** workspaces that have not generated **any audit event** in the last **30 days**, candidates for archiving, owner review or cleanup.

**How to use:**

1. If there are active workspaces without audit events in the last 30 days, the banner appears at the top of the page.
2. Click **View full list**. The [Workspaces](/en/power-monitor/governanca/workspaces.md) screen opens already filtered by the workspaces that were inactive in that window.

**How it works / rules:**

* A workspace is considered to have no activity when it is **Active** and no audit event for it has been recorded in the last 30 days.
* If no workspace is inactive, the banner simply does not appear (the screen never shows "0 workspaces with no activity").
* The banner depends on the audit reading: if it is not available, the banner does not appear either.

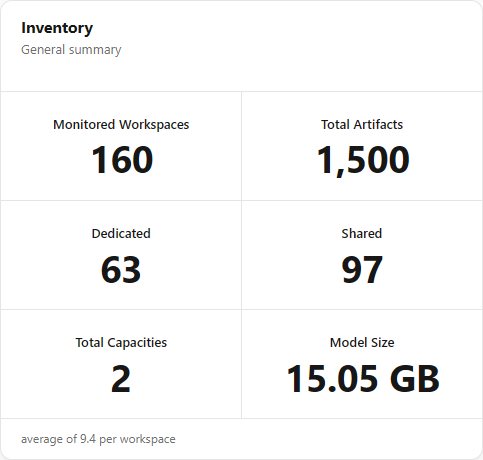
### Inventory card

**What it is:** the **Inventory** card (*General summary*), with six indicators of the size of the monitored environment.

**What it is for:** quickly answering "how many workspaces and artifacts do we monitor, where are they hosted and how much space do the semantic models take up".

<figure><picture><source srcset="/files/RvUCtTZAjUmVrUilrYbn" media="(prefers-color-scheme: dark)"><img src="https://3938213054-files.gitbook.io/~/files/v0/b/gitbook-x-prod.appspot.com/o/spaces%2FH2bFRBmIfyK3kwVKbldl%2Fuploads%2Fgit-blob-2e78a976102ad13a463842e47d573ceac7293e81%2Fpm-dashboards-governanca-inventario-en.png?alt=media" alt="Inventory card with Monitored Workspaces, Total Artifacts, Dedicated, Shared, Total Capacities and Model Size"></picture><figcaption><p>Inventory card</p></figcaption></figure>

| Indicator                | Meaning and calculation                                                                                                                                                                          |
| ------------------------ | ------------------------------------------------------------------------------------------------------------------------------------------------------------------------------------------------ |
| **Monitored Workspaces** | Number of workspaces of type *Workspace* (personal workspaces are not included) marked as monitored in Power Monitor.                                                                            |
| **Total Artifacts**      | Sum of all inventoried artifacts (reports, semantic models, lakehouses, notebooks etc.). It is the same total displayed on the [Dashboard](/en/power-monitor/dashboards/dashboard-principal.md). |
| **Dedicated**            | Workspaces hosted on dedicated capacity (Fabric, Power BI Embedded or Premium Per User).                                                                                                         |
| **Shared**               | Workspaces on shared capacity (Pro/Shared).                                                                                                                                                      |
| **Total Capacities**     | Number of capacities monitored by Power Monitor.                                                                                                                                                 |
| **Model Size**           | Sum of the size of the semantic models of all workspaces. Only exists for workspaces on dedicated capacity; shows "—" while no model has had its size collected.                                 |

**How to use:** read the indicators; they are not clickable. In the card footer, **average of&#x20;*****X*****&#x20;per workspace** shows the average number of artifacts per workspace (one decimal place below 10, whole number above).

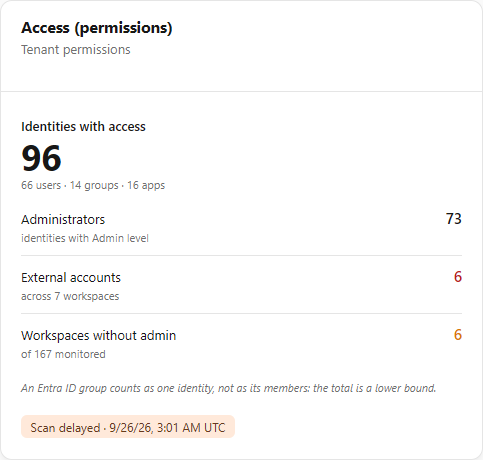
### Access (permissions) card

**What it is:** the **Access (permissions)** card (*Tenant permissions*), with the aggregated view of who has access to the monitored workspaces.

**What it is for:** measuring the size of the access surface and quickly detecting the two most common audit findings: external accounts and workspaces without an administrator.

<figure><picture><source srcset="/files/ZR8hu6G03RK4NV84mNEu" media="(prefers-color-scheme: dark)"><img src="https://3938213054-files.gitbook.io/~/files/v0/b/gitbook-x-prod.appspot.com/o/spaces%2FH2bFRBmIfyK3kwVKbldl%2Fuploads%2Fgit-blob-d501f5b82344eb97ad5beafab59079105667d97d%2Fpm-dashboards-governanca-acessos-en.png?alt=media" alt="Access card with Identities with access, Administrators, External accounts, Workspaces without admin and the collection freshness badge"></picture><figcaption><p>Access (permissions) card</p></figcaption></figure>

| Indicator                    | Meaning and calculation                                                                                                                                                                                                                                                                  |
| ---------------------------- | ---------------------------------------------------------------------------------------------------------------------------------------------------------------------------------------------------------------------------------------------------------------------------------------- |
| **Identities with access**   | Number of distinct identities (users, groups and applications) with any permission on at least one monitored workspace. Below it, the breakdown "*N* users · *N* groups · *N* apps". The sum of the breakdown may be lower than the total when the API reports an unknown identity type. |
| **Administrators**           | Identities with the **Admin** level on at least one workspace.                                                                                                                                                                                                                           |
| **External accounts**        | Guest identities with access, and in how many workspaces they appear ("across *N* workspaces"). The number is red when it is greater than zero.                                                                                                                                          |
| **Workspaces without admin** | Monitored workspaces with no identity at the Admin level, "of *N* monitored". It is highlighted (amber) when greater than zero.                                                                                                                                                          |

{% hint style="info" %}
A Microsoft Entra ID group counts as **one** identity, not as the number of its members. For this reason, whenever there are groups with access, the card displays the caveat that the total is a **lower bound**. To see the reach of the groups, use the [Permissions Dashboard](/en/power-monitor/dashboards/dashboard-de-permissoes.md).
{% endhint %}

**How to use:** check the four indicators and the badge in the card footer, which indicates the **freshness of the permissions collection**, with the date and time of the last collection (in UTC):

| Badge                             | When it appears                                        |
| --------------------------------- | ------------------------------------------------------ |
| **Scan up to date** (green)       | The last permissions collection is up to 24 hours old. |
| **Scan delayed** (amber)          | The last collection is between 24 and 72 hours old.    |
| **Scan outdated** (red)           | The last collection is more than 72 hours old.         |
| **No permission scan yet** (gray) | No permission has been collected yet.                  |

**How it works:** the permissions come from the [Mapping › Inventory › Inventory](/en/power-monitor/mapeamento/inventarios.md). The same person with access to several workspaces counts only once.

#### How to find and fix workspaces without an administrator

{% stepper %}
{% step %}

### See the size of the problem

In the **Access (permissions)** card, check the **Workspaces without admin** indicator. In the **Administration concentration** card, the **No admin** band shows the same count and its percentage.
{% endstep %}

{% step %}

### Identify the workspaces

In the list below the bars of the **Administration concentration** card, the workspaces with a red *"0 admin(s)"* badge are the ones without an owner. Those with an amber badge have 5 or more administrators.
{% endstep %}

{% step %}

### Fix it in the portal

In the Fabric/Power BI portal, open the workspace and assign the **Admin** role to a named corporate account or a security group. Power Monitor does not change permissions.
{% endstep %}

{% step %}

### Confirm after the next collection

After the next run of the Mapping › Inventory › Inventory, click the refresh button in the header. The workspace leaves the **No admin** band. Check the collection freshness badge in the footer of the Access card.
{% endstep %}
{% endstepper %}

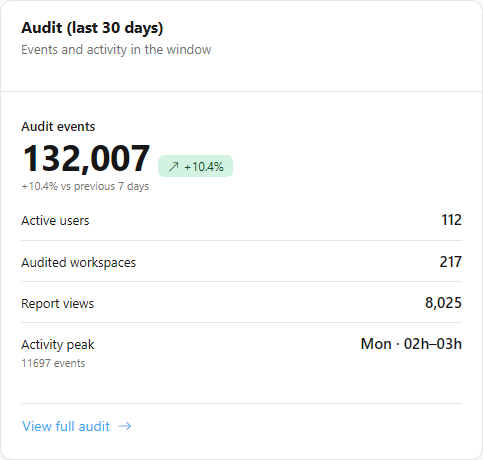
### Audit (last 30 days) card

**What it is:** the **Audit (last 30 days)** card (*Events and activity in the window*), with the summary of the Power BI / Fabric activity events collected by Power Monitor.

**What it is for:** tracking whether the environment is being used, whether activity is growing or falling and at what time it is concentrated.

<figure><picture><source srcset="/files/1k6dwUDu8ooiAJvCv5ur" media="(prefers-color-scheme: dark)"><img src="https://3938213054-files.gitbook.io/~/files/v0/b/gitbook-x-prod.appspot.com/o/spaces%2FH2bFRBmIfyK3kwVKbldl%2Fuploads%2Fgit-blob-f2454e83f5521838656eb3883c976258e442d0eb%2Fpm-dashboards-governanca-auditoria-en.png?alt=media" alt="Audit card with Audit events and trend, Active users, Audited workspaces, Report views and Activity peak"></picture><figcaption><p>Audit (last 30 days) card</p></figcaption></figure>

| Indicator              | Meaning and calculation                                                                                                                                                                                                                              |
| ---------------------- | ---------------------------------------------------------------------------------------------------------------------------------------------------------------------------------------------------------------------------------------------------- |
| **Audit events**       | Total events in the **last 7 days**. The badge next to it compares with the previous 7 days (e.g.: "+12%" in green, "-8%" in red), with the caption "vs previous 7 days". When there were no events in the previous period, the badge shows **new**. |
| **Active users**       | Distinct users who generated at least one event in the last 30 days.                                                                                                                                                                                 |
| **Audited workspaces** | Distinct workspaces with at least one event in the last 30 days.                                                                                                                                                                                     |
| **Report views**       | Number of report view events in the last 30 days.                                                                                                                                                                                                    |
| **Activity peak**      | Day of the week and one-hour slot with the most events in the last 30 days (e.g.: "Tue · 14h–15h"), with the number of events at that time. With no events, it shows "no data".                                                                      |

**How to use:** click **View full audit**, in the card footer, to open the [Events Overview](/en/power-monitor/auditoria/geral-de-eventos.md) screen and investigate the events individually.

**How it works:** the events come from the tenant's **Activity Events** collection. If collection is paused or delayed, the numbers reflect only what has already been collected.

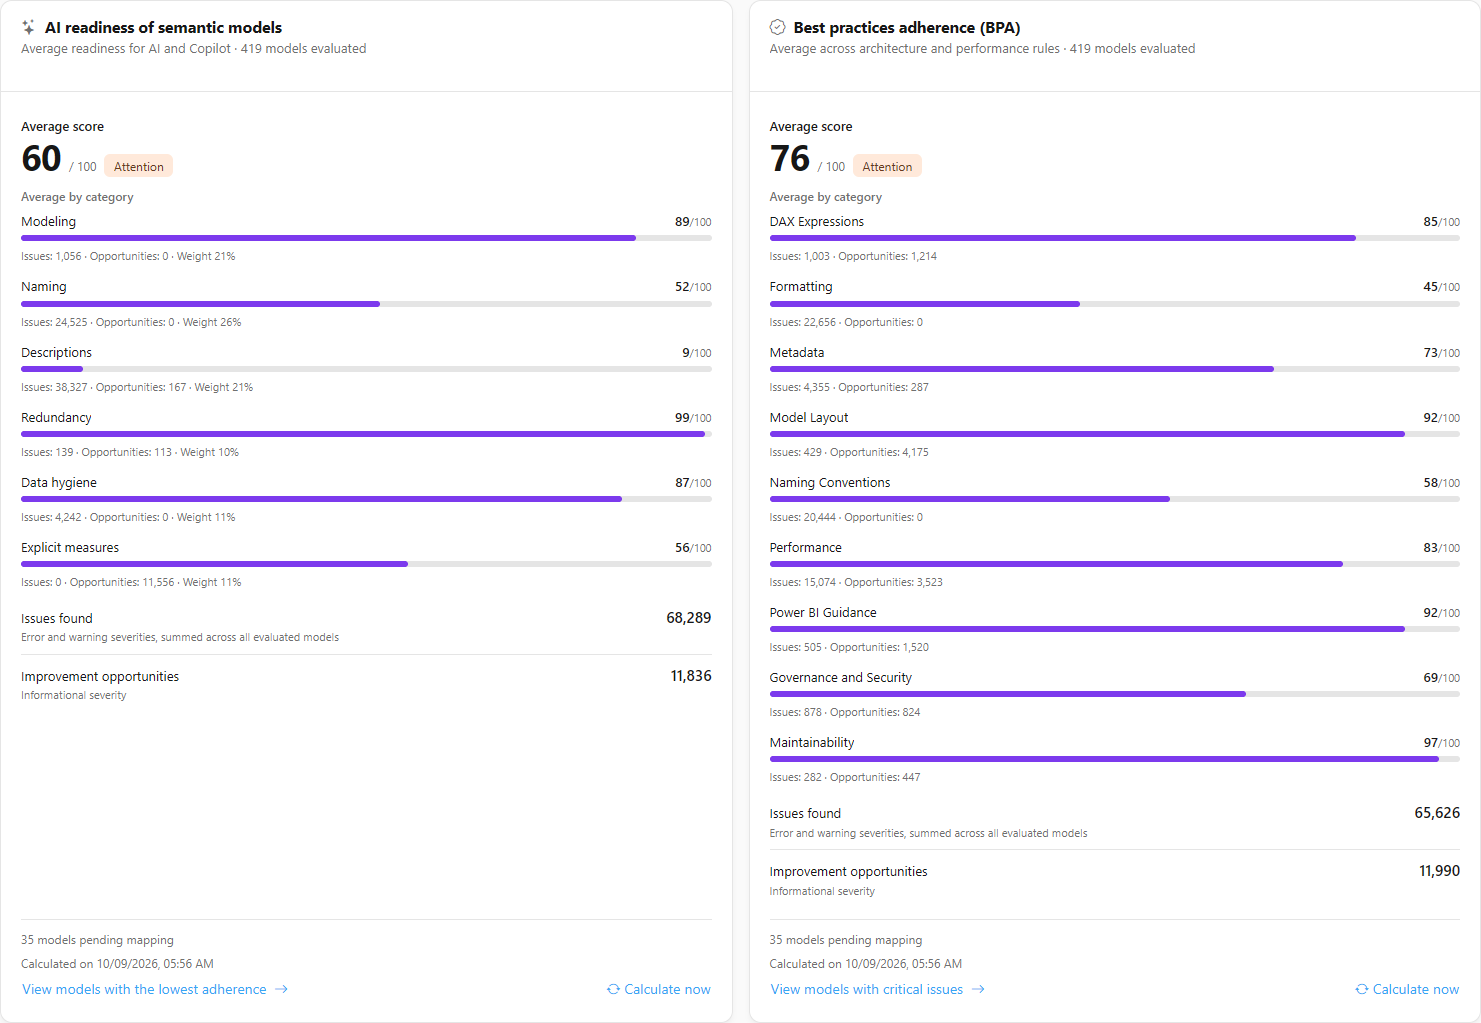
### Semantic model adherence (AI and BPA)

**What it is:** two cards right below the first row: **AI readiness of semantic models** (*Average readiness for AI and Copilot · N models evaluated*) and **Best practices adherence (BPA)** (*Average across architecture and performance rules · N models evaluated*).

**What it is for:** knowing, in a single number, how ready the environment's semantic models are for AI and Copilot and how closely they follow architecture and performance best practices, and where the biggest problems are.

<figure><picture><source srcset="/files/6plmVyGfyTCNVmQV7Nte" media="(prefers-color-scheme: dark)"><img src="https://3938213054-files.gitbook.io/~/files/v0/b/gitbook-x-prod.appspot.com/o/spaces%2FH2bFRBmIfyK3kwVKbldl%2Fuploads%2Fgit-blob-879f117f336184508b4803ce952f946d77480abf%2Fpm-dashboards-governanca-aderencia-en.png?alt=media" alt="AI readiness of semantic models and Best practices adherence (BPA) cards with the average score, the status, the average by category, the issues and the opportunities"></picture><figcaption><p>Average AI and BPA adherence cards</p></figcaption></figure>

**How it works:**

| Part of the card              | What it shows                                                                                                                                                                                                                                                                                            |
| ----------------------------- | -------------------------------------------------------------------------------------------------------------------------------------------------------------------------------------------------------------------------------------------------------------------------------------------------------- |
| **Average score**             | Average of the scores of the evaluated models, from 0 to 100, with the **Healthy** (80 or more), **Attention** (60 to less than 80) or **Critical** (below 60) badge                                                                                                                                     |
| **Average by category**       | The average of each score category, with its weight (*Weight N%*) and *Issues: N · Opportunities: N*                                                                                                                                                                                                     |
| **Issues found**              | Total findings with error and warning severity, summed across all evaluated models                                                                                                                                                                                                                       |
| **Improvement opportunities** | Total findings with informational severity                                                                                                                                                                                                                                                               |
| Footer                        | Models pending mapping, models not calculated yet, the calculation date (*Calculated on date*) and the link to the [Environment Inventory](/en/power-monitor/qualidade-de-dados/inventario-do-ambiente.md): **View models with the lowest adherence** (AI) or **View models with critical issues** (BPA) |

* **Which models are included:** the semantic models of the monitored workspaces. Each model's score is calculated and stored automatically by Power Monitor after the inventory and [Model Mapping](/en/power-monitor/mapeamento/mapeamento-de-modelos.md) scans, and reviewed every 6 hours. A model that has not been mapped yet is left out of the average and counted as pending mapping.
* **Calculate now (Administrator):** when there are models without a calculated score, the card shows the notice and the **Calculate now** button, which requests the calculation without waiting for the next automatic cycle (*Calculation requested. The scores will appear in a few minutes.*). A new request within 10 minutes shows **A calculation was already requested recently.** The button appears only for administrators.
* **Drill-down:** the footer link opens the Environment Inventory filtered by the models counted in the average (*Showing only the models counted in the average adherence*), with the **Show all models** button to return to the full list.

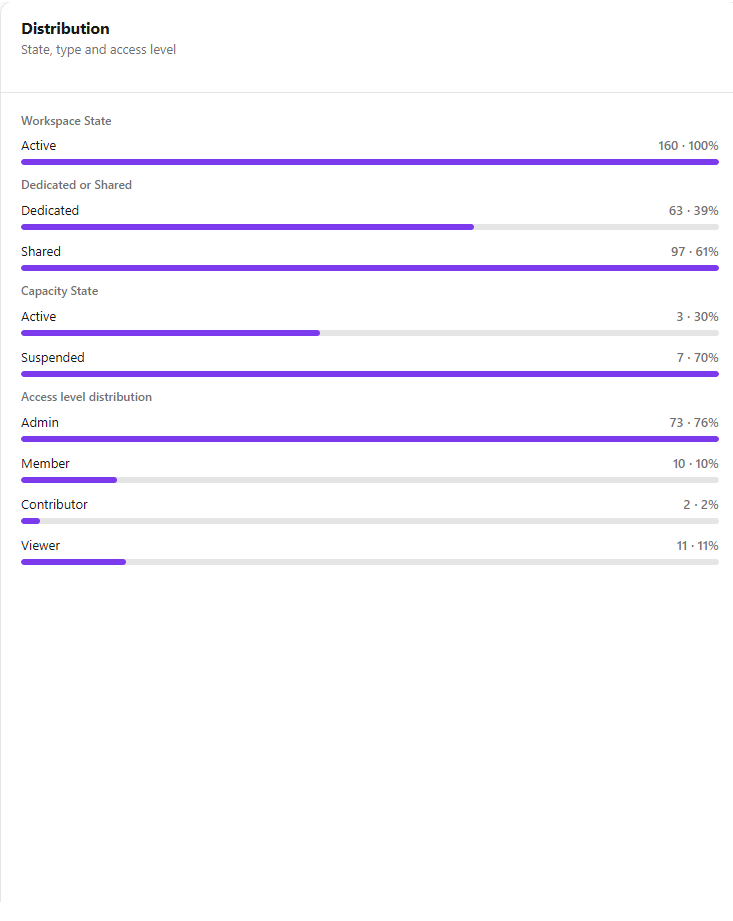
### Distribution card

**What it is:** the **Distribution** card (*State, type and access level*), with four groups of horizontal bars, each bar with quantity and percentage.

**What it is for:** seeing the composition of the environment: how much is active or deleted, how much runs on dedicated capacity, what state the capacities are in and how the access levels are distributed.

<figure><picture><source srcset="/files/6MxvKcJv6y6Mj9ED4vWG" media="(prefers-color-scheme: dark)"><img src="https://3938213054-files.gitbook.io/~/files/v0/b/gitbook-x-prod.appspot.com/o/spaces%2FH2bFRBmIfyK3kwVKbldl%2Fuploads%2Fgit-blob-3073813b5dde8b61a264bc9cd735e514c6262cb0%2Fpm-dashboards-governanca-distribuicao-en.png?alt=media" alt="Distribution card with Workspace State, Dedicated or Shared, Capacity State and Access level distribution"></picture><figcaption><p>Distribution card</p></figcaption></figure>

| Group                         | What it shows                                                                                                                                                                                                                                                                                      |
| ----------------------------- | -------------------------------------------------------------------------------------------------------------------------------------------------------------------------------------------------------------------------------------------------------------------------------------------------- |
| **Workspace State**           | **Active** and **Deleted** workspaces (deleted ones remain in Power Monitor's history).                                                                                                                                                                                                            |
| **Dedicated or Shared**       | Proportion of workspaces on dedicated and shared capacity.                                                                                                                                                                                                                                         |
| **Capacity State**            | Capacities by provisioning state: Active, Suspended, Pre-suspended, Provisioning, Updating SKU, Provision failed, Not activated, Deleting, Deleted, Invalid or Unknown. Only states with at least one capacity appear; with no dedicated capacities, the group displays "No dedicated capacities". |
| **Access level distribution** | Identities by level: Admin, Member, Contributor, Viewer and Other. Each identity is counted **once**, at the **highest** level it has in any workspace (someone who is Admin in one workspace and Viewer in another counts as Admin). Only appears when the access reading is available.           |

**How to use:** read the bars; the percentage of each one is calculated on the total of its own group.

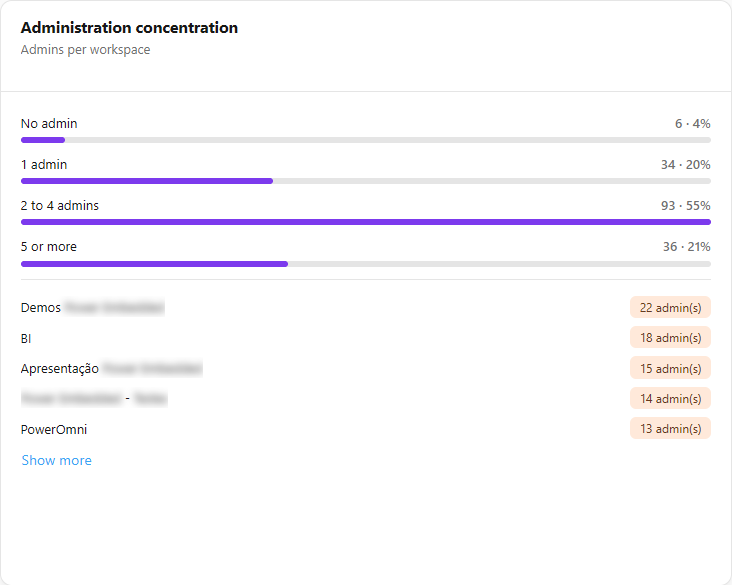
### Administration concentration card

**What it is:** the **Administration concentration** card (*Admins per workspace*), which distributes the monitored workspaces by the number of administrators each one has and lists by name the workspaces with the most administrators.

**What it is for:** finding workspaces with no owner and workspaces with overly dispersed administrative privilege.

<figure><picture><source srcset="/files/UhBUrdUgrqAymzo2HT79" media="(prefers-color-scheme: dark)"><img src="https://3938213054-files.gitbook.io/~/files/v0/b/gitbook-x-prod.appspot.com/o/spaces%2FH2bFRBmIfyK3kwVKbldl%2Fuploads%2Fgit-blob-51af0478a56fc59a95ffcbf2147556354f14dc92%2Fpm-dashboards-governanca-concentracao-en.png?alt=media" alt="Administration concentration card with the No admin, 1 admin, 2 to 4 admins and 5 or more bands, and the list of workspaces at the extremes"></picture><figcaption><p>Administration concentration card</p></figcaption></figure>

| Band              | Interpretation                                                                    |
| ----------------- | --------------------------------------------------------------------------------- |
| **No admin**      | Workspace with no named owner: this is the main finding of this card.             |
| **1 admin**       | Single point of failure: if that person leaves, nobody administers the workspace. |
| **2 to 4 admins** | Range considered healthy.                                                         |
| **5 or more**     | Dispersed administrative privilege.                                               |

**How to use:** below the bars, check the list of the **5 workspaces with the most administrators**, from the highest to the lowest number (amber badge with the number; red *"0 admin(s)"* badge for those without an administrator). Click **Show more** to see the full list of extremes and **Show less** to go back to the first 5. Workspaces without a name are not included in the list. For workspaces without an administrator, follow the correction described in *How to find and fix workspaces without an administrator*.

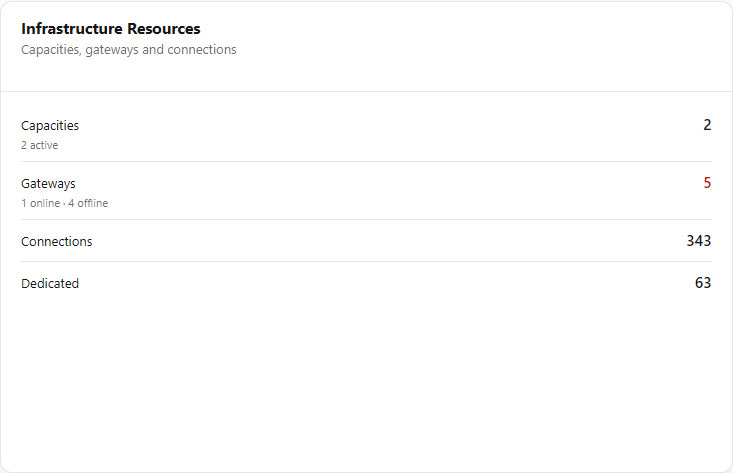
### Infrastructure Resources card

**What it is:** the **Infrastructure Resources** card (*Capacities, gateways and connections*).

**What it is for:** seeing, on the same governance screen, the size and health of the infrastructure that supports the workspaces.

<figure><picture><source srcset="/files/k1KznNUnF9rlkPTu9d14" media="(prefers-color-scheme: dark)"><img src="https://3938213054-files.gitbook.io/~/files/v0/b/gitbook-x-prod.appspot.com/o/spaces%2FH2bFRBmIfyK3kwVKbldl%2Fuploads%2Fgit-blob-9fd5fddd26f46518e5b3d513921a100daf3e8946%2Fpm-dashboards-governanca-infraestrutura-en.png?alt=media" alt="Infrastructure Resources card with Capacities, Gateways, Connections and Dedicated"></picture><figcaption><p>Infrastructure Resources card</p></figcaption></figure>

| Indicator       | Meaning                                                                                                   |
| --------------- | --------------------------------------------------------------------------------------------------------- |
| **Capacities**  | Total monitored capacities, with "*N* active" in the footer.                                              |
| **Gateways**    | Total monitored gateways, with "*N* online · *N* offline". The number is red when any gateway is offline. |
| **Connections** | Total inventoried connections.                                                                            |
| **Dedicated**   | Workspaces on dedicated capacity.                                                                         |

**How to use:** if there is an offline gateway, investigate it in [Gateways](/en/power-monitor/governanca/infraestrutura/gateways.md); for capacities, see [Capacities](/en/power-monitor/governanca/infraestrutura/capacidades.md).

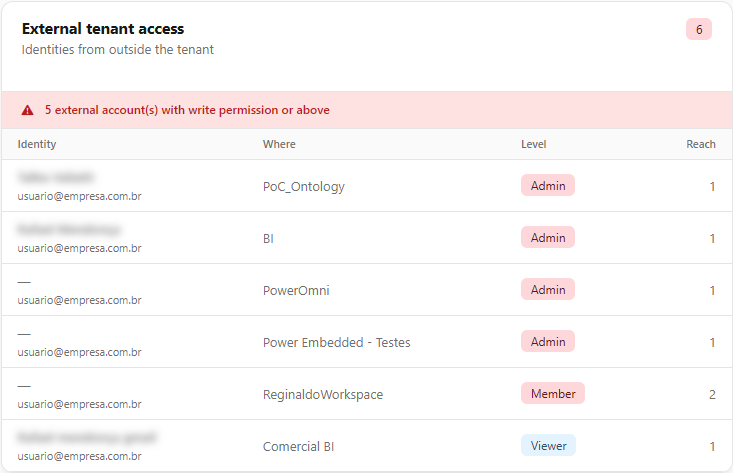
### External tenant access card

**What it is:** the **External tenant access** card (*Identities from outside the tenant*), which lists the **guest** identities with access to the monitored workspaces. The badge in the corner of the title shows the total number of external accounts (red when any has write or higher permission).

**What it is for:** periodically reviewing B2B guests and prioritizing those who can change content.

<figure><picture><source srcset="/files/3lpVZtqWfS340H3kHccY" media="(prefers-color-scheme: dark)"><img src="https://3938213054-files.gitbook.io/~/files/v0/b/gitbook-x-prod.appspot.com/o/spaces%2FH2bFRBmIfyK3kwVKbldl%2Fuploads%2Fgit-blob-fd70793ee066a3484cf7466cbb252a4579a16919%2Fpm-dashboards-governanca-acesso-externo-en.png?alt=media" alt="External tenant access card with the Identity, Where, Level and Reach columns"></picture><figcaption><p>External tenant access card</p></figcaption></figure>

| Column       | Content                                                                                                       |
| ------------ | ------------------------------------------------------------------------------------------------------------- |
| **Identity** | Name and e-mail of the external account.                                                                      |
| **Where**    | A sample workspace where it has access (the one with the highest level).                                      |
| **Level**    | Highest level the account has: **Admin** and **Member** in red, **Contributor** in amber, **Viewer** in blue. |
| **Reach**    | In how many workspaces the account has access.                                                                |

**How to use:**

{% stepper %}
{% step %}

### Find the alert

Check whether the card displays the alert *"N external account(s) with write permission or above"*.
{% endstep %}

{% step %}

### Analyze each account

Check the **Level**, **Where** and **Reach** columns. Prioritize accounts with **Admin** or **Member** (in red).
{% endstep %}

{% step %}

### Drill down in the Permissions Dashboard

To see all the workspaces and objects an account reaches, open the [Permissions Dashboard](/en/power-monitor/dashboards/dashboard-de-permissoes.md), **External** tab, or filter by the identity and use the **By person** tab.
{% endstep %}
{% endstepper %}

**How it works / rules:**

* The list is sorted by the highest access level and then by the number of workspaces.
* The alert appears when an external account has the **Contributor or higher** level. Read-only guests do **not** trigger the alert.
* The list shows up to 20 accounts; the others appear summarized as "and *N* more not listed". With no external accounts, the card displays "No external account has access."

{% hint style="warning" %}
This card shows the names and e-mails of real people (the **Hide data** button masks them). Be careful when sharing screenshots or exported files of this page, especially outside your organization.
{% endhint %}

### Workspace List: filters

**What it is:** the filter row at the top of the **Workspace List** card (*Monitored tenant inventory*). Filters are applied immediately, with no confirm button, and the badge in the card header shows how many workspaces match them ("*N* of *total*").

**What it is for:** focusing on a subset, for example only workspaces on shared capacity or only deleted ones.

<figure><picture><source srcset="/files/RE9F61t3FBixzH6zzXX9" media="(prefers-color-scheme: dark)"><img src="https://3938213054-files.gitbook.io/~/files/v0/b/gitbook-x-prod.appspot.com/o/spaces%2FH2bFRBmIfyK3kwVKbldl%2Fuploads%2Fgit-blob-043ed395181a06afcca8aa405b6ed50d4e422146%2Fpm-dashboards-governanca-lista-filtros-en.png?alt=media" alt="Workspace List with the Dedicated filter selected and the Clear filters button"></picture><figcaption><p>Workspace List filters</p></figcaption></figure>

| Filter                       | Behavior                                                             |
| ---------------------------- | -------------------------------------------------------------------- |
| **Search**                   | Searches for the text in the workspace name or description.          |
| **Workspace type**           | One button per type present in the list; click again to deselect.    |
| **All / Dedicated / Shared** | Filters by capacity type.                                            |
| **Active / Deleted**         | Filters by state; click again to deselect.                           |
| **Clear filters**            | Appears when a filter is active, with the number of filters applied. |

**How to use:**

{% stepper %}
{% step %}

### Search by name

Type in the **Search by workspace name...** field. The list is filtered as you type (the text is also searched in the description). Click the field's **X** to clear it.
{% endstep %}

{% step %}

### Combine the filters

Click the **workspace type** buttons, **All** / **Dedicated** / **Shared** and **Active** / **Deleted**. Click a type or state button again to deselect it.
{% endstep %}

{% step %}

### Clear the filters

Click **Clear filters** to return to the full list.
{% endstep %}
{% endstepper %}

With no results for the filters, the table shows a single row with the message "No workspace found".

### Workspace List: columns, sorting and pagination

**What it is:** the paginated table with all monitored workspaces. The **Items per page** selector in the footer changes the page size (10, 25, 50 or 100; the default is 10) and returns to the first page.

**What it is for:** comparing workspaces side by side in number of artifacts, size and access exposure.

<figure><picture><source srcset="/files/xLN9iEaYjnRkVkxjc9td" media="(prefers-color-scheme: dark)"><img src="https://3938213054-files.gitbook.io/~/files/v0/b/gitbook-x-prod.appspot.com/o/spaces%2FH2bFRBmIfyK3kwVKbldl%2Fuploads%2Fgit-blob-1d62606a96024d9d88214b26f6dc3285838e553c%2Fpm-dashboards-governanca-lista-workspaces-en.png?alt=media" alt="Workspace List table with the Name, Type, State, Capacity, Artifacts, Size, Access and External columns"></picture><figcaption><p>Workspace List</p></figcaption></figure>

| Column        | Content                                                                                                                                                                                                                                                                      |
| ------------- | ---------------------------------------------------------------------------------------------------------------------------------------------------------------------------------------------------------------------------------------------------------------------------- |
| **#**         | Position in the list.                                                                                                                                                                                                                                                        |
| **Name**      | Workspace name (sortable).                                                                                                                                                                                                                                                   |
| **Type**      | Workspace type (sortable).                                                                                                                                                                                                                                                   |
| **State**     | Active (green) or Deleted (red).                                                                                                                                                                                                                                             |
| **Capacity**  | Dedicated or Shared.                                                                                                                                                                                                                                                         |
| **Artifacts** | Total artifacts, with a bar proportional to the largest workspace **on the page**. Hover over it to see the breakdown by type. Sortable; it is the default sort, from largest to smallest.                                                                                   |
| **Size**      | Sum of the size of the workspace's semantic models. Shows "—" for workspaces without dedicated capacity and "Not collected" while no model has had its size captured. The tooltip shows the exact size in bytes and the coverage (how many models have their size captured). |
| **Access**    | Distinct identities with access to the workspace. "—" indicates that the workspace was not included in the permissions reading.                                                                                                                                              |
| **External**  | Guest accounts with access to the workspace, highlighted in red when there are any.                                                                                                                                                                                          |

**How to use:**

1. Click the **Name**, **Type** or **Artifacts** column headers to sort; click again to reverse the order (the arrow indicates the direction).
2. Hover over the **Artifacts** number to see the breakdown by type, or over **Size** to see the exact value and the coverage.
3. Use the pagination in the card footer to navigate between pages.

### Open the X-Ray, the events or the Workspaces screen

**What it is:** the investigation shortcuts of the **Workspace List**: clicking the row, the clock icon button on each row and the table icon button in the card header.

**What it is for:** leaving the overview and going straight to a workspace's details, its audit trail or the workspace management screen.

**How to use:**

1. **X-Ray:** click the workspace's row. The [Workspace X-Ray](/en/power-monitor/qualidade-de-dados/raio-x-de-workspace.md) opens with the workspace already selected.
2. **Audit events:** click the clock icon (**View audit events for this workspace**) on the row. The [Events Overview](/en/power-monitor/auditoria/geral-de-eventos.md) screen opens already filtered by the workspace name.
3. **Workspaces screen:** click the table icon (**View workspaces**) in the list header to open [Workspaces](/en/power-monitor/governanca/workspaces.md).

To open the audit without a filter, use **View full audit** in the **Audit (last 30 days)** card.

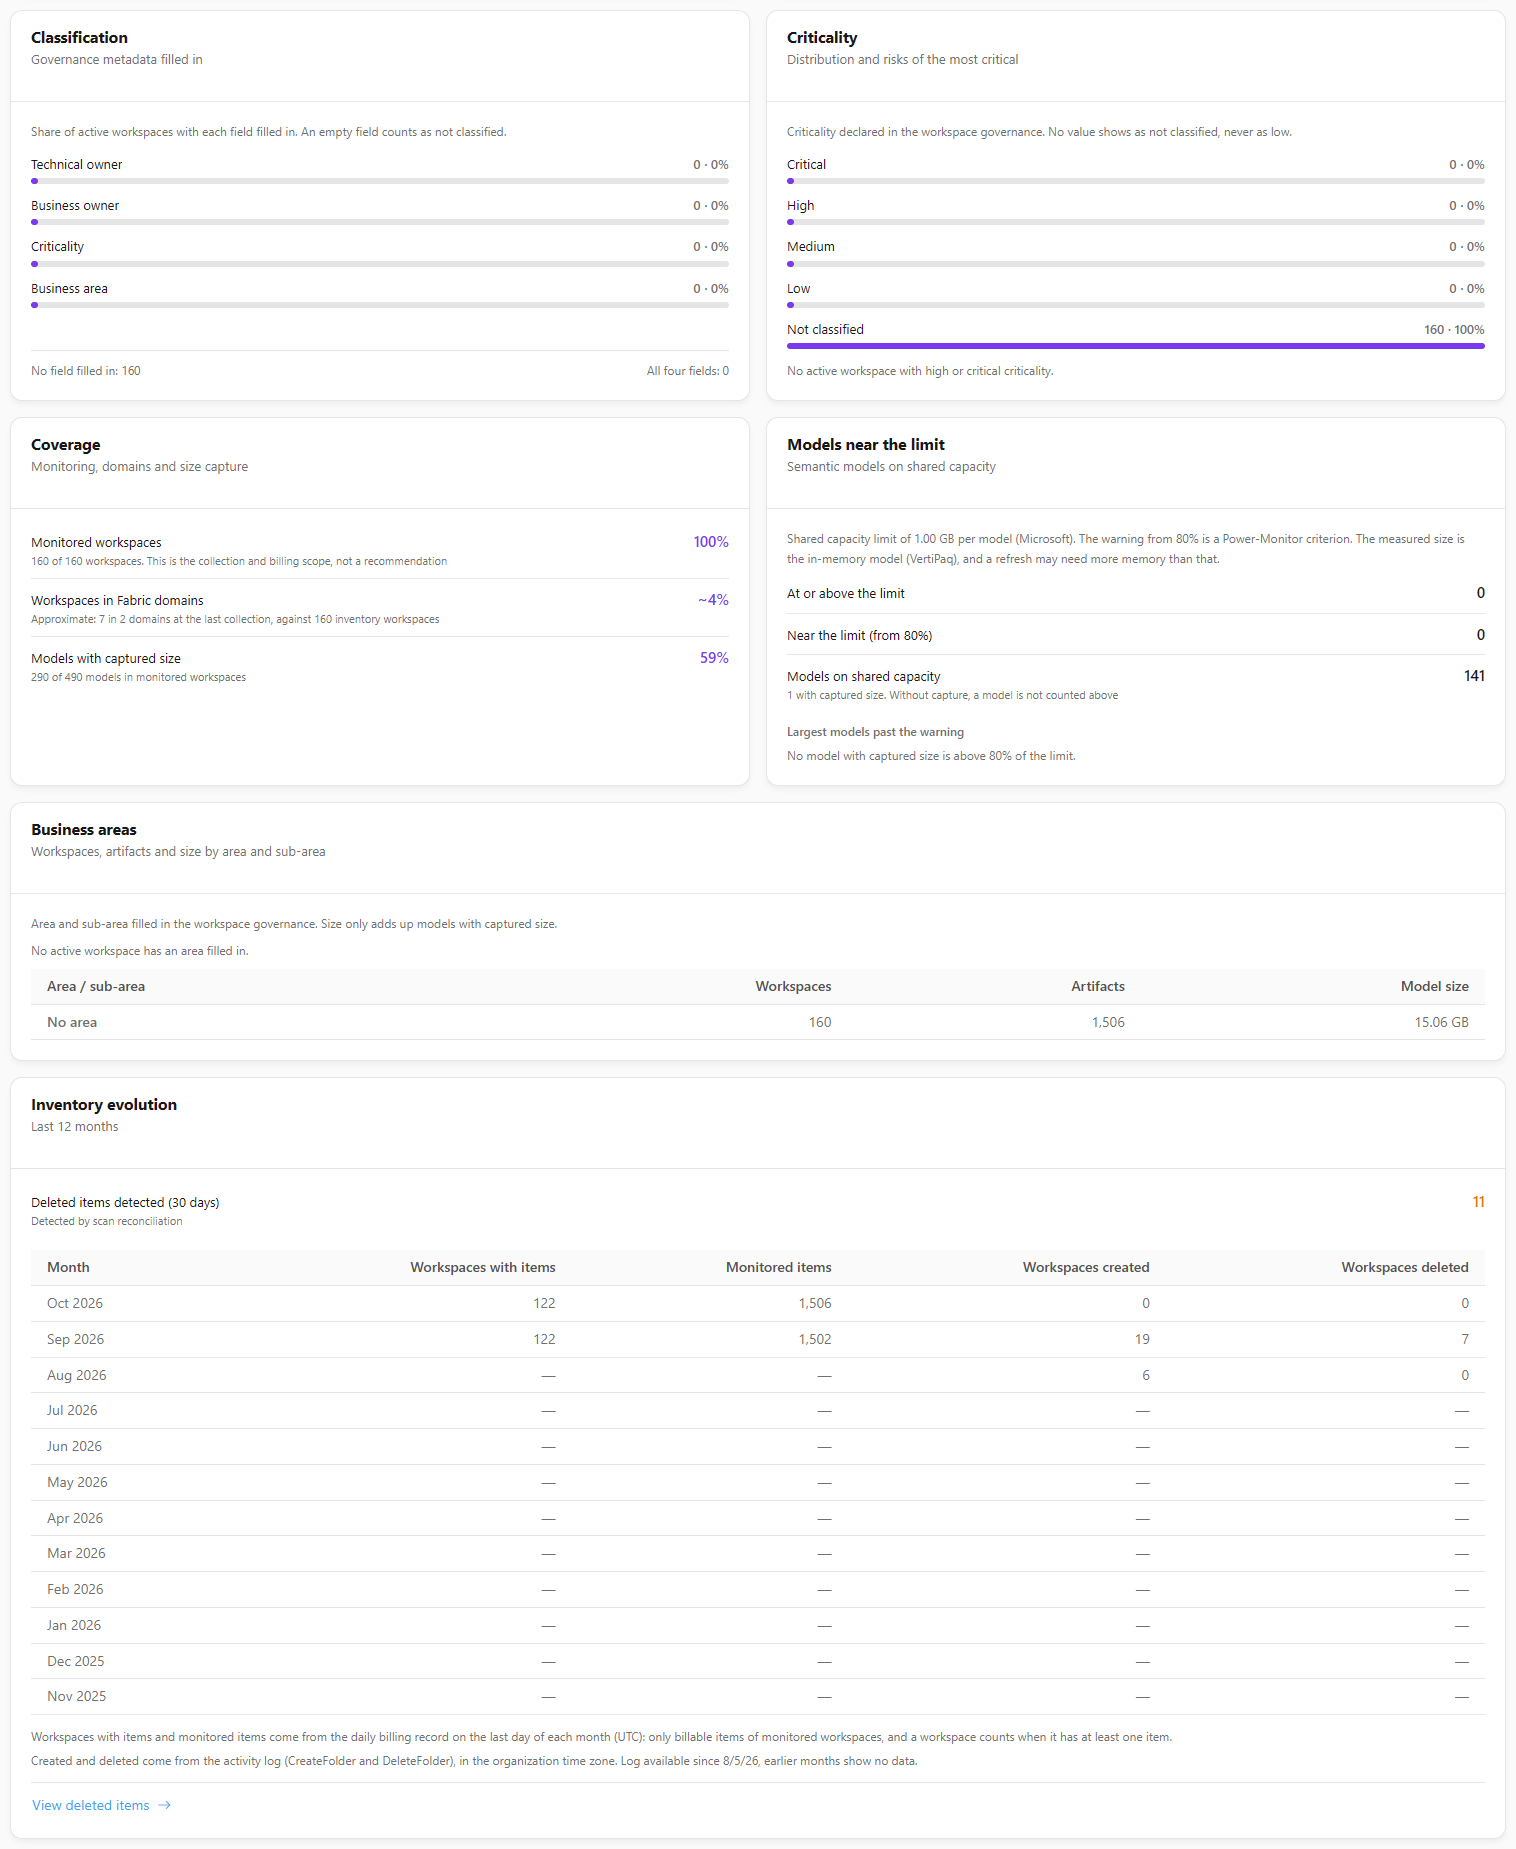
### Governance indicators

**What it is:** six governance cards calculated on the **active workspaces** in scope, each loaded on its own.

**What it is for:** measuring governance maturity (who owns what, how critical it is, what is monitored) and finding capacity and model size risks.

<figure><picture><source srcset="/files/UCEHCJTGHKEnauOU543u" media="(prefers-color-scheme: dark)"><img src="https://3938213054-files.gitbook.io/~/files/v0/b/gitbook-x-prod.appspot.com/o/spaces%2FH2bFRBmIfyK3kwVKbldl%2Fuploads%2Fgit-blob-59c5416f9cf0a672b22214ba923a65b803bd8644%2Fpm-dashboards-governanca-indicadores-en.png?alt=media" alt="Classification, Criticality, Coverage, Models near the limit, Business areas and Inventory evolution cards"></picture><figcaption><p>Governance indicators</p></figcaption></figure>

| Card                      | What it shows                                                                                                                                                                                                                                                                                       |
| ------------------------- | --------------------------------------------------------------------------------------------------------------------------------------------------------------------------------------------------------------------------------------------------------------------------------------------------- |
| **Classification**        | Share of workspaces with each metadata field filled in (**Technical owner**, **Business owner**, **Criticality**, **Business area**), how many have no field and how many have all four. An empty field counts as not classified                                                                    |
| **Criticality**           | Distribution (**Critical**, **High**, **Medium**, **Low**, **Not classified**) and the risks of the most critical: high or critical **on shared capacity**, **without a technical owner** and **without an admin**                                                                                  |
| **Coverage**              | **Monitored workspaces** (the collection and billing scope, not a recommendation), **Workspaces in Fabric domains** (approximate) and **Models with captured size**                                                                                                                                 |
| **Models near the limit** | Semantic models on shared capacity **at or above the limit**, or **near the limit** (warning from a share of the per-model limit), with the largest models. The measured size is the in-memory model (VertiPaq), and a refresh may need more memory; without size capture, the model is not counted |
| **Business areas**        | Workspaces, artifacts and **Model size** by **Area / sub-area** registered in governance (**No area** when missing)                                                                                                                                                                                 |
| **Inventory evolution**   | Last 12 months: **Workspaces with items**, **Monitored items**, **Workspaces created** and **Workspaces deleted**, plus the **Deleted items detected**, with the **View deleted items** link                                                                                                        |

**How it works:** item numbers come from the daily billing record on the last day of each month (UTC); creation and deletion come from the activity log (CreateFolder and DeleteFolder), in the organization time zone, and months before the log collection show no data. When there is no active workspace in scope, the cards show *No active workspace in scope*.

#### Details of each indicator

**Classification:** four bars (**Technical owner**, **Business owner**, **Criticality** and **Business area**) with the count and share of active workspaces that filled in each field. In the footer: *No field filled in* and *All four fields*. The bar measures who filled it in, so an environment with no governance registered shows short bars.

**Criticality:** bars by level (**Critical**, **High**, **Medium**, **Low** and **Not classified**; a missing value is never added to Low). Below, three findings about the workspaces with high or critical criticality, in amber when greater than zero: **High or critical on shared capacity** (no dedicated capacity, subject to shared capacity limits), **High or critical without a technical owner** (no name or e-mail) and **High or critical without an admin** (no admin in the collected permissions). The last row only appears when the access reading is available. With no high or critical workspace, the card says so.

**Coverage:** three percentages.

* **Monitored workspaces:** monitored over the total in scope. This is the collection and billing scope, not a recommendation to monitor more.
* **Workspaces in Fabric domains:** an approximate value (with "\~", capped at 100%) that compares the domain count at the last collection with the inventory workspaces. The row does not appear for users with restricted workspace scope. With no domain collected, the footer says *No Fabric domain collected*.
* **Models with captured size:** semantic models in monitored workspaces that have a recorded size, over the total.

**Models near the limit:** considers the semantic models of monitored workspaces on **shared capacity**, where the Microsoft limit is **1 GB** per model. The warning starts at **80%** of that limit, which is a Power Monitor criterion. The card shows **At or above the limit**, **Near the limit (from 80%)**, the total of **Models on shared capacity** (with how many have captured size) and the list of the **Largest models past the warning** (up to 10), each with its size and an *N% of the limit* badge (red at or above the limit, amber near it). Click a model's workspace name to open its [Workspace X-Ray](/en/power-monitor/qualidade-de-dados/raio-x-de-workspace.md). The size is the in-memory model, and a refresh may need more memory.

**Business areas:** a table with **Area / sub-area**, **Workspaces**, **Artifacts** and **Model size**. Each area shows its sub-areas right below; the areas with the most workspaces come first and up to 10 are shown (the card says how many were left out). Workspaces without an area appear under **No area**, and without a sub-area under **No sub-area**. Size only adds up models with captured size.

**Inventory evolution:** highlights the **Deleted items detected** in the last days, by scan reconciliation, and a table of the last 12 months (most recent month first) with **Workspaces created** and **Workspaces deleted**, from the activity log, in the organization time zone. Months before the log starts show "—". For **administrators with unrestricted workspace scope**, the table also has the **Workspaces with items** and **Monitored items** columns (billable count on the last day of each month, with no amounts; the *trial* badge marks months with free trial days). The **View deleted items** link opens the [Deleted Artifacts](/en/power-monitor/governanca/operacao/artefatos-excluidos.md) screen.

These cards load separately: if the extra indicators fail, a message appears and the other cards on the page keep working. The header refresh button also reloads the indicators.

## Rules and behavior

* **Screen scope:** all numbers consider only workspaces of type *Workspace* marked as **monitored**, within the user's workspace scope. Personal workspaces (My Workspace) are left out. That is why the totals may differ from the [Permissions Dashboard](/en/power-monitor/dashboards/dashboard-de-permissoes.md), which considers all of the organization's workspaces.
* **Data source:**
  * inventory, artifacts, workspace state and permissions come from the [Mapping › Inventory › Inventory](/en/power-monitor/mapeamento/inventarios.md) (Fabric/Power BI Admin Scan API);
  * the audit comes from the tenant's collected **Activity Events**;
  * capacities and gateways come from Power Monitor monitoring (see [Capacities](/en/power-monitor/governanca/infraestrutura/capacidades.md) and [Gateways](/en/power-monitor/governanca/infraestrutura/gateways.md)).
* **Access levels:** the raw permission reported by the API is classified as Admin (admin/owner), Member, Contributor (write/contributor), Viewer (read/viewer) or Other.
* **Distinct identity:** the same person with access to several workspaces counts only once in the global indicators.
* **Time windows:** "no activity" and the audit indicators use the last 30 days; the main number of events and its trend use 7 days against the previous 7 days.
* **Independent loading:** inventory, access and audit are loaded in parallel. If the access or audit reading is not available, the corresponding cards (Access, Administration concentration, External access, the **Access** and **External** columns, or Audit and the attention banner) stop appearing and the grid reorganizes itself; in case of failure, a message indicates which part did not load.
* **Read-only:** Power Monitor does not change workspace permissions. Corrections are made in the Fabric/Power BI portal and appear on the screen after the next collection.

## Frequently asked questions

<details>

<summary>How do I remove a workspace from the "Workspaces without admin" count?</summary>

Assign the Admin role to a corporate account or security group in the Fabric/Power BI portal. The issue disappears after the next permissions collection performed by the Mapping › Inventory › Inventory.

</details>

<details>

<summary>Why is the total number of identities called a "lower bound"?</summary>

Because each Microsoft Entra ID group counts as a single identity, regardless of how many members it has. The actual number of people with access may be higher. The [Permissions Dashboard](/en/power-monitor/dashboards/dashboard-de-permissoes.md) shows the potential reach of each group.

</details>

<details>

<summary>Why does a workspace appear as "no activity" if I know it is used?</summary>

The rule considers **any audit event** of the workspace in the last 30 days. If Activity Events collection is paused or delayed, or if usage does not generate events recorded in the tenant's audit, the workspace may appear as inactive. Check the collection in [Events Overview](/en/power-monitor/auditoria/geral-de-eventos.md).

</details>

<details>

<summary>The numbers here do not match the Permissions Dashboard. Which one is right?</summary>

Both are right, but they measure different scopes. This dashboard considers only monitored workspaces of type *Workspace*. The Permissions Dashboard considers all of the organization's workspaces (including unmonitored ones and personal workspaces) and also permissions on artifacts, gateways and connections.

</details>

<details>

<summary>The badge says "Scan delayed". What should I do?</summary>

The badge indicates that the last permissions collection is more than 24 hours old. Check the execution of the [Mapping › Inventory › Inventory](/en/power-monitor/mapeamento/inventarios.md). Until the collection runs again, the access numbers reflect the situation as of the last collection.

</details>

<details>

<summary>Can I export the workspace list to CSV?</summary>

Not from this screen: it exports the page as **PDF** or **PNG**. To work with the workspace list, use the [Workspaces](/en/power-monitor/governanca/workspaces.md) screen (**View workspaces** button).

</details>

## Related pages

* [Permissions Dashboard](/en/power-monitor/dashboards/dashboard-de-permissoes.md)
* [Dashboard](/en/power-monitor/dashboards/dashboard-principal.md)
* [Workspaces](/en/power-monitor/governanca/workspaces.md)
* [Workspace X-Ray](/en/power-monitor/qualidade-de-dados/raio-x-de-workspace.md)
* [Events Overview](/en/power-monitor/auditoria/geral-de-eventos.md)
* [Permissions Audit](/en/power-monitor/auditoria/auditoria-de-permissoes.md)
* [Mapping › Inventory › Inventory](/en/power-monitor/mapeamento/inventarios.md)
* [Users](/en/power-monitor/usuarios.md)


---

# Agent Instructions
This documentation is published with GitBook. GitBook is the documentation platform designed so that both humans and AI agents can read, navigate, and reason over technical content effectively. Learn more at gitbook.com.

## Querying This Documentation
If you need additional information that is not directly available in this page, you can query the documentation by asking a question.

Perform an HTTP GET request on the following URL with the `ask` and `goal` query parameters:

```
GET https://docs.powermonitor.com.br/en/power-monitor/dashboards/dashboard-de-governanca.md?ask=<question>&goal=<user_goal>
```

`ask` is the immediate question: it should be specific, self-contained, and written in natural language.
`goal` is what the user is ultimately trying to achieve, the reason they need the answer. Sharing it helps GitBook give you a better, more relevant answer. A goal is most helpful when it describes the outcome the user wants rather than restating the question. For example, with `ask=how do I create an API token`, a goal like `automate deployments from our CI pipeline` lets GitBook tailor the answer to that use case.

The response will contain a direct answer to the question and relevant excerpts and sources from the documentation.

Use this mechanism when the answer is not explicitly present in the current page, you need clarification or additional context, or you want to retrieve related documentation sections.