> For the complete documentation index, see [llms.txt](https://docs.powermonitor.com.br/llms.txt). Markdown versions of documentation pages are available by appending `.md` to page URLs; this page is available as [Markdown](https://docs.powermonitor.com.br/en/power-monitor/dashboards/dashboard-de-monitoramento.md).
# Monitoring Dashboard
"TV mode" panel for operations rooms: shows, in large type and with automatic rotation, only what is wrong in the Fabric and Power BI environment right now.
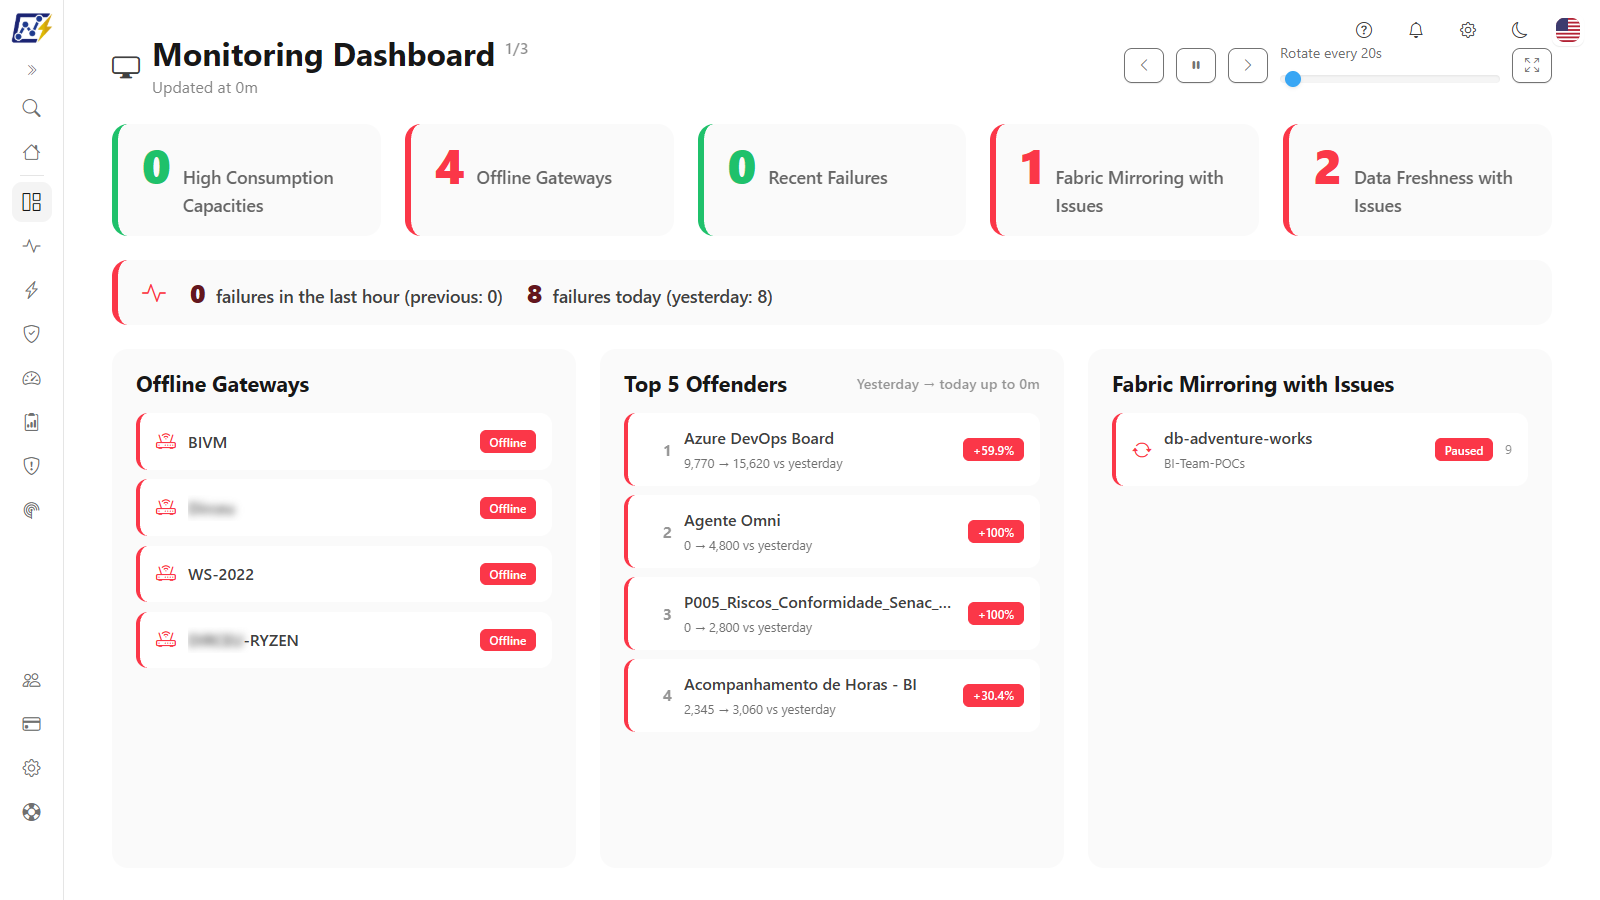
The **Monitoring Dashboard** is a panel designed to stay on a TV or monitor for the support team (NOC style). It brings together, on a single screen readable from a distance, the main problem signals in the environment (overloaded capacities, offline gateways, recent refresh failures, mirrored databases with issues and more) and **only shows the panels that have something wrong at the moment**.
**How to access:** menu *Dashboards › Monitoring Dashboard*, or through the highlight card on the [Home](/en/power-monitor/pagina-inicial.md) page. The screen is visible to all user profiles (unless the page has been blocked for your user by an administrator).
Monitoring Dashboard (TV mode)
## What it is for
* **Passive monitoring in an operations room:** the team looks at the TV and immediately sees whether a gateway is down, a capacity is maxing out or a refresh is failing.
* **Quick triage:** the screen does not show neutral rankings or "all good" panels: every visible panel is a problem to investigate.
* **Follow-up during critical windows:** month-end closing, overnight loads, migrations.
## Features
### Rotation controls
**What it is:** the set of controls in the header: the **Previous** and **Next** arrows, **Pause automatic rotation** / **Resume automatic rotation**, the **Rotate every {N}s** slider and **Fullscreen**. The header also shows the title, the panel set indicator (e.g. **1/2**, when more than 3 panels have problems) and **Updated at {time}**.
**What it is for:** adjusting the pace of the TV to the setting (crowded room, meeting, one-off analysis) and stopping the rotation when someone wants to read a panel calmly.
Header and rotation controls
**How to use:**
1. Drag the **Rotate every {N}s** slider to set how often the panels change, from **5 to 600 seconds** (default: **20 s**).
2. Click **Pause automatic rotation** to freeze the current set; the button changes to **Resume automatic rotation**.
3. Use the **Previous** and **Next** arrows to move forward or back manually between panel sets and internal pages.
4. Click **Resume automatic rotation** to return to rotation.
**How it works:**
* At each interval, the set of 3 panels advances. The content of a paginated panel advances one page on each full cycle of the set; this way, every page of every panel eventually appears.
* The chosen interval is saved **in the browser/device**, without affecting other users.
* **Updated at {time}** indicates the time of the last data reload.
### Fullscreen
**What it is:** the **Fullscreen** / **Exit fullscreen** button, which puts the panel into true browser fullscreen.
**What it is for:** using the panel on an operations room TV, without the side menu, top bar or browser controls.
**How to use:**
1. Click **Fullscreen**. The side menu, top bar and browser controls disappear, and numbers and titles become even larger.
2. To exit, press **Esc** or click **Exit fullscreen**. The side menu and top bar reappear.
### KPI strip
**What it is:** five large indicators, always visible above the panels. The number is green when it is zero and highlighted (yellow/red) when there are occurrences.
**What it is for:** allowing the overall state of the environment to be read from several meters away, even while the panels rotate.
KPI strip
| KPI | What it counts |
| --------------------------------- | ------------------------------------------------------------------------------------------------------------------------------------------------------------------------------------------------------------------------------------- |
| **High Consumption Capacities** | Capacities with Capacity Units usage **≥ 85%** (*Saturated* and *Critical* ranges). |
| **Offline Gateways** | Gateways whose current state is offline. |
| **Recent Failures** | Most recent open failure incidents for semantic models and Fabric items (up to the 20 most recent). |
| **Fabric Mirroring with Issues** | Mirrored databases with an incident or with late, failed or stopped tables. |
| **Data Freshness with Issues** | Data freshness monitors with late or failed tables. |
| **Stalled Collection** | A running capacity whose consumption metric has had no new data for more than **45 minutes** (inactive capacities and SKUs without telemetry, such as PP3 and Pro, are left out), or a periodic collection whose last run **failed**. |
| **Consumption Anomalies** | Consumption anomalies detected today with **High** or **Critical** severity. |
| **Runs Slower Than Usual** | Items whose last run took longer than the item's own average duration. |
| **Long-Running Refreshes** | A refresh in progress beyond the Power BI duration limit: **2 hours** on shared capacity and **5 hours** on dedicated capacity (refreshes started in the last 7 days are considered). |
| **Failed Capacity Automation** | A capacity automation action (pause, resume, upscale or downscale) that failed in the last **24 hours**. |
| **Long-Open Incidents** | An incident that has been open for more than **24 hours**. |
| **App Secret Expiring** | App registration secret with a known expiration date that expires in **14 days or fewer** (including one that already expired). |
| **Failed Refresh Retries** | An automatic refresh retry that failed in the last **24 hours**. |
| **Items throttled today (Top 5)** | Items that were delayed because the capacity was overused **today** (in the organization's time zone). Only items with real throttling appear. |
### Failure strip
**What it is:** a red strip right below the KPIs with two numbers: the **failures in the last hour** (with the previous hour's value) and the **failures today** (with yesterday's value).
**What it is for:** seeing from a distance whether failures are rising or falling compared with the previous period.
Failure strip
**How it works:** the strip only appears when there is a failure in the current hour or today; with no failures it disappears, following the screen's rule of showing only what has a problem. Each incident counts once, when it opens.
### Problem panels
**What it is:** the main grid, which shows **3 panels at a time**. Only panels with occurrences enter the rotation, always in the order of the table below.
**What it is for:** triage: every visible panel is a problem to investigate; there are no neutral rankings or "all good" panels.
Example of a problem panel
| Panel | Criterion to appear | What it shows |
| ---------------------------------------- | ---------------------------------------------------------------------------------------------------------------------------------------------------------------------- | --------------------------------------------------------------------------------------------------------------------------------------- |
| **High Consumption Capacities** | Capacity Units usage ≥ 85%. Between 85% and 100% it is *Saturated* (orange); from 100% on, *Critical* (red). | Horizontal bar chart with the usage percentage of each capacity, from highest to lowest. |
| **Offline Gateways** | Gateway whose current state is offline. | Gateway name and **Offline** badge. |
| **Recent Failures** | Failure incident **opened for the first time** (recurrences of the same problem do not count as a new failure) for a semantic model or Fabric item. | Item name, error code (or the message, when there is no code), type (**Semantic Model** or **Fabric Item**) and date/time. |
| **Top 5 Offenders** | Items whose Capacity Units consumption **increased** from yesterday to today. Does not appear when either day has no data yet. | Position, name, consumption yesterday → today and percentage change. The header indicates the window: "Yesterday → today up to {time}". |
| **Capacities Outside Expected Schedule** | Capacity running outside the operating window configured in the capacity's schedule alert. | Capacity name and **Off schedule** badge. |
| **Outdated Gateways** | Gateway with an **unsupported** version (more than 6 monthly versions behind the latest). | Gateway name, installed version and unsupported version badge. |
| **Inactive Capacities** | Capacity in an inactive state (paused/stopped). | Capacity name and **Inactive** badge. |
| **High Background Consumption** | Capacity Background consumption above the threshold configured by an administrator in *Settings › Monitoring* (the same threshold used by the hourly email checklist). | Capacity name and Background percentage. |
| **Fabric Mirroring with Issues** | Mirrored database with an incident on the database or with late, failed or stopped tables. | Mirrored database name, workspace, status (database status, **Late** or **Failed**) and number of affected tables. |
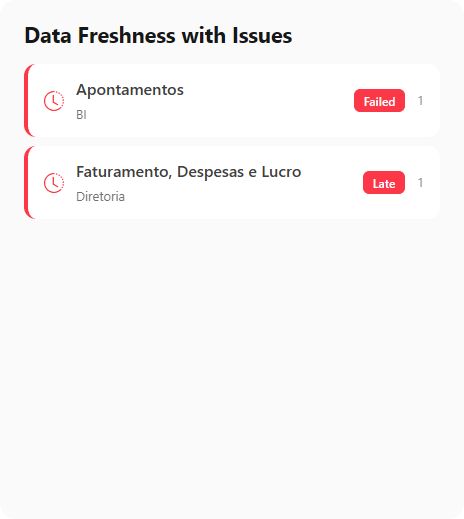
| **Data Freshness with Issues** | Monitor with late or failed tables. | Semantic model, workspace, status (**Late** or **Failed**) and number of affected tables. |
**How to use (investigating a displayed problem):**
1. Pause the rotation and note the panel and the item displayed (for example, a gateway in **Offline Gateways** or a model in **Recent Failures**).
2. Open the corresponding screen from the menu: [Alerts](/en/power-monitor/monitoramento/alertas.md) for failures and incidents, [Capacity monitoring](/en/power-monitor/monitoramento/capacidades.md) for capacities, [Gateway monitoring](/en/power-monitor/monitoramento/gateways.md) for gateways or [Consumption Comparison](/en/power-monitor/monitoramento/comparativo-de-consumo.md) for the offenders.
**How it works:** when a panel has more items than fit (6 per page in the original panels; 5 in **Recent Failures** and in the additional panels listed at the end of the table), its content also paginates, and the panel header shows the current page (e.g. **1/2**). The panels are not clickable: the screen is read-only.
### "All good" state
**What it is:** when no panel has occurrences, the grid is replaced by a single large message: **"No problems right now, all clear"**. The KPI strip remains visible, all in green.
**What it is for:** making it clear, from a distance, that there is nothing to handle, instead of an empty screen that could be mistaken for a failure.
**How it works:** check the time in **Updated at** to make sure the data is still being refreshed. If loading fails, the message changes to "Could not load data. Retrying shortly.".
### How to put the panel on a TV
{% stepper %}
{% step %}
### Open the panel
On a computer connected to the TV, sign in to Power Monitor and go to *Dashboards › Monitoring Dashboard* (or click the **Monitoring Dashboard** card on the [Home](/en/power-monitor/pagina-inicial.md) page).
{% endstep %}
{% step %}
### Adjust the rotation interval
Drag the **Rotate every {N}s** slider (for example, 30 s for a room with many people watching). The choice is saved in this browser.
{% endstep %}
{% step %}
### Enter fullscreen
Click **Fullscreen**.
{% endstep %}
{% step %}
### Keep the session active
Leave the browser open with the authenticated session. The data reloads on its own every 1 minute; if the session expires, sign in again.
{% endstep %}
{% endstepper %}
## Rules and behavior
* **Automatic refresh:** the data is reloaded **every 1 minute**, without needing to refresh the page. If loading fails, the screen shows "Could not load data. Retrying shortly." and tries again in the next cycle.
* **Data source:** the screen reuses the same sources as the monitoring screens: capacity and gateway monitoring, Alerts, Consumption Comparison, gateway inventory, Fabric Mirroring and Data Freshness. It reflects the latest collection of each one; it does not trigger new collections.
* **Additional panels:** the panels at the end of the table (from **Stalled Collection** to **Items throttled today**) use the same sources as Alerts, anomalies, duration monitoring, capacity automation, the Capacity Dashboard and the periodic scans. When a panel list is cut at 20 items, the subtitle says *Showing N of M.* Each source fails on its own: if one does not load, only its panel stops entering the rotation.
* **"Today" is an incomplete day:** in the Top 5 Offenders panel, today's consumption runs up to the time of the last update. In the morning the list tends to be short and grows throughout the day.
* **Read-only:** the screen has no actions; to investigate, open the corresponding screen in the *Monitoring* menu.
## Frequently asked questions
The screen only shows "No problems right now, all clear". Is it working?
Yes. By design, panels with no occurrences do not appear. Check the time in "Updated at" to confirm that the data is being refreshed.
Why doesn't the Top 5 Offenders panel appear in the early morning?
It only appears when there is consumption data for both yesterday and today. Before the first collection of the day, the comparison is not displayed.
A failure that has already been resolved still appears in Recent Failures.
The panel lists the most recent open failure incidents, as recorded in Alerts. See the [Alerts](/en/power-monitor/monitoramento/alertas.md) screen to view the state and history of each incident.
The interval I chose does not apply on another computer.
The rotation interval is saved in the browser of each device. Adjust it on each TV/computer.
## Related pages
* [Dashboards](/en/power-monitor/dashboards.md)
* [Home page](/en/power-monitor/pagina-inicial.md)
* [Alerts](/en/power-monitor/monitoramento/alertas.md)
* [Capacity monitoring](/en/power-monitor/monitoramento/capacidades.md)
* [Gateway monitoring](/en/power-monitor/monitoramento/gateways.md)
* [Consumption Comparison](/en/power-monitor/monitoramento/comparativo-de-consumo.md)
* [Capacity Dashboard](/en/power-monitor/dashboards/dashboard-de-capacidade.md)
---
# Agent Instructions
This documentation is published with GitBook. GitBook is the documentation platform designed so that both humans and AI agents can read, navigate, and reason over technical content effectively. Learn more at gitbook.com.
## Querying This Documentation
If you need additional information that is not directly available in this page, you can query the documentation by asking a question.
Perform an HTTP GET request on the following URL with the `ask` and `goal` query parameters:
```
GET https://docs.powermonitor.com.br/en/power-monitor/dashboards/dashboard-de-monitoramento.md?ask=&goal=
```
`ask` is the immediate question: it should be specific, self-contained, and written in natural language.
`goal` is what the user is ultimately trying to achieve, the reason they need the answer. Sharing it helps GitBook give you a better, more relevant answer. A goal is most helpful when it describes the outcome the user wants rather than restating the question. For example, with `ask=how do I create an API token`, a goal like `automate deployments from our CI pipeline` lets GitBook tailor the answer to that use case.
The response will contain a direct answer to the question and relevant excerpts and sources from the documentation.
Use this mechanism when the answer is not explicitly present in the current page, you need clarification or additional context, or you want to retrieve related documentation sections.