> For the complete documentation index, see [llms.txt](https://docs.powermonitor.com.br/llms.txt). Markdown versions of documentation pages are available by appending `.md` to page URLs; this page is available as [Markdown](https://docs.powermonitor.com.br/en/power-monitor/governanca/armazenamento.md).

# Storage

Inventory of Fabric storage items (SQL Databases, Lakehouses, Warehouses, KQL databases and Eventstreams), with permissions, reverse lineage, dependencies and access to the SQL endpoint Performance An

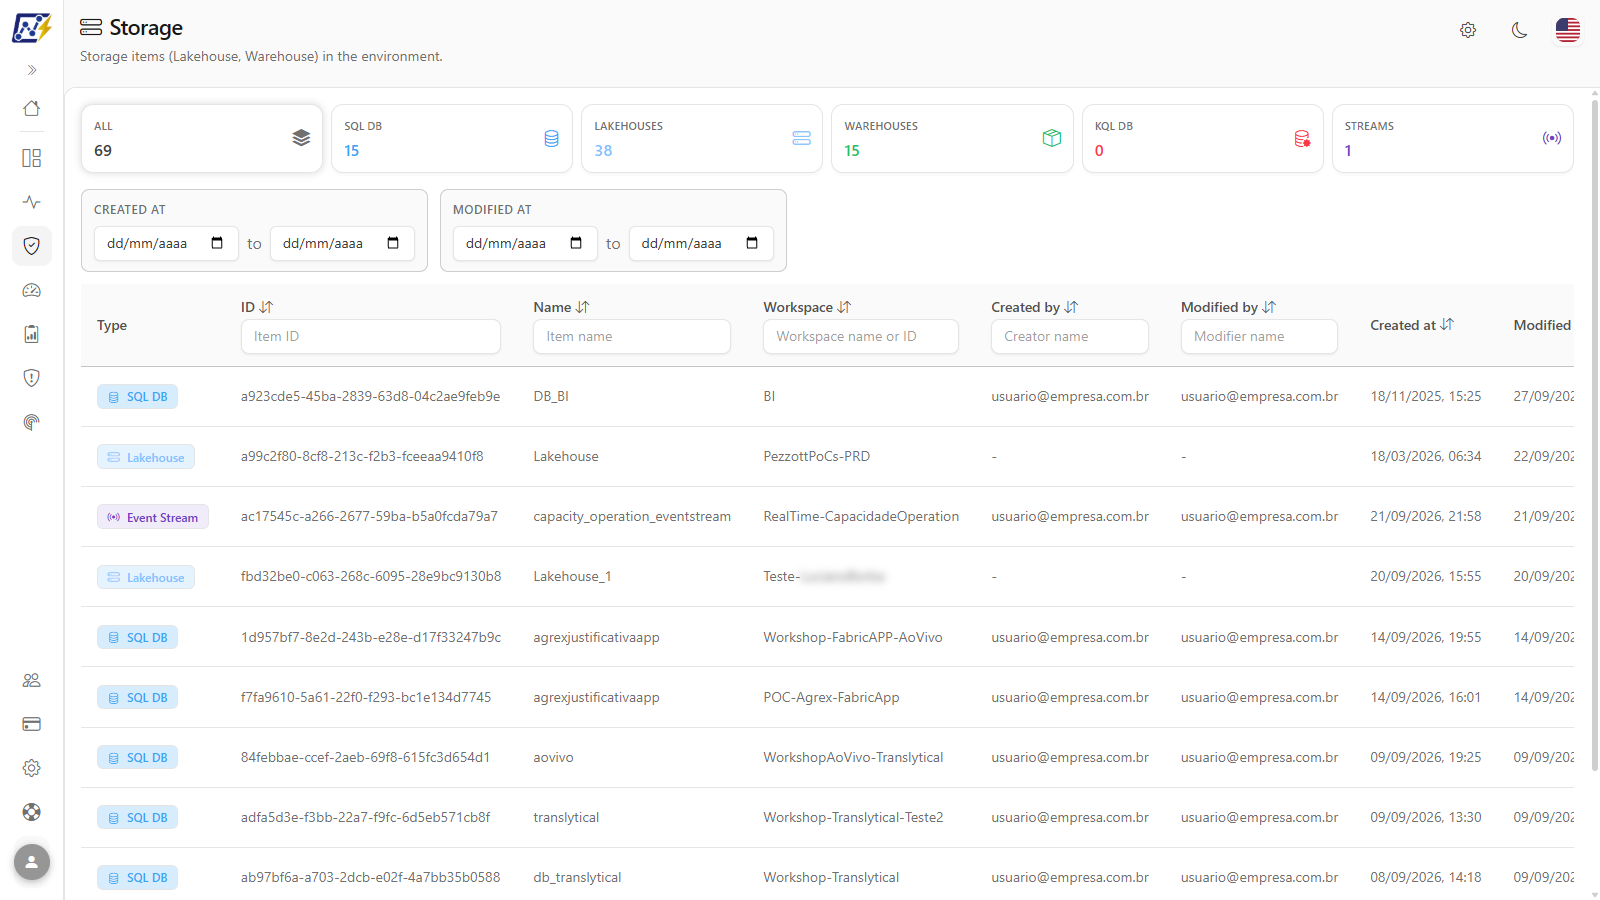
The **Storage** screen brings together in a single list the Microsoft Fabric data persistence items in the monitored workspaces: **SQL Databases**, **Lakehouses**, **Warehouses**, **KQL databases** and **Eventstreams**. For Lakehouses and Warehouses, it is also the entry point for two important analyses: **reverse lineage** ("who consumes this storage?") and the SQL endpoint [Performance Analysis](/en/power-monitor/governanca/armazenamento/analise-de-performance-sql.md).

**How to access:** menu *Governance › Storage*. Available to all profiles. The screen is view-only: none of its actions change items in Fabric.

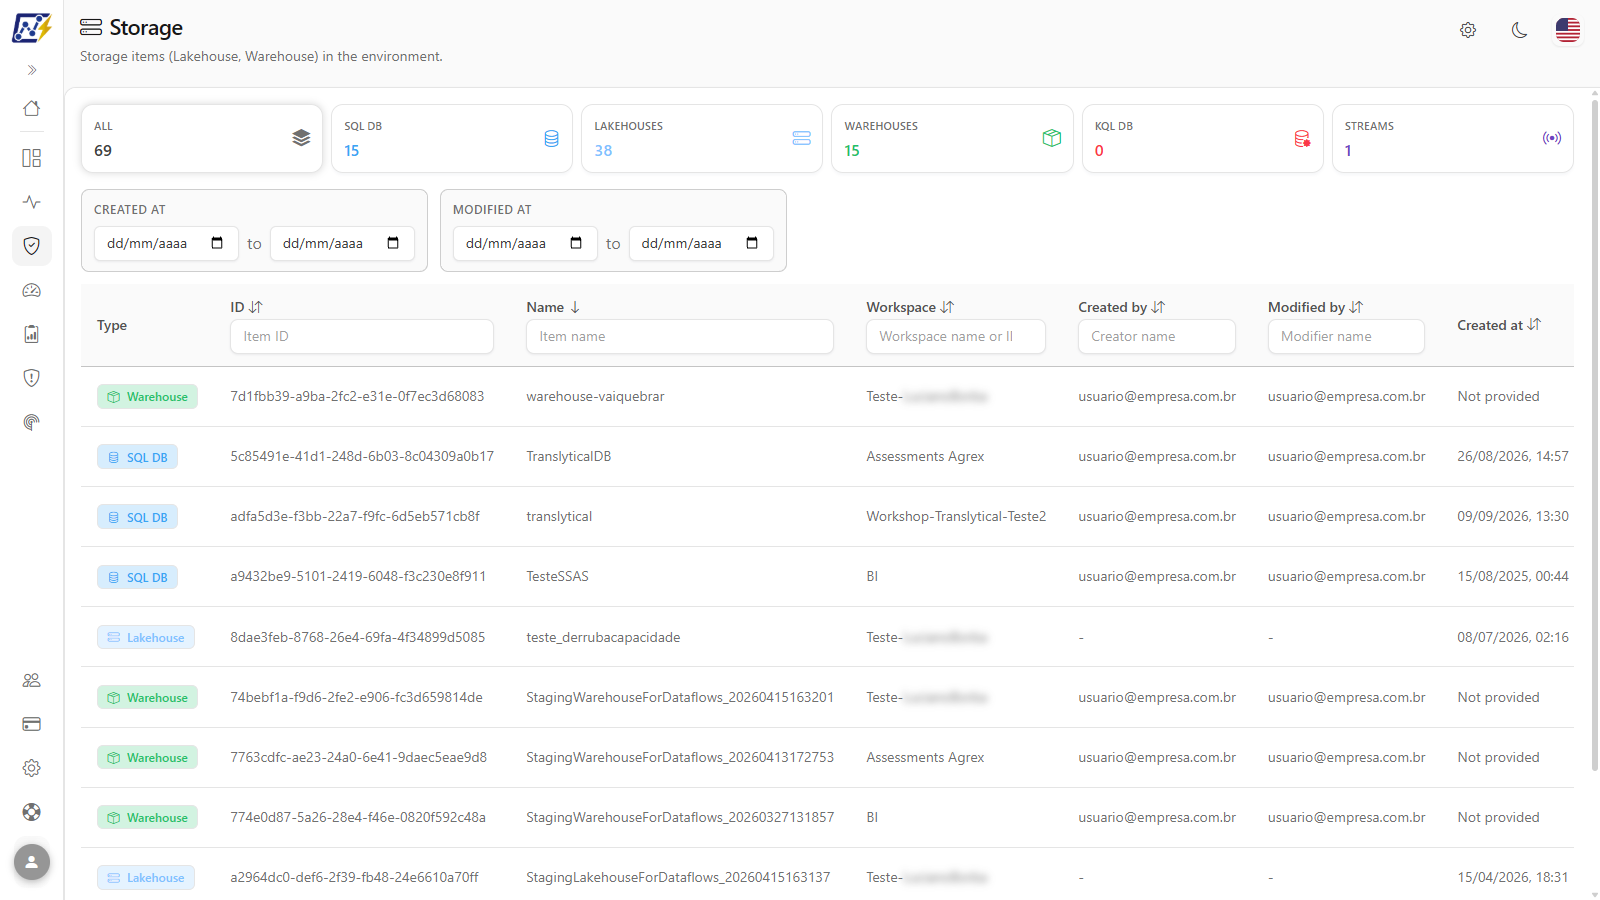
<figure><picture><source srcset="/files/qu5nPWjXltDV5qGnnstV" media="(prefers-color-scheme: dark)"><img src="https://3938213054-files.gitbook.io/~/files/v0/b/gitbook-x-prod.appspot.com/o/spaces%2FH2bFRBmIfyK3kwVKbldl%2Fuploads%2Fgit-blob-987ca2fe717bce0dbe9c1b862d51caeedadb57ed%2Fpm-governanca-armazenamento-en.png?alt=media" alt="Storage screen with the cards by type and the unified item table"></picture><figcaption><p>Storage inventory</p></figcaption></figure>

{% hint style="info" %}
Mirrored databases (**Mirrored Databases**) have their own screen: [Fabric Mirroring](/en/power-monitor/governanca/dados-e-engenharia/fabric-mirroring.md). Real-time artifacts that are not storage (Eventhouse, Reflex, Event subscriptions, KQL Querysets) are in [Real Time](/en/power-monitor/governanca/dados-e-engenharia/tempo-real.md).
{% endhint %}

## What it is for

* **Mapping the data layers** (for example, Bronze/Silver/Gold) and which workspaces each Lakehouse or Warehouse is in.
* **Analyzing impact before a change:** before changing a Lakehouse schema or decommissioning a Warehouse, seeing which semantic models and reports depend on it.
* **Investigating slowness and consumption** of a Warehouse or of a Lakehouse SQL analytics endpoint, with the [Performance Analysis](/en/power-monitor/governanca/armazenamento/analise-de-performance-sql.md).
* **Auditing access** to storage items: who is a member, who is an external guest, which applications have access.

## Features

The screen follows the [common structure of the Governance lists](/en/power-monitor/governanca/relatorios.md#common-structure-of-the-lists), with the particularities described below.

### Cards by storage type

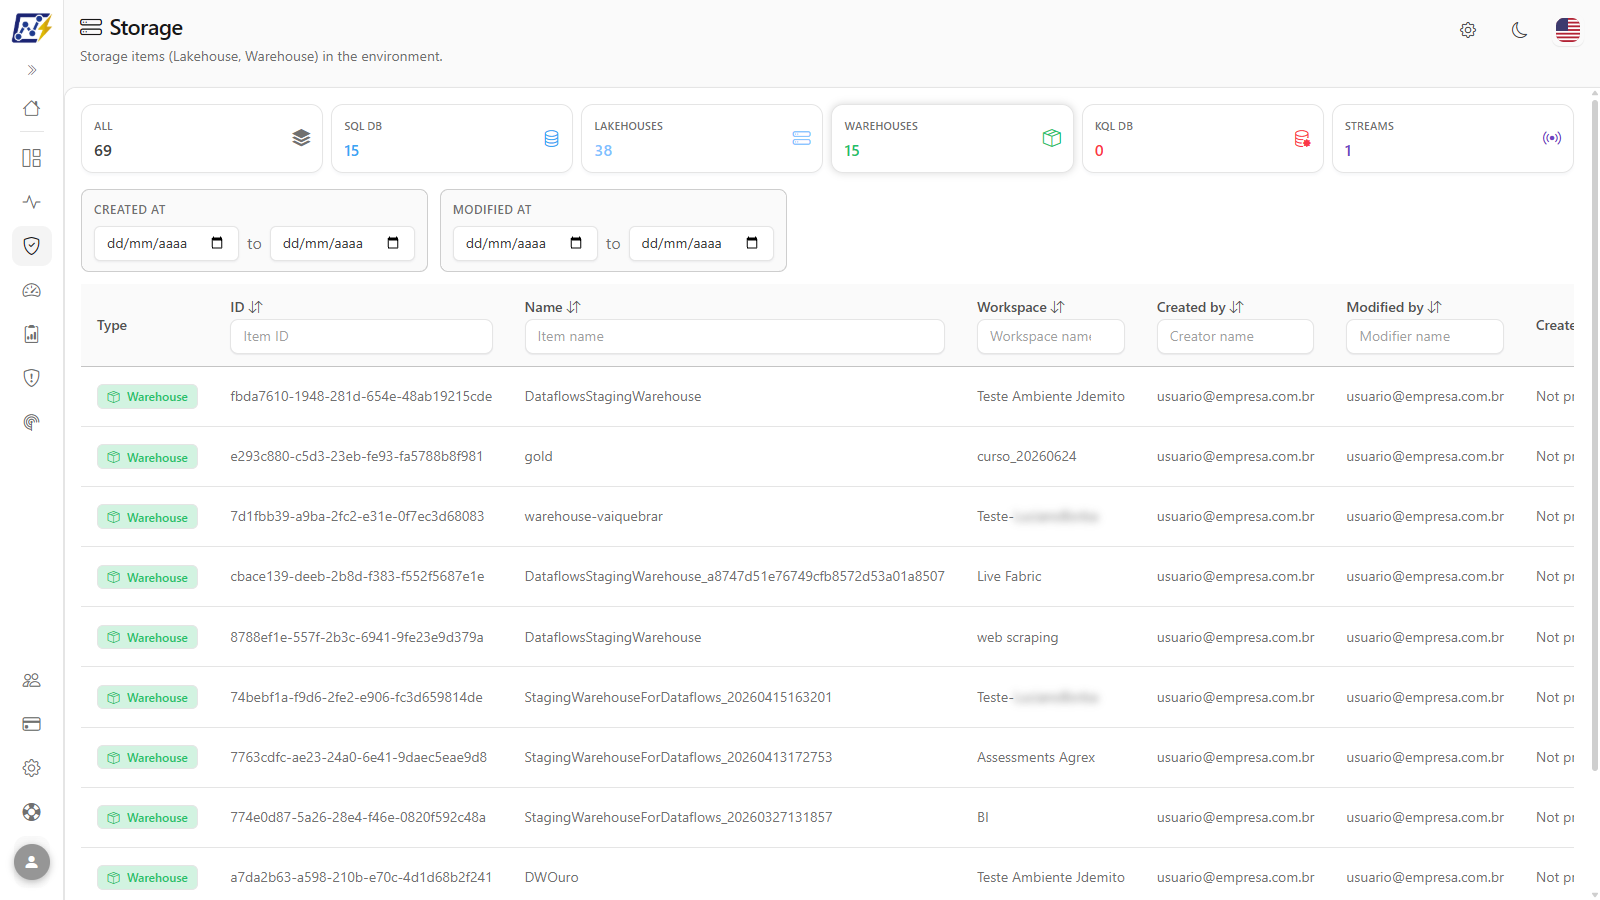
**What it is:** the strip of six cards at the top (**All**, **SQL DB**, **Lakehouses**, **Warehouses**, **KQL DB** and **Streams**) shows how many items of each type exist in the monitored workspaces you can see. Each card also works as a **tab** for the table.

**What it is for:** getting the count of the storage estate at a glance (for example, "how many Warehouses do we have?") and isolating a type with one click.

<figure><picture><source srcset="/files/V49HX1zHEqJWSSP5QVts" media="(prefers-color-scheme: dark)"><img src="https://3938213054-files.gitbook.io/~/files/v0/b/gitbook-x-prod.appspot.com/o/spaces%2FH2bFRBmIfyK3kwVKbldl%2Fuploads%2Fgit-blob-b0927ba14b08f887721f647e731d0b1ea76c0563%2Fpm-governanca-armazenamento-cards-en.png?alt=media" alt="Strip of All, SQL DB, Lakehouses, Warehouses, KQL DB and Streams cards with the count for each type"></picture><figcaption><p>Cards by storage type</p></figcaption></figure>

| Card           | Content                                      |
| -------------- | -------------------------------------------- |
| **All**        | Total storage items (sum of the five types). |
| **SQL DB**     | Fabric SQL Databases.                        |
| **Lakehouses** | Lakehouses.                                  |
| **Warehouses** | Warehouses.                                  |
| **KQL DB**     | KQL databases.                               |
| **Streams**    | Eventstreams.                                |

**How to use:**

1. In *Governance › Storage*, click a card: **SQL DB**, **Lakehouses**, **Warehouses**, **KQL DB** or **Streams**.
2. The card is highlighted and the table lists only that type, returning to the first page.
3. Click **All** to return to the full list.

<figure><picture><source srcset="/files/Nv3PA0FITXrKFzBYAOyW" media="(prefers-color-scheme: dark)"><img src="https://3938213054-files.gitbook.io/~/files/v0/b/gitbook-x-prod.appspot.com/o/spaces%2FH2bFRBmIfyK3kwVKbldl%2Fuploads%2Fgit-blob-32fcb929730c4048b6a69747650509a0f7253bed%2Fpm-governanca-armazenamento-filtro-tipo-en.png?alt=media" alt="Warehouses card selected and the table showing only Warehouses"></picture><figcaption><p>Table filtered by the Warehouses card</p></figcaption></figure>

**How it works:** the card numbers show the total for each type and **do not change** with the column filters. Column filters apply together with the selected card: for example, the **Lakehouses** card + the **Workspace** filter shows only the Lakehouses in that workspace.

### Item table

**What it is:** the unified list of storage items, one row per item, with the type in a colored badge.

**What it is for:** locating an item, knowing which workspace it is in and who created or last changed it.

<figure><picture><source srcset="/files/bNcRL9HjAON8O9vYt4gB" media="(prefers-color-scheme: dark)"><img src="https://3938213054-files.gitbook.io/~/files/v0/b/gitbook-x-prod.appspot.com/o/spaces%2FH2bFRBmIfyK3kwVKbldl%2Fuploads%2Fgit-blob-42e6a68b864d2dd7e13534ad1187d1a612e81627%2Fpm-governanca-armazenamento-colunas-filtros-en.png?alt=media" alt="Storage table header with the columns and the text filter boxes"></picture><figcaption><p>Table columns and text filters</p></figcaption></figure>

| Column          | Description                                                                     | Filter                        |
| --------------- | ------------------------------------------------------------------------------- | ----------------------------- |
| **Type**        | Badge with the item type: SQL DB, Lakehouse, Warehouse, KQL DB or Event Stream. | —                             |
| **ID**          | Identifier (GUID) of the item in Fabric.                                        | Text (*Item ID*)              |
| **Name**        | Item name.                                                                      | Text (*Item name*)            |
| **Workspace**   | Item's workspace.                                                               | Text (*Workspace name or ID*) |
| **Created by**  | Account that created the item.                                                  | Text (*Creator name*)         |
| **Modified by** | Account of the last change.                                                     | Text (*Modifier name*)        |
| **Created at**  | Creation date.                                                                  | Date range (above the table)  |
| **Modified at** | Date of the last change.                                                        | Date range (above the table)  |

**How to use:** click a row to open the item details modal, or use the **⋮** button at the end of the row to open the actions menu (both described below).

**How it works:**

* Not every type has all fields. **Lakehouses** do not include *Created by* / *Modified by* in the inventory, and **Warehouses** do not include *Created at*: for a Warehouse, the *Created by* column shows the account that configured the item. Missing fields appear as "-".
* When there are no items, the table shows "No storage artifacts found".

### Text filters by column

**What it is:** search boxes just below the headers of the **ID**, **Name**, **Workspace**, **Created by** and **Modified by** columns.

**What it is for:** quickly finding an item by name or GUID, or listing everything a given user created or changed.

**How to use:**

1. Type the term in the column's filter box (part of the text is enough; the search is case-insensitive).
2. The table is filtered automatically, a fraction of a second after you stop typing, and returns to the first page.
3. Delete the text to remove the filter. Filters on different columns are combined.

**How it works:** the **Workspace** filter accepts both the workspace name and ID; the **ID** filter accepts the item's GUID in Fabric.

### Date filters (Created at and Modified at)

**What it is:** two date range selectors above the table (**Created at** and **Modified at**), each with a start date and an end date.

**What it is for:** answering questions such as "which Lakehouses were created this month?" or "what was changed since the last change window?".

<figure><picture><source srcset="/files/4TXDWrQlZIcQA2n2PJZZ" media="(prefers-color-scheme: dark)"><img src="https://3938213054-files.gitbook.io/~/files/v0/b/gitbook-x-prod.appspot.com/o/spaces%2FH2bFRBmIfyK3kwVKbldl%2Fuploads%2Fgit-blob-3e97972460e0328c31183db8e01a910043bbe87f%2Fpm-governanca-armazenamento-filtros-data-en.png?alt=media" alt="Created at and Modified at date range selectors above the table"></picture><figcaption><p>Date range filters</p></figcaption></figure>

**How to use:**

1. In the **Created at** (or **Modified at**) selector, choose the start date and/or the end date. You can enter just one of the two.
2. The table shows only the items within the range.
3. Clear the dates to remove the filter.

**How it works:**

* Dates are interpreted in your browser's **local day**: the end date includes the whole day (up to 23:59:59).
* Items without the corresponding date (for example, Warehouses in **Created at**) are excluded when that date filter is filled in.
* When you fill in a date filter, the table is sorted by that date: **from oldest to newest** when there is a start date, and from newest to oldest when there is only an end date.

### Sorting and pagination

**What it is:** click a column header to sort the table; the footer has the pagination.

**What it is for:** seeing what changed most recently first, grouping items from the same workspace or sorting by name.

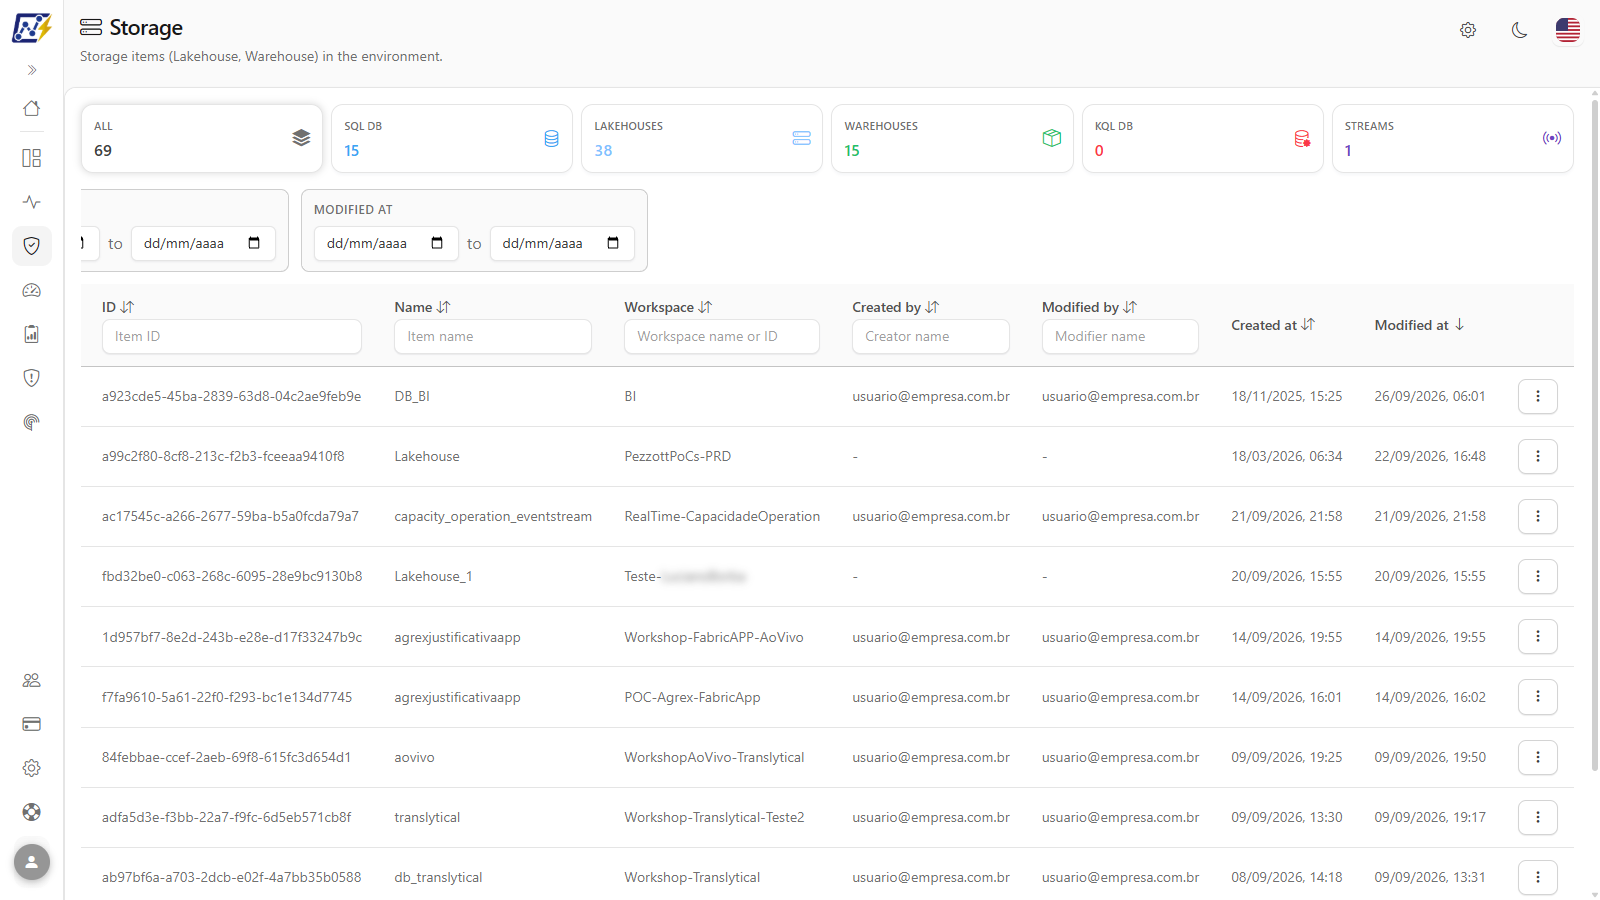
<figure><picture><source srcset="/files/Uq4svhXoate2ieX2MPpo" media="(prefers-color-scheme: dark)"><img src="https://3938213054-files.gitbook.io/~/files/v0/b/gitbook-x-prod.appspot.com/o/spaces%2FH2bFRBmIfyK3kwVKbldl%2Fuploads%2Fgit-blob-5b562ddc1ed91f59aac35d84b7a37bb679d8ef61%2Fpm-governanca-armazenamento-ordenacao-paginacao-en.png?alt=media" alt="Storage table sorted by the Name column, with pagination in the footer"></picture><figcaption><p>Table sorted by the Name column</p></figcaption></figure>

**How to use:**

1. Click a column header (**ID**, **Name**, **Workspace**, **Created by**, **Modified by**, **Created at** or **Modified at**). The first click sorts in descending order; click again to reverse. The **Type** column cannot be sorted.
2. Use the pagination in the footer to move between pages.

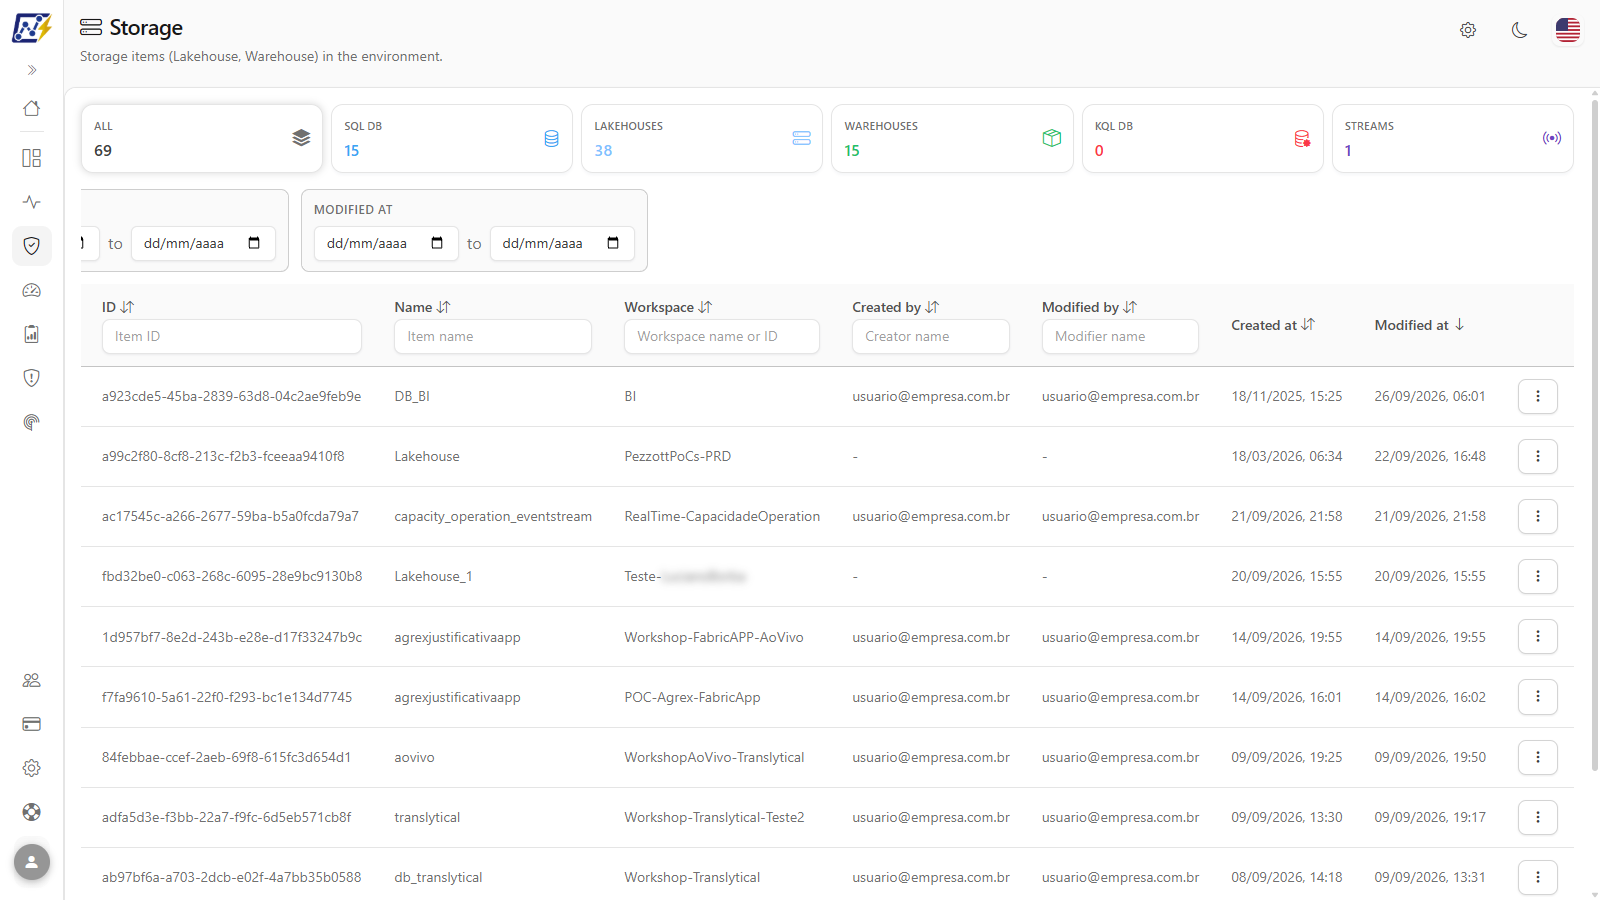
**How it works:** the default sort is **Modified at**, from newest to oldest. There are 10 items per page. When sorting by date, items without that date go to the end of the list.

### Actions menu

**What it is:** the menu opened by the **⋮** button at the end of the row, or by right-clicking the row.

**What it is for:** opening the details modal directly on the desired tab and reaching the Performance Analysis.

<figure><picture><source srcset="/files/y5tngV2sYKDF0Bhe99tN" media="(prefers-color-scheme: dark)"><img src="https://3938213054-files.gitbook.io/~/files/v0/b/gitbook-x-prod.appspot.com/o/spaces%2FH2bFRBmIfyK3kwVKbldl%2Fuploads%2Fgit-blob-5f645060f782d42caac76062edcf65850173603c%2Fpm-governanca-armazenamento-menu-acoes-en.png?alt=media" alt="Actions menu of a Warehouse with Open details and Performance Analysis"></picture><figcaption><p>Actions menu of a Warehouse</p></figcaption></figure>

| Action                   | What it does                                                                                                                                     | Available for                              |
| ------------------------ | ------------------------------------------------------------------------------------------------------------------------------------------------ | ------------------------------------------ |
| **Open details**         | Direct click: opens the modal on the **Overview** tab. On hover, it opens the submenu *Overview*, *Users & Permissions* and *Lineage*.           | SQL DB, Lakehouse, Warehouse, Event Stream |
| **Performance Analysis** | Opens the item's [Performance Analysis](/en/power-monitor/governanca/armazenamento/analise-de-performance-sql.md) page (below the menu divider). | Lakehouse and Warehouse                    |

<figure><picture><source srcset="/files/9BDu801sVrPPm0R7Ek9B" media="(prefers-color-scheme: dark)"><img src="https://3938213054-files.gitbook.io/~/files/v0/b/gitbook-x-prod.appspot.com/o/spaces%2FH2bFRBmIfyK3kwVKbldl%2Fuploads%2Fgit-blob-73a4715d492e5da0d47ccab244b69e9119918295%2Fpm-governanca-armazenamento-menu-submenu-detalhes-en.png?alt=media" alt="Actions menu of a Lakehouse with the Open details submenu open showing Overview, Users and Permissions and Lineage"></picture><figcaption><p>Open details submenu</p></figcaption></figure>

**How to use:**

1. Click the row's **⋮** button (or right-click the row).
2. Click **Open details** to open the **Overview**, or hover over **Open details** and choose **Overview**, **Users & Permissions** or **Lineage** in the submenu.
3. On Warehouses and Lakehouses, choose **Performance Analysis** to open the SQL endpoint diagnosis.

**How it works:** **KQL databases** have no actions menu or details modal: they appear only in the inventory. Near the edge of the screen, the submenu opens to the side or upward, so as not to leave the visible area.

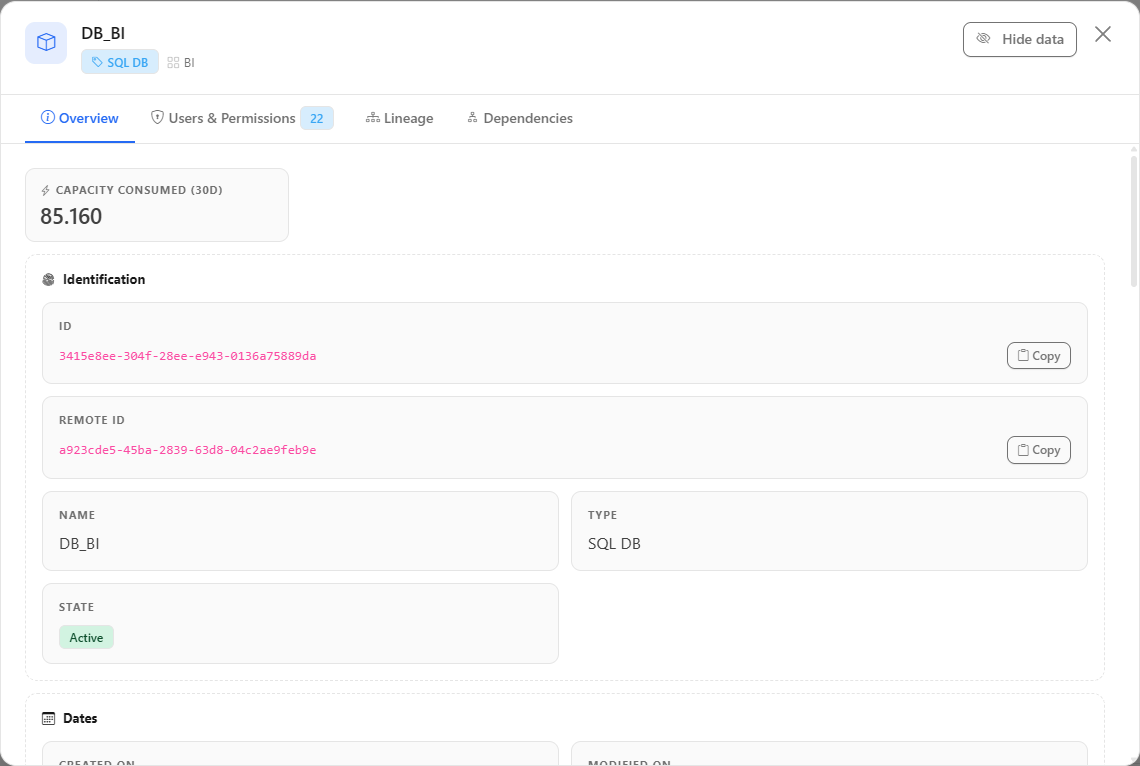
### Details modal: Overview

**What it is:** the modal opened by clicking a row, with the item's registration data. The tabs at the top are **Overview**, **Users & Permissions**, **Lineage** and **Dependencies**.

**What it is for:** checking the item identifier, which workspace it is in and who created and changed it.

<figure><picture><source srcset="/files/kTlh6LImmklUuUHztuTU" media="(prefers-color-scheme: dark)"><img src="https://3938213054-files.gitbook.io/~/files/v0/b/gitbook-x-prod.appspot.com/o/spaces%2FH2bFRBmIfyK3kwVKbldl%2Fuploads%2Fgit-blob-bb6d1c3ab02c8a9f600f291285a82a9646970244%2Fpm-governanca-armazenamento-modal-visao-geral-en.png?alt=media" alt="Details modal of a Lakehouse on the Overview tab with ID, name, type, workspace and dates"></picture><figcaption><p>Details modal: Overview tab</p></figcaption></figure>

**How to use:**

1. Click the item's row (any type, except KQL DB). The modal opens on the **Overview** tab.
2. Use **Copy** next to the ID to copy the item identifier (the button shows **Copied!**).
3. Switch between the tabs at the top; close with the **X**.

**How it works:** the tab shows **ID**, **Name**, **Type**, **Workspace**, **Created on**, **Modified on**, **Created by** and **Modified by**. Fields with no value in the inventory (for example, *Created on* for a Warehouse) are not displayed.

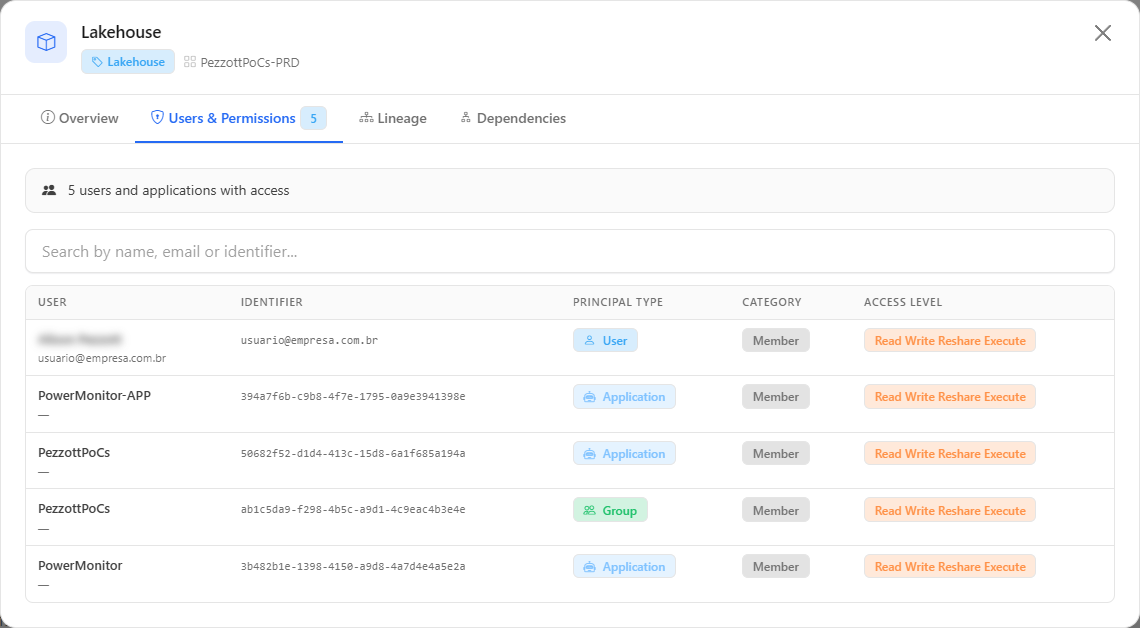
### Users & Permissions

**What it is:** the modal tab that lists the people, groups and applications (Service Principals) with access to the item.

**What it is for:** reviewing access during audits, identifying external guests and confirming whether an application has permission on the item.

<figure><picture><source srcset="/files/AP1y6YrRQfnEtTpvX1mt" media="(prefers-color-scheme: dark)"><img src="https://3938213054-files.gitbook.io/~/files/v0/b/gitbook-x-prod.appspot.com/o/spaces%2FH2bFRBmIfyK3kwVKbldl%2Fuploads%2Fgit-blob-8e49e2c900d0ced9ec97d7608e98128cba89f85a%2Fpm-governanca-armazenamento-modal-usuarios-en.png?alt=media" alt="Users and Permissions tab with the search and the User, Identifier, Principal Type, Category and Access Level columns"></picture><figcaption><p>Users &#x26; Permissions tab</p></figcaption></figure>

**How to use:**

1. In the row's **⋮** menu, hover over **Open details** and choose **Users & Permissions** (or open the modal and click the tab).
2. See the summary "*N* users and applications with access".
3. Type in the **Search by name, email or identifier...** box to find someone.

**How it works:** the columns are **User**, **Identifier**, **Principal Type** (*User*, *Application* or *Group*), **Category** (*Member* or *Guest/External*) and **Access Level**. With no recorded access, the tab shows "No users found.".

{% hint style="warning" %}
This tab displays user names and emails. Be careful when copying, pasting or sharing screenshots and lists, especially when they involve customer data.
{% endhint %}

### Reverse lineage

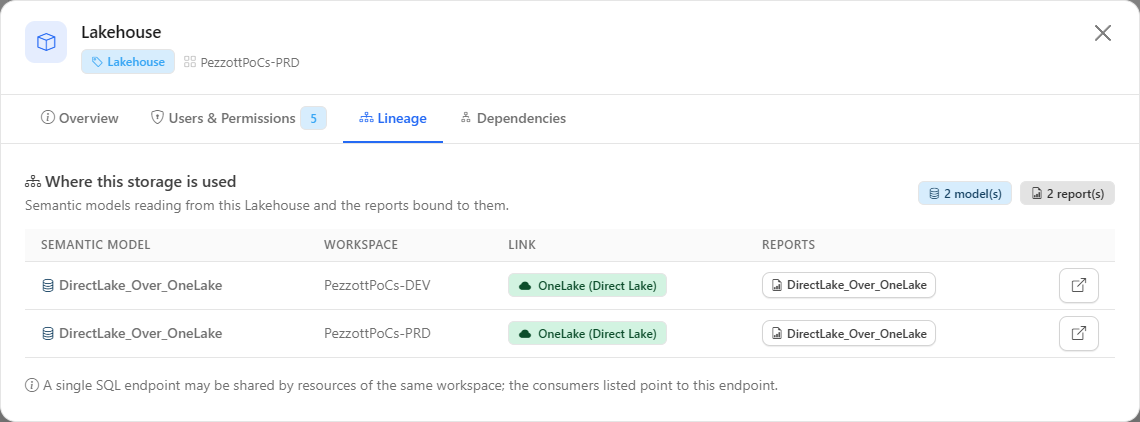
**What it is:** the **Lineage** tab of the modal, titled **Where this storage is used**. It lists the semantic models that read from the Lakehouse or Warehouse and the reports bound to them.

**What it is for:** answering "if I change this Lakehouse/Warehouse, what breaks?" before a schema change, migration or decommissioning.

<figure><picture><source srcset="/files/72fmUMVTlmudT3rN39Y9" media="(prefers-color-scheme: dark)"><img src="https://3938213054-files.gitbook.io/~/files/v0/b/gitbook-x-prod.appspot.com/o/spaces%2FH2bFRBmIfyK3kwVKbldl%2Fuploads%2Fgit-blob-d32612c5793e1c021c435686ff0d652cad0013a8%2Fpm-governanca-armazenamento-modal-linhagem-en.png?alt=media" alt="Lineage tab of a Lakehouse listing the consuming semantic models and their reports"></picture><figcaption><p>Reverse lineage: where this storage is used</p></figcaption></figure>

**How to use:**

{% stepper %}
{% step %}

#### Locate the item

Click the **Lakehouses** (or **Warehouses**) card and type the name in the **Name** column filter.
{% endstep %}

{% step %}

#### Open the lineage

In the row's **⋮** menu, hover over **Open details** and choose **Lineage**. The tab shows the counters "*N* model(s)" and "*N* report(s)".
{% endstep %}

{% step %}

#### Assess the impact

Review the table: the **Link** column indicates whether the model reads through the **SQL endpoint** or through **OneLake (Direct Lake)**. Use **Open model in Power BI** and **Open report in Power BI** to check each consumer.
{% endstep %}

{% step %}

#### Identify whom to notify

Open the semantic model in [Semantic Models](/en/power-monitor/governanca/modelos-semanticos.md) to see the owner and the users with access, and coordinate the change with them.
{% endstep %}
{% endstepper %}

| Column             | Description                                                                                                                                                              |
| ------------------ | ------------------------------------------------------------------------------------------------------------------------------------------------------------------------ |
| **Semantic model** | Model that reads from this storage, with the **Open model in Power BI** shortcut.                                                                                        |
| **Workspace**      | Model's workspace.                                                                                                                                                       |
| **Link**           | How the model connects: **SQL endpoint** (connection through the SQL analytics endpoint address) or **OneLake (Direct Lake)** (direct reading of the tables in OneLake). |
| **Reports**        | Reports bound to the model, each with the **Open report in Power BI** shortcut ("No reports" when there are none).                                                       |

**How it works:**

* The lineage is built from what the scans have already collected (model connections, Power Query expressions and OneLake paths): a model that has not yet gone through the model mapping scan may not appear. With no known consumers, the tab shows "No known semantic model consumes this storage."
* If reading fails, the tab shows "Could not load the lineage of this storage." with the option to try again.

{% hint style="warning" %}
**Available for Lakehouses and Warehouses.** For SQL Databases and Eventstreams the tab shows that reverse lineage is not available yet: the Fabric inventory does not provide, for these types, the connection identification needed to match consumers.

A single SQL endpoint can be shared by items in the same workspace; in that case the listed consumers point to the endpoint, and not necessarily to that specific item.
{% endhint %}

### Dependencies

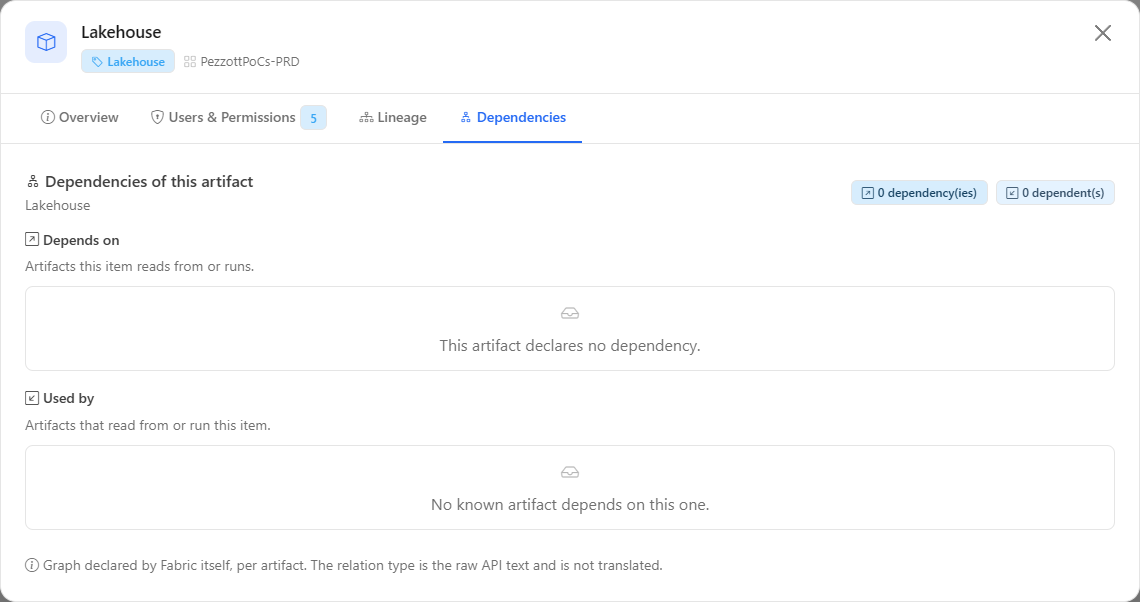
**What it is:** the **Dependencies** tab of the modal (**Dependencies of this artifact**) shows the relations that Fabric itself declares between the item and other artifacts, in two lists: **Depends on** (artifacts this item reads from or runs) and **Used by** (artifacts that read from or run this item).

**What it is for:** finding out which pipelines, notebooks, Dataflows, Copy Jobs and other items write to or read from the Lakehouse/Warehouse: it complements reverse lineage, which covers semantic models and reports.

<figure><picture><source srcset="/files/1qqbx420nhfvUF3WY3Yn" media="(prefers-color-scheme: dark)"><img src="https://3938213054-files.gitbook.io/~/files/v0/b/gitbook-x-prod.appspot.com/o/spaces%2FH2bFRBmIfyK3kwVKbldl%2Fuploads%2Fgit-blob-a06b7266e5014cdcb4167f9ed0e3a74ad364ba5e%2Fpm-governanca-armazenamento-modal-dependencias-en.png?alt=media" alt="Dependencies tab with the dependency and dependent counters and the Depends on and Used by lists"></picture><figcaption><p>Dependencies tab</p></figcaption></figure>

**How to use:**

1. Click the item's row to open the details modal.
2. Click the **Dependencies** tab.
3. See the counters "*N* dependency(ies)" and "*N* dependent(s)" and review the **Depends on** and **Used by** lists, with the **Artifact**, **Type**, **Relation type** and **Identifier** columns.

**How it works:**

* The graph comes from the dependencies declared by Fabric for each artifact. The **Relation type** is the original API text and is not translated.
* When the other end is outside the monitored scope (unmonitored workspace, type not collected or item not yet scanned), it appears as "Unidentified artifact", with the GUID, and the counter "*N* outside the monitored scope". The dependency is real; only the name is not available.
* An item that declares no dependencies and that no other item references shows "There is no dependency graph for this artifact."

### Access to Performance Analysis

**What it is:** the **Performance Analysis** item in the **⋮** menu, available for **Warehouses** and **Lakehouses**.

**What it is for:** investigating T-SQL queries, Capacity Units consumption and scheduled tasks of a Warehouse or a Lakehouse SQL analytics endpoint. See the [Performance Analysis](/en/power-monitor/governanca/armazenamento/analise-de-performance-sql.md) page.

**How to use:**

1. Click the **Warehouses** or **Lakehouses** card and locate the item.
2. Click the row's **⋮** button and choose **Performance Analysis** (below the menu divider). The option does not appear for SQL DB, KQL DB and Event Stream.
3. The analysis page opens with the **Last 24 hours** period. To go back, use the **Storage** link in the path at the top of the page.

**How it works:** the Performance Analysis is opened **only** from this menu (it has no item of its own in the side menu) and follows the same access as the Storage screen, including per-user page blocking.

### Loading error messages

**What it is:** notices displayed in the upper right corner when one of the storage types could not be loaded, for example "Failed to load warehouses.".

**What it is for:** knowing that the list is incomplete at that moment, without losing the other types.

**How it works:** each type is loaded independently. If one fails, the others remain in the list and in the cards; reload the page to try again.

## Rules and behavior

* Only items from **monitored workspaces** appear; items deleted in the tenant leave the list and go to [Deleted Artifacts](/en/power-monitor/governanca/operacao/artefatos-excluidos.md).
* Users with a restricted scope see only the items in the workspaces granted to them.
* The inventory is updated by the inventory scans: see [Inventory Scan](/en/power-monitor/mapeamento/inventarios.md).
* The screen has no export of its own (CSV, Excel, PNG or PDF).

## Frequently asked questions

<details>

<summary>Why doesn't the Mirrored Database appear here anymore?</summary>

Mirrored databases got a dedicated screen, with synchronization status: [Fabric Mirroring](/en/power-monitor/governanca/dados-e-engenharia/fabric-mirroring.md).

</details>

<details>

<summary>A Lakehouse was deleted in Fabric but still appears in the list.</summary>

The deletion is detected by the inventory scan. After the next cycle that reaches the workspace, the item leaves the list and starts appearing in [Deleted Artifacts](/en/power-monitor/governanca/operacao/artefatos-excluidos.md).

</details>

<details>

<summary>Why don't I see the Performance Analysis option for a SQL Database?</summary>

The Performance Analysis is based on the SQL analytics endpoint's Query Insights and is available for **Warehouses** and **Lakehouses**.

</details>

<details>

<summary>Why can't I open the details of a KQL database?</summary>

KQL databases appear only in the inventory: they have no details modal or actions menu on this screen.

</details>

<details>

<summary>I filtered by Created at and the Warehouses disappeared.</summary>

The Fabric inventory does not report the creation date of Warehouses. Items without the date are excluded when that date filter is filled in; use **Modified at** for them.

</details>

<details>

<summary>A Lakehouse's Lineage tab is empty, but I know there are reports using it.</summary>

Check whether the semantic models that read from the Lakehouse are in monitored workspaces and whether they have already gone through the model mapping scan. Models that connect through a server address different from the registered SQL endpoint (for example, through an alias) cannot be matched.

</details>

## Related pages

* [Performance Analysis](/en/power-monitor/governanca/armazenamento/analise-de-performance-sql.md)
* [Fabric Mirroring](/en/power-monitor/governanca/dados-e-engenharia/fabric-mirroring.md)
* [Real Time](/en/power-monitor/governanca/dados-e-engenharia/tempo-real.md)
* [Semantic Models](/en/power-monitor/governanca/modelos-semanticos.md)
* [Data Lineage](/en/power-monitor/qualidade-de-dados/linhagem-de-dados.md)


---

# Agent Instructions
This documentation is published with GitBook. GitBook is the documentation platform designed so that both humans and AI agents can read, navigate, and reason over technical content effectively. Learn more at gitbook.com.

## Querying This Documentation
If you need additional information that is not directly available in this page, you can query the documentation by asking a question.

Perform an HTTP GET request on the following URL with the `ask` and `goal` query parameters:

```
GET https://docs.powermonitor.com.br/en/power-monitor/governanca/armazenamento.md?ask=<question>&goal=<user_goal>
```

`ask` is the immediate question: it should be specific, self-contained, and written in natural language.
`goal` is what the user is ultimately trying to achieve, the reason they need the answer. Sharing it helps GitBook give you a better, more relevant answer. A goal is most helpful when it describes the outcome the user wants rather than restating the question. For example, with `ask=how do I create an API token`, a goal like `automate deployments from our CI pipeline` lets GitBook tailor the answer to that use case.

The response will contain a direct answer to the question and relevant excerpts and sources from the documentation.

Use this mechanism when the answer is not explicitly present in the current page, you need clarification or additional context, or you want to retrieve related documentation sections.