> For the complete documentation index, see [llms.txt](https://docs.powermonitor.com.br/llms.txt). Markdown versions of documentation pages are available by appending `.md` to page URLs; this page is available as [Markdown](https://docs.powermonitor.com.br/en/power-monitor/governanca/armazenamento/analise-de-performance-sql.md).

# Performance Analysis

Performance diagnostics for Warehouses and the Lakehouse SQL analytics endpoint, T-SQL queries, impact score, diagnoses, regressions, concurrency, cache, failures, SQL Pool, scheduled tasks and Capaci

**Performance Analysis** is a complete diagnosis of a Microsoft Fabric **Warehouse** or **Lakehouse SQL analytics endpoint**. It reads the T-SQL query history of the item itself (Query Insights), cross-references it with the consumption recorded in Capacity Metrics and with the related scheduled tasks, and answers the questions an administrator asks when "the Warehouse is slow" or "it is consuming too much": *what ran, who ran it, what got worse, what weighs the most and where to start optimizing*.

**How to access:** in *Governance › Storage*, open the **⋮** menu of a **Warehouse** or **Lakehouse** and choose **Performance Analysis**. It also opens from the *Performance › Lakehouse and Warehouse* menu, where you pick the item by name (see [Lakehouse and Warehouse](/en/power-monitor/performance/lakehouse-e-warehouse.md)). Access is the same as for the Storage screen: all profiles can use it, within their workspace scope. The page is **read-only**: no action changes the item or Fabric.

<figure><picture><source srcset="/files/hZPzvV6wCAwCkCPuwknS" media="(prefers-color-scheme: dark)"><img src="https://3938213054-files.gitbook.io/~/files/v0/b/gitbook-x-prod.appspot.com/o/spaces%2FH2bFRBmIfyK3kwVKbldl%2Fuploads%2Fgit-blob-af8abf4e99f714837f59139abd22d1c6e4c71e6c%2Fpm-governanca-analise-performance-visao-geral-en.png?alt=media" alt="Performance Analysis of a Warehouse with the header, the period selector, the Refresh and Export buttons and the available tabs"></picture><figcaption><p>Performance Analysis of a Warehouse</p></figcaption></figure>

{% hint style="warning" %}
The page displays **SQL query text, logins, program names and hosts** from the environment. Be careful when copying, pasting or sharing screenshots and query excerpts, especially when they contain customer data. The SQL text is not included in PNG/PDF exports.
{% endhint %}

## What it is for

* **Prioritizing optimizations:** the *impact score* ranks query patterns by the actual weight they have on the item (CPU, time, reads, failures, regression), so you tackle what matters most first.
* **Understanding a slowdown:** finding out whether the problem is remote reads (cold cache), CPU, SQL Pool pressure, concurrency, a query regression or "death by a thousand cuts".
* **Investigating a peak:** selecting an interval on the chart and seeing exactly what ran in that window.
* **Attributing consumption:** seeing who (login) and what (client application) consumes the Warehouse the most, and how many Capacity Units the item spent.
* **Tracking tasks:** pipelines, notebooks, Dataflows Gen2, Copy Jobs and semantic models related to the item, with schedules, runs and consumption.

## Prerequisites

* The Power Monitor **Service Principal** must be a **workspace administrator** of the item's workspace (use **Add Service Principal** in [Workspaces](/en/power-monitor/governanca/workspaces.md) or in Settings › Additional Permissions) and the tenant must allow Service Principals to access Fabric.
* The item must have **Query Insights** (the default in Fabric Warehouses and SQL analytics endpoints).
* For the **Capacity and cost** and **Scheduled tasks** tabs, Power Monitor uses data it already collects: Capacity Metrics consumption, Fabric Jobs runs and semantic model refreshes. These monitoring features must be enabled.
* To see **all** sessions on the *Live* tab, the Service Principal needs permission to view the database state (for example, `VIEW DATABASE STATE`); without it, it sees only its own sessions and the page warns "Limited visibility".

## Features

### Header and item identification

**What it is:** the top of the page, with the path *Governance · Storage · Performance Analysis* (or *Performance · Lakehouse and Warehouse*, when opened from the Performance menu), the item name, the subtitle according to the type and the context chips. For a Lakehouse, the type title is **SQL Analytics Performance**.

**What it is for:** confirming which item is being analyzed, which workspace it is in and with what visibility Power Monitor was able to read the SQL endpoint.

<figure><picture><source srcset="/files/0Jds6ltG3Eb2NQNgu4Ci" media="(prefers-color-scheme: dark)"><img src="https://3938213054-files.gitbook.io/~/files/v0/b/gitbook-x-prod.appspot.com/o/spaces%2FH2bFRBmIfyK3kwVKbldl%2Fuploads%2Fgit-blob-34c9ce18958cc7aa6290c2f0f102217733402dd7%2Fpm-governanca-analise-performance-bloqueio-en.png?alt=media" alt="Performance Analysis header with breadcrumb, workspace and endpoint chips, period selector and Refresh and Export buttons"></picture><figcaption><p>Header, period and actions</p></figcaption></figure>

**How to use:**

1. Check the item name and the subtitle (Warehouse: diagnosis of the T-SQL queries; Lakehouse: Lakehouse view with the SQL endpoint grouped).
2. Hover over the chips to see what each one represents: **Workspace**, **SQL endpoint (host / database)** and **Visibility** (*full*, *limited* or *unknown*).
3. Click **Storage** in the path at the top to return to the list (when the analysis was opened from Storage). When opened from the *Performance › Lakehouse and Warehouse* menu, the **Analyze another item** field stays above the tabs so you can switch items without going back to the picker.

**How it works:** on a Lakehouse, a fixed note reminds you that Spark, notebooks and OneLake appear through the consumption recorded in Capacity Metrics and the related tasks; the tabs in the **SQL endpoint** group cover only the T-SQL executed on the SQL analytics endpoint.

### Period selector

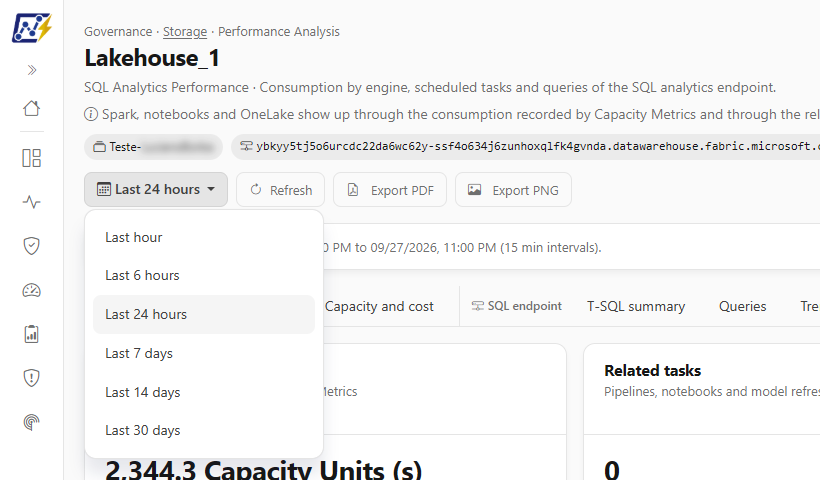
**What it is:** the button with a calendar icon that shows the current period and opens the list of periods.

**What it is for:** analyzing anything from the last hour (an ongoing incident) to the last 30 days (trend and regressions).

<figure><picture><source srcset="/files/L2NLiwfCTBHqD49Dkjf2" media="(prefers-color-scheme: dark)"><img src="https://3938213054-files.gitbook.io/~/files/v0/b/gitbook-x-prod.appspot.com/o/spaces%2FH2bFRBmIfyK3kwVKbldl%2Fuploads%2Fgit-blob-d115113fad0a8b0ff96861da3dec207525667437%2Fpm-governanca-analise-performance-periodo-en.png?alt=media" alt="Period selector open with the options from Last hour to Last 30 days"></picture><figcaption><p>Period selector</p></figcaption></figure>

**How to use:**

1. At the top of the page, click the period selector.
2. Choose **Last hour**, **Last 6 hours**, **Last 24 hours**, **Last 7 days**, **Last 14 days** or **Last 30 days**.
3. The tabs are recalculated for the new period (the progress screen appears again). The notice "Analyzed period: … (*N* min intervals)" confirms the scope.

**How it works:**

* The default when the page opens is **Last 24 hours**.
* The period also defines the size of the chart intervals: 1 min (1 h), 5 min (6 h), 15 min (24 h), 60 min (7 and 14 days) and 1 day (30 days, from local midnight).
* The **Live** tab does not depend on the period and is not reread when it changes.
* The selector and the tabs are disabled while reading is in progress. Long periods (7 to 30 days) can take a few minutes on items with many queries.

### Refresh

**What it is:** the **Refresh** button in the header.

**What it is for:** rereading the data after fixing a permission, or to include the most recent queries.

**How to use:** click **Refresh**. All reads are redone (T-SQL, capacity, scheduled tasks and **Live**) for the selected period.

**How it works:** when the tab already had data for the same period, it remains visible and a thin bar above the content shows the progress of the new read. The button is disabled during the read.

### Export PDF and PNG

**What it is:** the **Export PDF** and **Export PNG** buttons in the header.

**What it is for:** attaching the analysis to a support ticket, meeting minutes or a capacity report.

**How to use:**

1. Open the tab you want to record and wait for loading to finish (the buttons are disabled during the read).
2. Click **Export PDF** or **Export PNG**. The button shows **Exporting…** while it generates the file.
3. The file is downloaded by the browser.

**How it works:** the file contains the current tab, without the screen controls (selectors, buttons, tab bar) and without the query text. In case of error, the screen reports "Could not export the dashboard. Please try again.".

### Read notices

**What it is:** the strip of notices just below the header.

**What it is for:** knowing exactly which time range is being shown and which limitations apply to the numbers.

**How it works:** the possible notices are:

* "Analyzed period: … (*N* min intervals).": the effective scope;
* on the T-SQL tabs, the reminder that Query Insights takes **about 15 minutes** to record queries (executions from a given time may not appear yet);
* "The period was limited to the 30-day Query Insights retention.";
* **Limited visibility**, when the Service Principal sees only part of the sessions.

### Progress screen

**What it is:** the screen that takes the place of the tab content while the data is being read.

**What it is for:** following long reads over long periods, knowing which step the analysis is at.

**How it works:** it shows the actual steps of the analysis (locating the item, authenticating the Service Principal, connecting to the SQL endpoint, reading Query Insights ("*X* of *Y* queries completed"), computing diagnoses and score, reading consumption and fetching scheduled tasks) and the elapsed time. The page updates on its own when it finishes; there is no need to reload.

### Tabs by item type

**What it is:** the tab bar below the notices. Warehouse and Lakehouse have different sets of tabs.

**What it is for:** navigating between the angles of the analysis (queries, trend, cache, users, failures, pool, tasks, capacity and live sessions).

<figure><picture><source srcset="/files/7XKhhotwgX6lDX00NOym" media="(prefers-color-scheme: dark)"><img src="https://3938213054-files.gitbook.io/~/files/v0/b/gitbook-x-prod.appspot.com/o/spaces%2FH2bFRBmIfyK3kwVKbldl%2Fuploads%2Fgit-blob-b85ad8750856d7e949ec7de7cbc50648227e8c57%2Fpm-governanca-analise-performance-abas-en.png?alt=media" alt="Performance Analysis tab bar"></picture><figcaption><p>Tab bar</p></figcaption></figure>

| Warehouse                 | Lakehouse                                                                                                                                                             |
| ------------------------- | --------------------------------------------------------------------------------------------------------------------------------------------------------------------- |
| **Overview** (T-SQL)      | **Overview** (Lakehouse view)                                                                                                                                         |
| **Queries**               | **Scheduled tasks**                                                                                                                                                   |
| **Trend and concurrency** | **Capacity and cost**                                                                                                                                                 |
| **Cache and storage**     | **SQL endpoint** group: **T-SQL summary**, **Queries**, **Trend and concurrency**, **Cache and storage**, **Users and origins**, **Failures**, **SQL Pool**, **Live** |
| **Users and origins**     |                                                                                                                                                                       |
| **Failures**              |                                                                                                                                                                       |
| **SQL Pool**              |                                                                                                                                                                       |
| **Scheduled tasks**       |                                                                                                                                                                       |
| **Capacity and cost**     |                                                                                                                                                                       |
| **Live**                  |                                                                                                                                                                       |

**How to use:**

1. Click the name of the desired tab (on narrow screens, the tabs become a drop-down list).
2. **Lakehouse:** start with **Overview**, **Scheduled tasks** and **Capacity and cost**; the T-SQL tabs are grouped under **SQL endpoint**. On the Lakehouse Overview, the shortcuts **Open the SQL endpoint tabs →** and **See capacity and cost →** take you straight to those tabs.

**How it works:**

* The active tab is recorded in the page address: when you copy the link from the browser, whoever opens it (with access to the item) lands on the same tab.
* When the SQL endpoint cannot be read, only the tabs that do not depend on it appear: **Scheduled tasks** and **Capacity and cost** (and, on a Lakehouse, also the **Overview**).

### Overview: KPI cards

**What it is:** the strip of six cards at the top of the **Overview** (Warehouse) or the **T-SQL summary** (Lakehouse), with the numbers for the period.

**What it is for:** seeing, at a glance, the item's volume, latency, CPU cost, reads and pressure.

| Card                         | Main value                                   | Details                                                                                                             |
| ---------------------------- | -------------------------------------------- | ------------------------------------------------------------------------------------------------------------------- |
| **Executions**               | executions in the period                     | Succeeded, Failed and Canceled (count and %). Cancellation is not always an error.                                  |
| **Duration**                 | P95 (95% finish below this)                  | Average, Median (P50), P99, Maximum, Total time combined.                                                           |
| **CPU**                      | total CPU time                               | Average and P95 per execution, **CPU intensity** (CPU ÷ duration; can exceed 1× because the query is parallelized). |
| **Data reads**               | total volume read                            | OneLake (remote), Memory cache, Disk cache, Read from local cache, Rows returned.                                   |
| **Patterns and users**       | distinct queries (hashes)                    | Distinct users and sessions, distributed executions, accelerated executions, result cache reuse.                    |
| **Pressure and concurrency** | % of executions with the pool under pressure | Executions under pressure, peak and average concurrency, overlapping executions.                                    |

**How it works:** values that could not be read appear as "-", never as 0.

### What stands out

**What it is:** the block of automatic findings for the period, each with severity **Critical**, **Warning** or **Info** and the evidence level.

**What it is for:** knowing where to start without having to read all the tabs.

**How to use:** read the findings from top to bottom; click a finding that has related queries to open the [Query details](#query-details) of the first one.

**How it works:** statistical findings require at least 20 executions in the period.

| Finding                             | When it appears                                                                                         |
| ----------------------------------- | ------------------------------------------------------------------------------------------------------- |
| CPU concentration                   | The heaviest 10% of queries account for 50% or more of the CPU (Warning from 70%).                      |
| Login with the most CPU             | A single login accounts for 40% or more of the CPU.                                                     |
| Death by a thousand cuts            | There are queries with the "thousand cuts" pattern.                                                     |
| High remote reads                   | 60% or more of the reads came from OneLake, with at least 1 GB read.                                    |
| Regression                          | Some query regressed (Critical if with strong evidence).                                                |
| Slowness under pressure             | 30% or more of the slow executions occurred with the pool under pressure.                               |
| High failure rate                   | 5% or more failures (Critical from 20%).                                                                |
| Pool pressure                       | The pool was under pressure in the period (Warning from 20% of the time).                               |
| Cache opportunity                   | Repeated queries that never used the result cache.                                                      |
| Limited visibility / latency notice | Part of the data could not be read, or the period ends now (recent queries may not have been recorded). |

### Activity over time chart

**What it is:** the chart on the **Overview** / **T-SQL summary** with the evolution of a metric per interval. Amber bands mark the moments when the **SQL Pool was under pressure**.

**What it is for:** seeing when the load happened and selecting the exact stretch of a slowness complaint to investigate.

**How to use:**

1. In the **Metric** selector, choose **Executions**, **CPU**, **Average duration**, **P95 duration**, **OneLake reads**, **Failures**, **Cancels**, **Active users** or **Concurrency**. The chart is redrawn.
2. To investigate a stretch, drag the mouse over the chart (or click a point to select that interval). Below the chart, "Selected: *start* to *end*" appears.
3. Click **Investigate window** to open [What ran in this window](#what-ran-in-this-window).

### Queries most worth investigating and Acceleration

**What it is:** on the **Overview**, the list of up to 8 query patterns with the highest [impact score](#impact-score) and the **Acceleration** card.

**What it is for:** having the short list of queries to optimize first, with the reason for each one.

**How to use:**

1. Review, for each query, the diagnoses, executions, CPU share and P95 duration.
2. Click **Explain score** to open [Why this score?](#why-this-score).
3. Click **Investigate** to open the [Query details](#query-details).

**How it works:** the **Acceleration** card compares accelerated and non-accelerated executions (average duration and CPU and ratios), when there are at least 3 on each side. It is correlation, not causation.

### Scheduled tasks summary on the Overview

**What it is:** on a Warehouse, the **Scheduled tasks** card at the end of the **Overview**, with related items, runs in the period, failed runs, consumption of the tasks themselves and the top consumers.

**What it is for:** reminding you that pipelines, notebooks and model refreshes also consume capacity and may explain the item's load.

**How to use:** click **See scheduled tasks →** to open the [Scheduled tasks](#scheduled-tasks) tab.

### Queries

**What it is:** the tab with the table of **query patterns** (*query hash*: queries with the same normalized text), 15 rows per page.

**What it is for:** comparing all patterns by criterion (CPU, time, reads, failures, regression) and choosing what to investigate.

**How to use:**

{% stepper %}
{% step %}

#### Choose the ranking

Open the **Ranking** selector and choose a criterion: *All queries*, *Highest impact*, *Most total CPU*, *Most total time*, *Most OneLake reads*, *Most total reads*, *Most executed*, *Most failures*, *Most cancels*, *Highest CPU in one execution*, *Longest execution*, *Most executions under pressure*, *Highest failure rate* or *Largest regression*. The table shows the top 10 for that criterion; **All queries** returns to the full list.
{% endstep %}

{% step %}

#### Filter

Type part of the hash or the statement type (for example, `SELECT`) in the *Hash or type* box, below the **Query (hash)** header. The table is filtered automatically.
{% endstep %}

{% step %}

#### Sort and open

Click the header of a numeric column to sort (first click descending; click again to reverse). The **Diagnoses** and **Signals** columns cannot be sorted. Click the score to open **Why this score?** or a row to open the **Query details**.
{% endstep %}
{% endstepper %}

**How it works:** the columns are **Query (hash)** and statement type, **Executions**, **Total CPU** and **Total time** (with the % share), **Average duration**, **P95 duration**, **OneLake read** (with the % remote), **Failure rate**, **Impact score**, **Diagnoses** and **Signals** (*Thousand cuts*, *Regressed* / *Improved*, *Unstable*).

{% hint style="info" %}
To keep the analysis fast, the table includes the query patterns that are among the top 25 in at least one of the ranking criteria. Patterns that are irrelevant in all criteria are not listed.
{% endhint %}

### Trend and concurrency

**What it is:** the tab that compares recent behavior with the previous one and measures query simultaneity.

**What it is for:** finding out what got worse, what is unstable and what suffers when many queries run together.

**How to use:** scroll through the blocks and click a query hash to open the details.

**How it works:**

* **What regressed**: compares the recent stretch of the period (last 25%) with the previous one, per query pattern: *Status* (Regressed, Improved, Stable, Undetermined), *Before*, *Recent*, *Change* and **Factors that changed together** (more remote reads, less cache reuse, more concurrency, more pool pressure, more rows, acceleration changed). These are correlated factors, not necessarily the cause.
* **Unstable performance**: queries with a large spread in duration: median, P95, P99, P95 ÷ median and coefficient of variation.
* **Concurrency**: simultaneous queries per interval (peak and average). At extreme volumes (more than 2 million overlapping executions), the calculation is skipped and the peak appears as unknown, not zero.
* **Concurrency sensitive**: queries whose duration grows with the concurrency at the moment they start (correlation).
* **Death by a thousand cuts**: fast queries that, due to their frequency, add up to a relevant share of the load.

### Cache and storage

**What it is:** the tab about result cache reuse and the physical source of reads.

**What it is for:** finding queries that could take advantage of the cache and queries that are slow because they read from OneLake (cold cache).

**How it works:**

* **Result cache:** how many executions reused, created or did not use a cached result, and the list of **Repeated queries that never used the cache** (SELECTs executed 5 times or more that never created or reused a cache).
* **Read source:** OneLake (remote), memory, local disk and local cache: the raw data read, not the result cache. It includes the lists **Queries with high remote reads** (60% or more remote) and **Duration follows remote reads** (correlation of 0.5 or more over at least 10 executions).
* **External APIs** (when applicable): calls, retries, external wait, volume sent/received and rows with problems.

### Users and origins

**What it is:** the tab that distributes the load by login and by client application.

**What it is for:** knowing who and what consumes the item the most: for example, a Power BI report, an ETL tool or a user in SSMS.

**How it works:**

* **Users** (load per login) and **Origins** (load per client application): executions, total CPU, total time, reads, failures/cancels, distinct queries and last execution.
* Each login is classified by its format as **Person**, **Service Principal**, **Possible service account**, **System** or **Unidentified** (the reason appears in the tooltip).
* Origins are recognized by the client program name: Power BI, SSMS, Azure Data Studio, VS Code, Fabric SQL editor, .NET SqlClient, ODBC, JDBC, Spark connector, Data Factory, dbt, Excel, Tableau, Python and others; some appear as "(to be confirmed)".
* **Statement types** (SELECT, INSERT, CTAS…) and **Sessions** (sessions, distinct logins, closed normally or killed, failed, average duration).

### Failures

**What it is:** the tab with the failures and cancellations for the period.

**What it is for:** identifying recurring errors and who or what causes them.

**How it works:** **Failures** and **Cancels** cards grouped by status and error code (occurrences, distinct queries and logins, last execution) and the **Failure details** table by query, login and program.

### SQL Pool

**What it is:** the **SQL Pool health** tab.

**What it is for:** knowing whether the slowness came from a lack of pool resources, and what was running at those moments.

**How to use:**

1. See how long the pool was **under pressure** in the period.
2. In **Pressure events**, click **What ran?** on the desired event.
3. The [What ran in this window](#what-ran-in-this-window) modal shows the queries and executions that were running during the event.

**How it works:** the tab also shows the measured time, the maximum resources, the workspace capacity, whether the pool is optimized for reads and the configuration changes. Pressure is only recorded by Fabric when it lasts for at least 1 minute.

### Live

**What it is:** the tab with the requests running **right now** on the SQL endpoint.

**What it is for:** seeing what is running at this moment (Query Insights has about a 15-minute delay) and identifying blocking between sessions.

**How to use:**

1. Click the **Live** tab. The subtitle reports the capture time ("Captured at …") and the summary "*N* requests in *N* sessions from *N* logins.".
2. Click **Refresh now** for a new capture.
3. Use the **All**, **Running**, **Waiting** and **Blocked** buttons (each with its count) to filter, and **Sort by** (**Oldest first** or **Highest CPU**) to sort.
4. A session marked **Blocking N** is blocking others; the status **Blocked by session X** indicates who is blocking.

**How it works:** the columns are **Session**, **Status**, **Command** (with the query hash), **Duration**, **CPU**, **Reads**, **Wait**, login, origin and **Start**: up to 200 requests. The capture is taken when the page opens, when you click **Refresh** at the top and when you click **Refresh now**; there is no automatic refresh, and changing the period does not redo the capture. Power Monitor's own queries are excluded. If "Limited visibility…" appears, the Service Principal sees only part of the sessions (see *Prerequisites*).

### Scheduled tasks

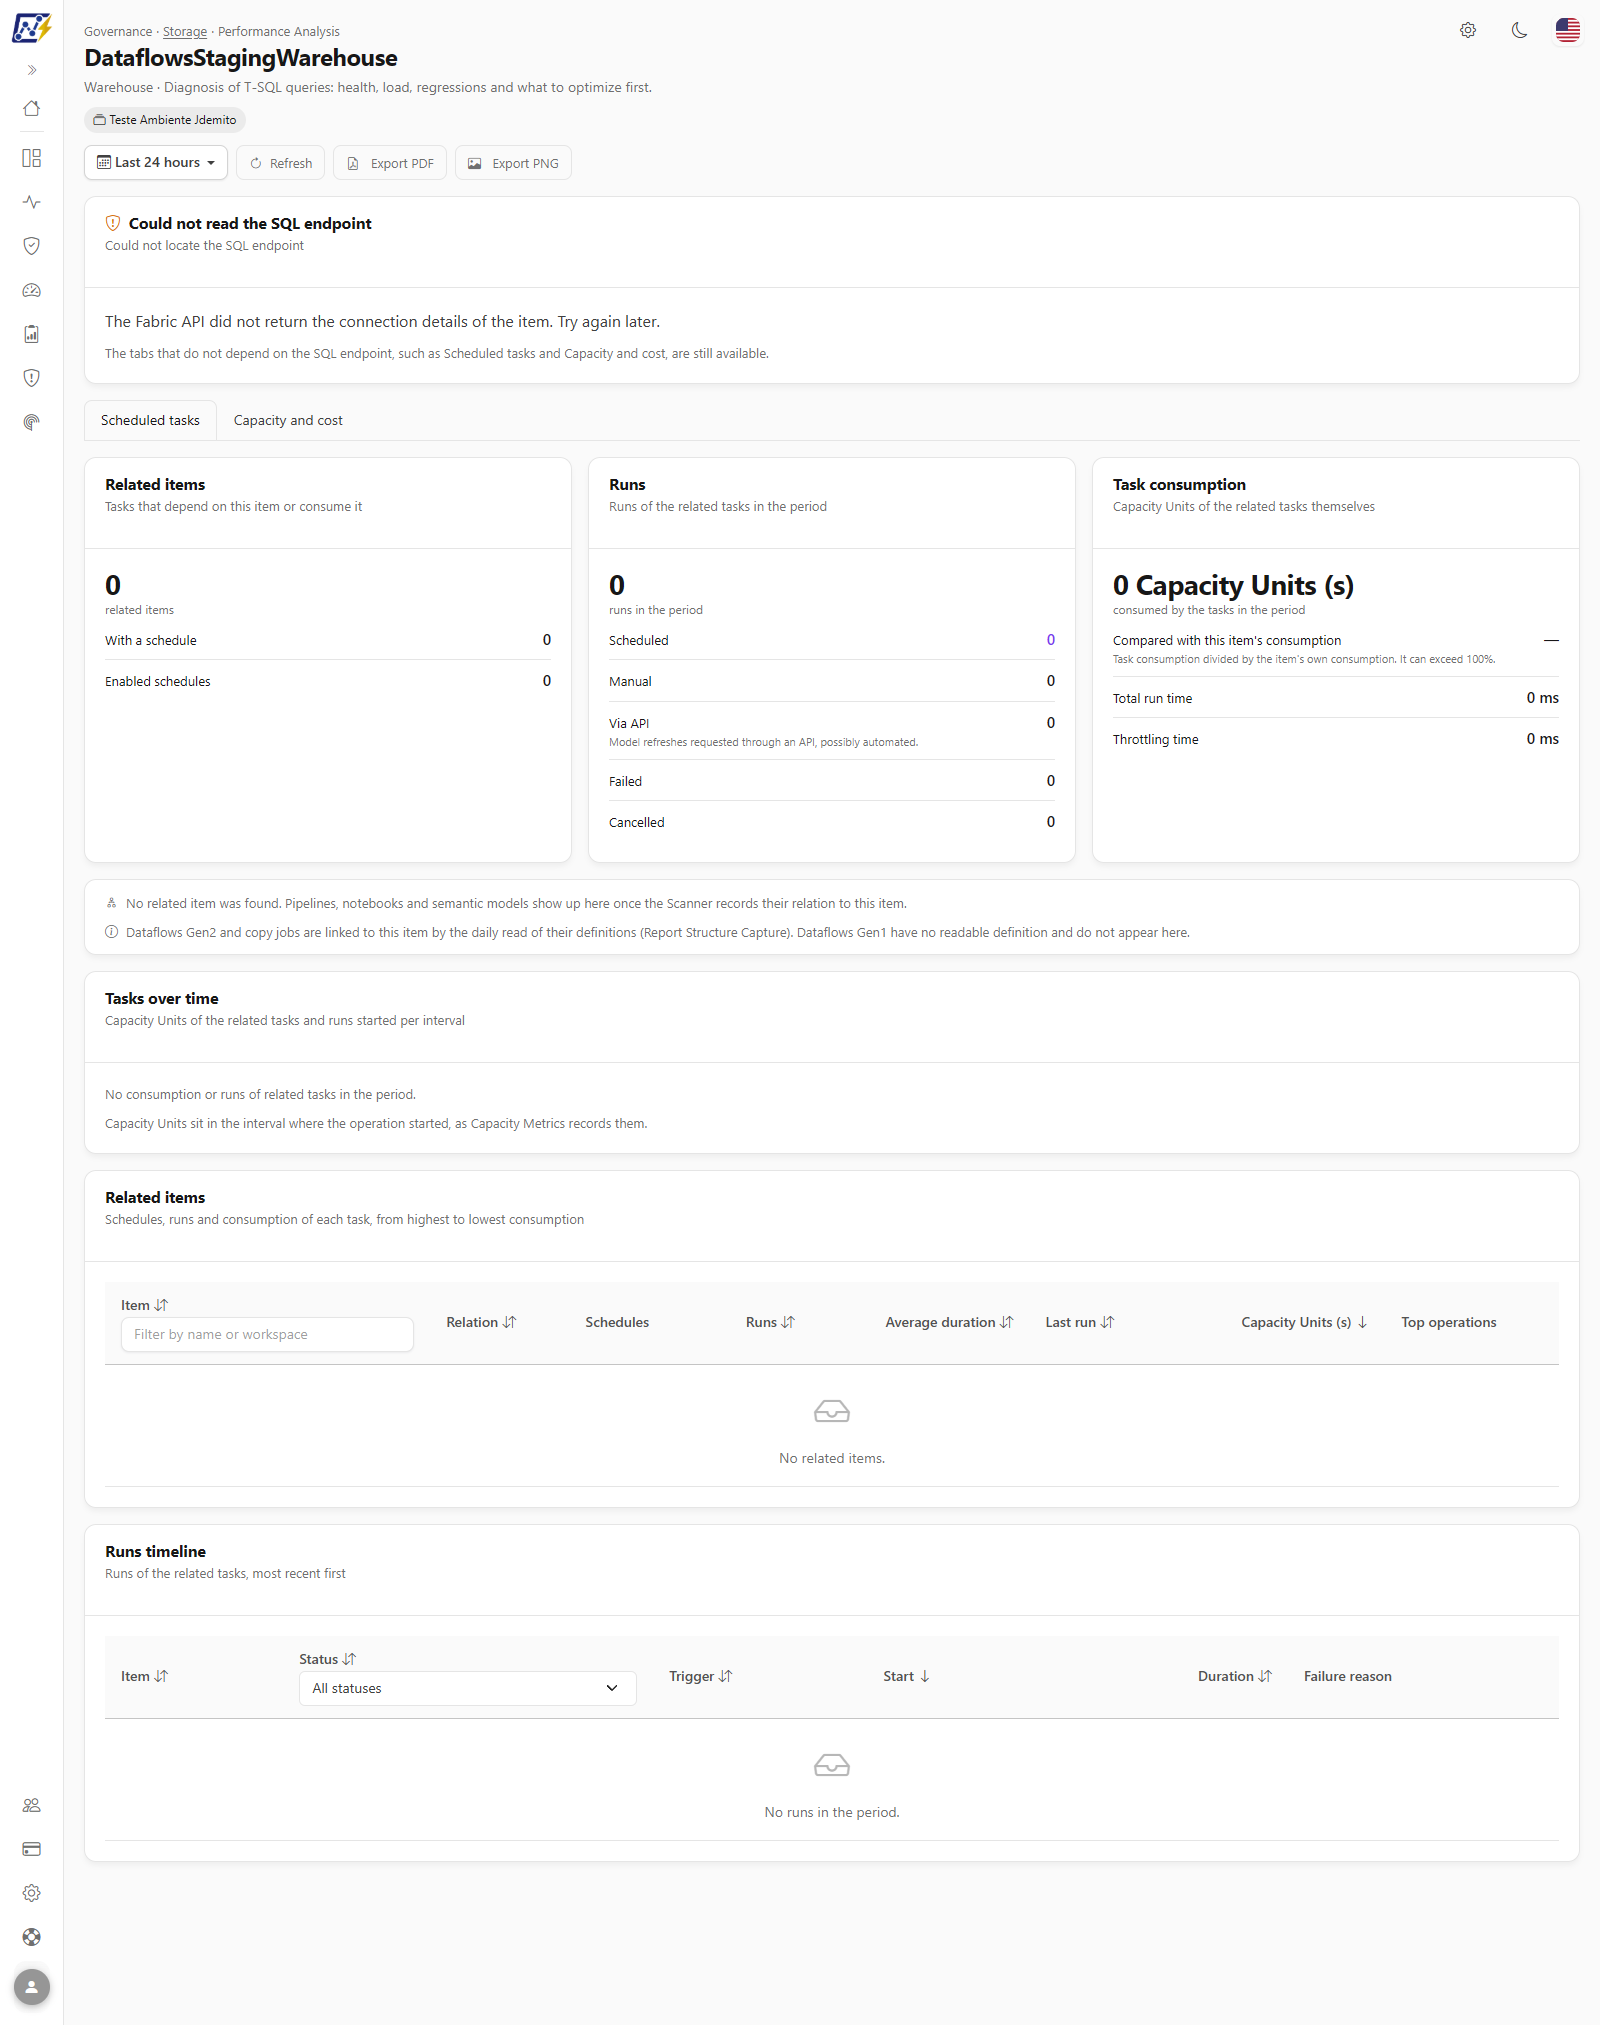
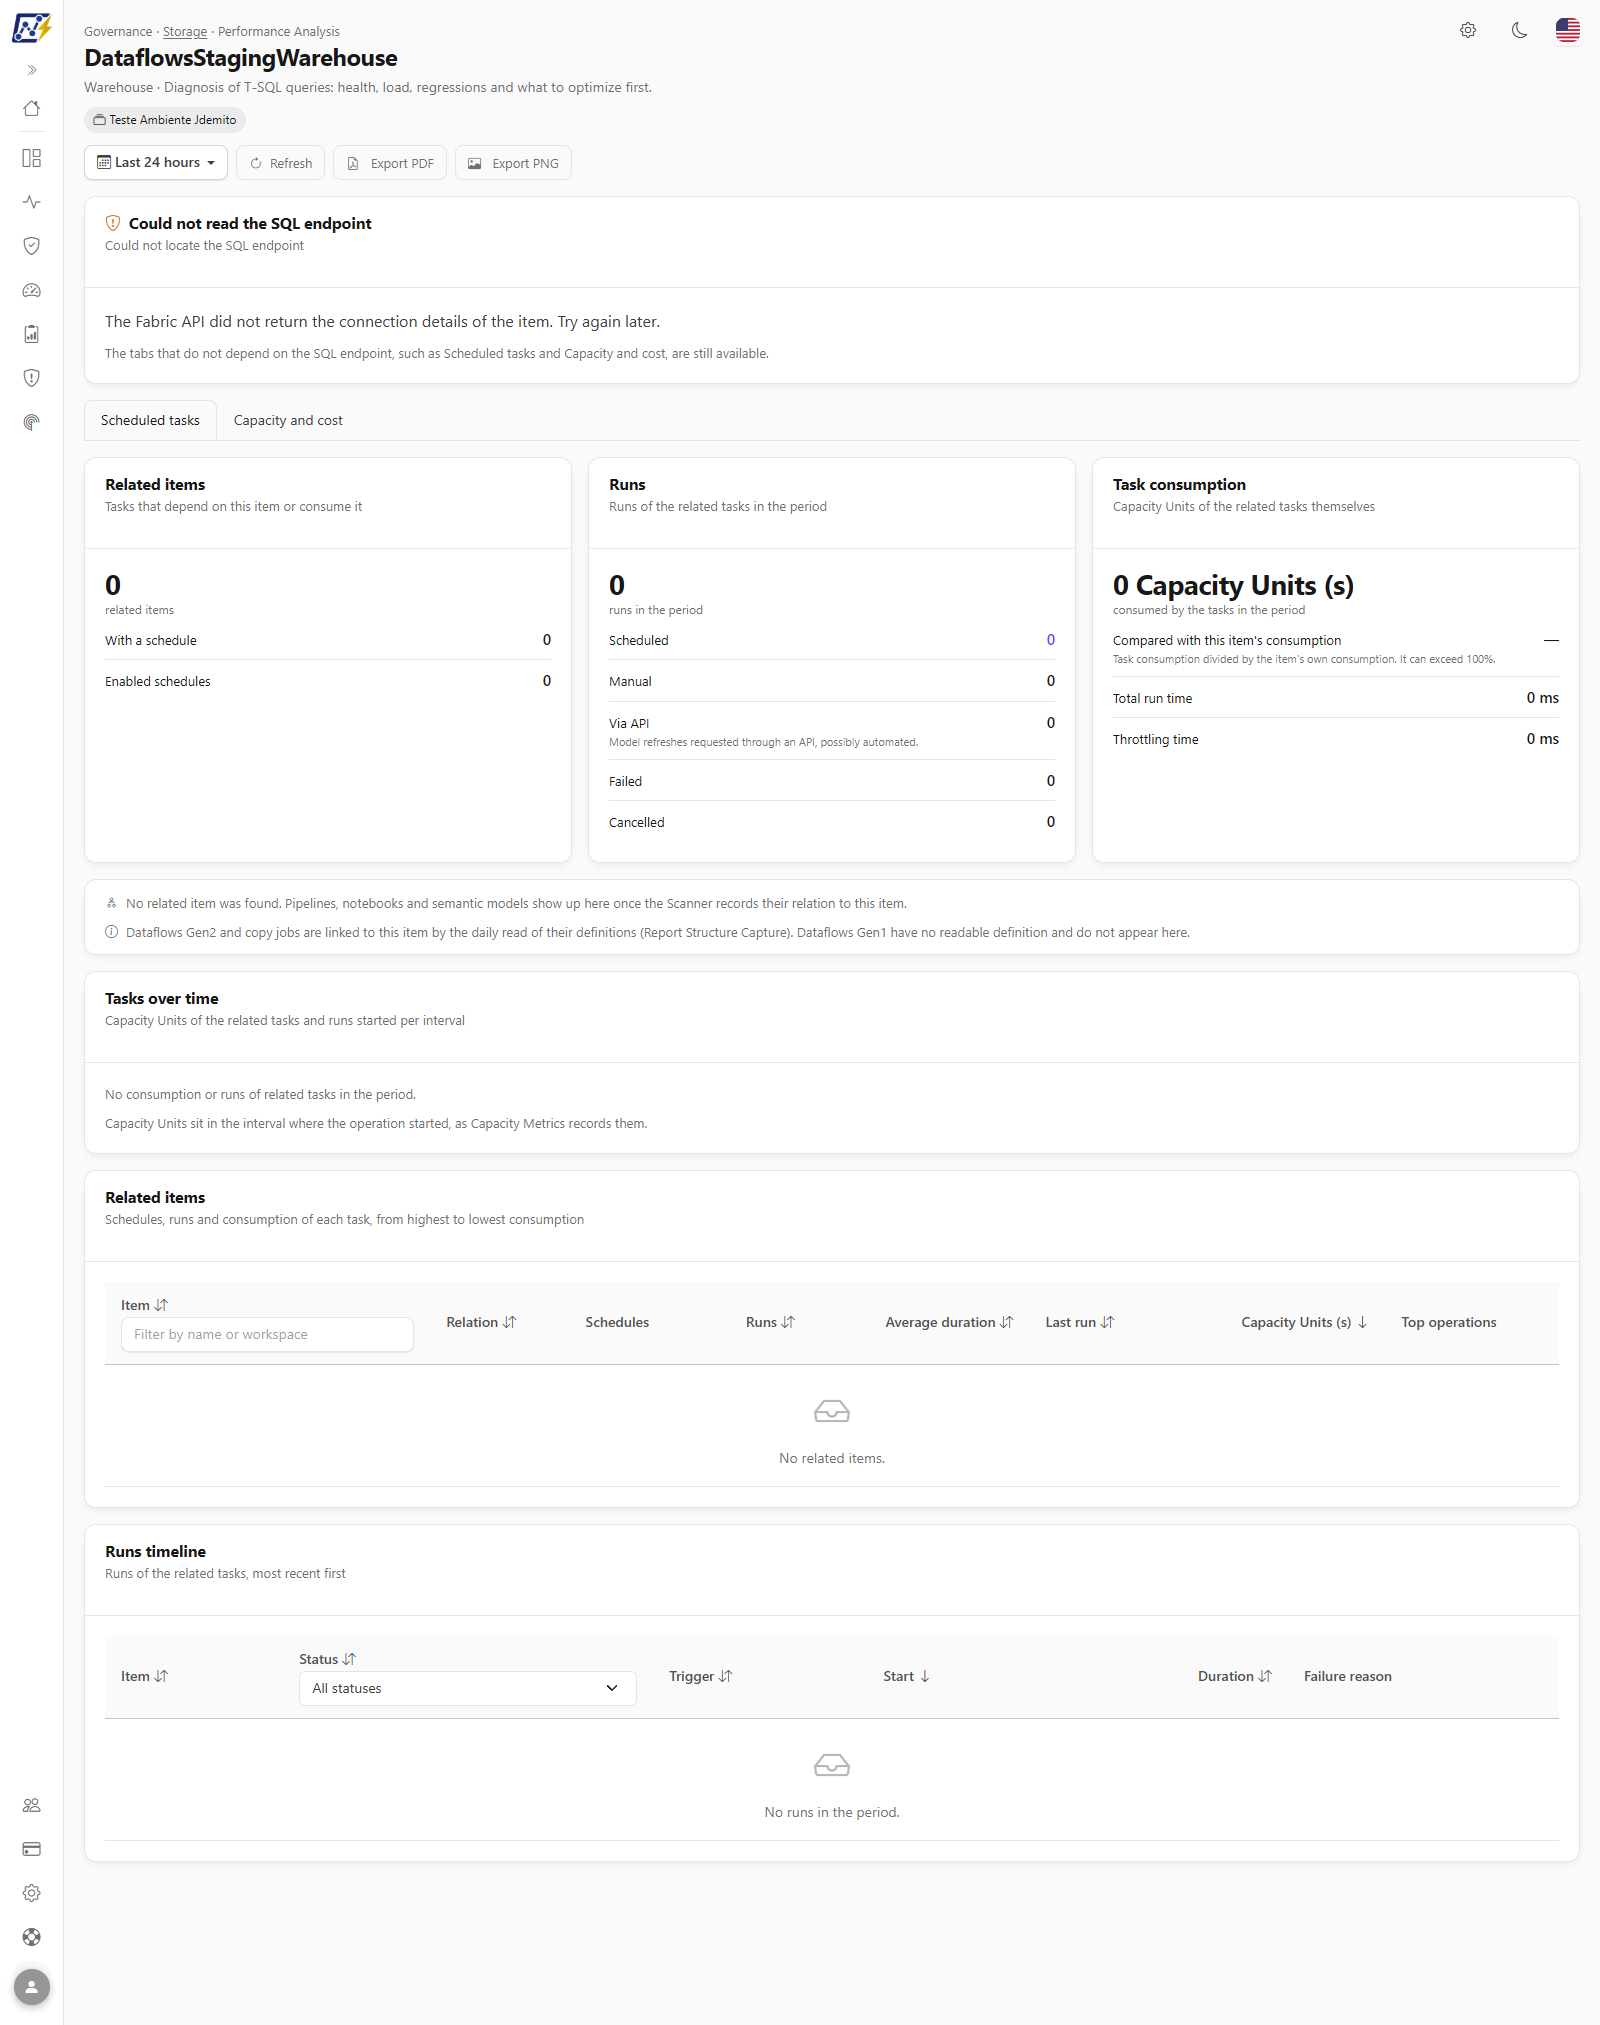
**What it is:** the tab with the items related to the Warehouse/Lakehouse (**pipelines, notebooks, Dataflows Gen2 and Copy Jobs** (through the relations declared by Fabric) and **semantic models** (through the storage lineage: SQL endpoint or OneLake)) with their schedules, runs and consumption.

**What it is for:** knowing what feeds or reads the item, when it runs, how much it consumes and what failed. It works even when the SQL endpoint cannot be read.

<figure><picture><source srcset="/files/X2wDihkxq2kwVNpWc6l8" media="(prefers-color-scheme: dark)"><img src="https://3938213054-files.gitbook.io/~/files/v0/b/gitbook-x-prod.appspot.com/o/spaces%2FH2bFRBmIfyK3kwVKbldl%2Fuploads%2Fgit-blob-8289be41a241d31aec108304a7ae8469ade35cf9%2Fpm-governanca-analise-performance-tarefas-en.png?alt=media" alt="Scheduled tasks tab with KPIs for related items, runs and consumption, chart and related items table"></picture><figcaption><p>Scheduled tasks tab</p></figcaption></figure>

**How to use:**

{% stepper %}
{% step %}

#### Open the tab

Click **Scheduled tasks** (on the Warehouse Overview, the summary card has the shortcut **See scheduled tasks →**).
{% endstep %}

{% step %}

#### Check the coverage notices

If the monitoring disabled notice appears, use **Open Fabric Items** or **Open Semantic Models** to go to the screen where collection is enabled; without it, runs do not appear.
{% endstep %}

{% step %}

#### Filter the related items

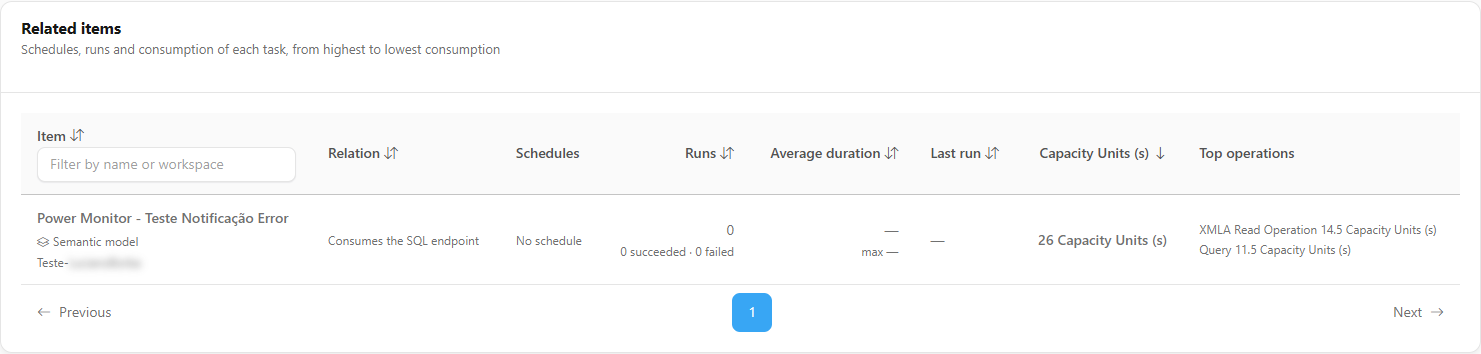
In the **Related items** table, type in *Filter by name or workspace* below the **Item** header. The table is already sorted from highest to lowest consumption; click the column headers to change the sorting.
{% endstep %}

{% step %}

#### Filter the runs

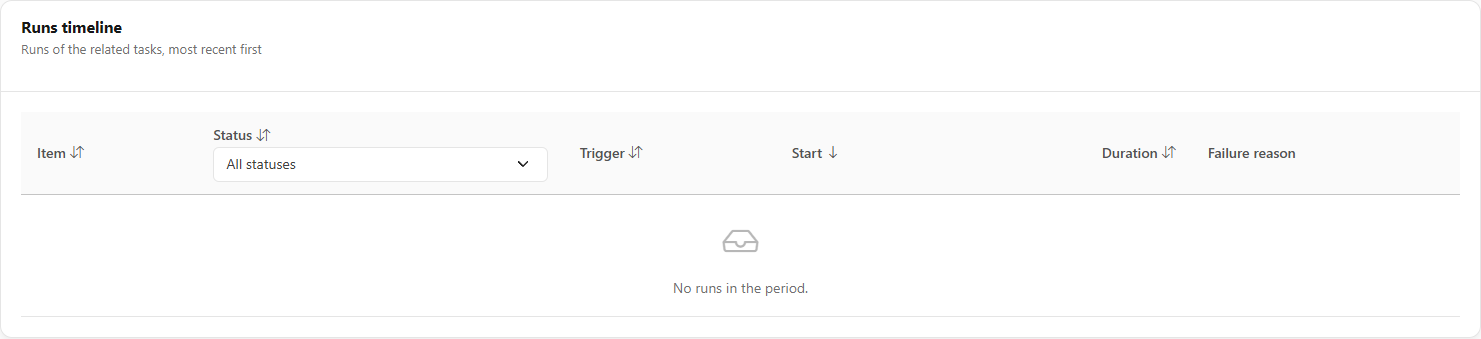
In the **Runs timeline**, choose a status in the **Status** column filter (**All statuses**, **Succeeded**, **Failed**, **Cancelled**, **In progress**, **Unknown**) to, for example, list only failures and read the **Failure reason**.
{% endstep %}
{% endstepper %}

<figure><picture><source srcset="/files/rXlJzvNvI7oIY7SD28B8" media="(prefers-color-scheme: dark)"><img src="https://3938213054-files.gitbook.io/~/files/v0/b/gitbook-x-prod.appspot.com/o/spaces%2FH2bFRBmIfyK3kwVKbldl%2Fuploads%2Fgit-blob-32a1aee22cb9f2e270b300fbbb481e92d535d132%2Fpm-governanca-analise-performance-tarefas-itens-en.png?alt=media" alt="Related items table with the filter by name or workspace and the Relation, Schedules, Runs, Average duration, Last run, Capacity Units and Top operations columns"></picture><figcaption><p>Related items</p></figcaption></figure>

<figure><picture><source srcset="/files/Xy0iLWWeUx7Mpc9ZHOTD" media="(prefers-color-scheme: dark)"><img src="https://3938213054-files.gitbook.io/~/files/v0/b/gitbook-x-prod.appspot.com/o/spaces%2FH2bFRBmIfyK3kwVKbldl%2Fuploads%2Fgit-blob-e6ca26b1c92dbc65f4c881103921b90cd6160beb%2Fpm-governanca-analise-performance-tarefas-execucoes-en.png?alt=media" alt="Runs timeline with the status filter and the Item, Trigger, Start, Duration and Failure reason columns"></picture><figcaption><p>Runs timeline</p></figcaption></figure>

**How it works:**

* **KPIs:** *Related items* (with a schedule, enabled schedules); *Runs* (scheduled, manual, via API, unknown trigger, failed, cancelled, in progress); *Task consumption* (Capacity Units consumed by the tasks, ratio to the item's own consumption (it can exceed 100%), total run time, throttling time).
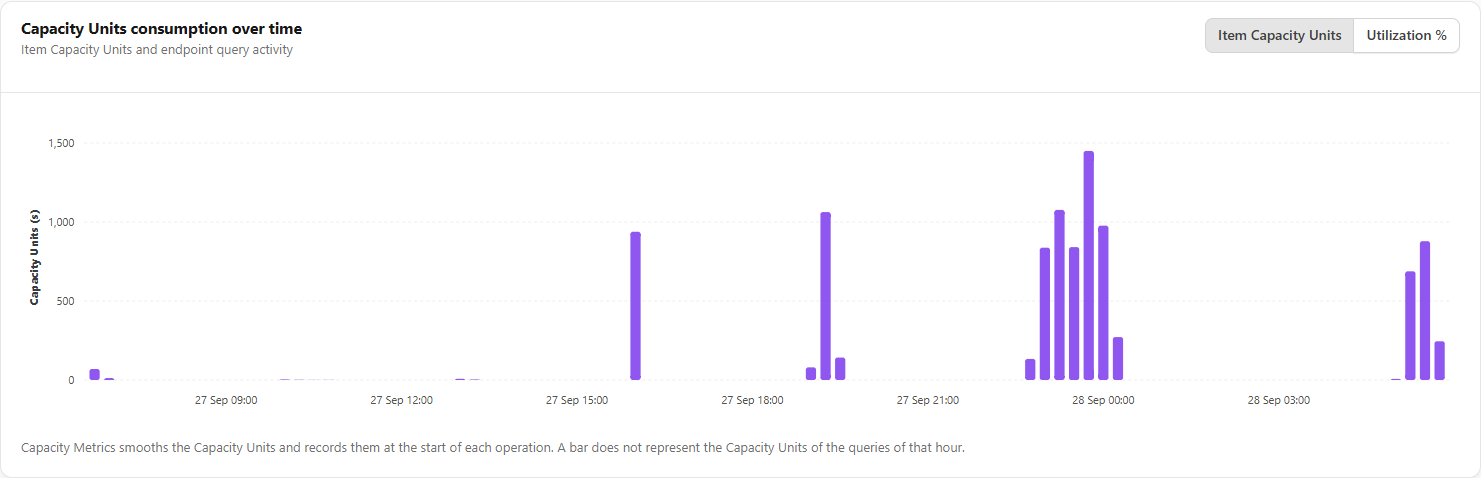
* **Tasks over time:** task Capacity Units and runs started per interval. Capacity Units are placed in the interval in which the operation started, as recorded by Capacity Metrics.
* **Related items:** **Item**, **Relation** (*Scanner relation*, *Consumes the SQL endpoint*, *Consumes OneLake*, *Other relation*), **Schedules** (recurrence type and next runs in UTC; *No schedule* or *Disabled*), **Runs** (succeeded/failed), **Average duration** (and maximum), **Last run**, **Capacity Units (s)** and **Top operations**.
* **Runs timeline:** **Item**, **Status** (*Succeeded*, *Failed*, *Cancelled*, *In progress*, *Unknown*), **Trigger** (*Scheduled*, *Manual*, *API*, *Unknown trigger*), **Start**, **Duration** and **Failure reason**, from most recent to oldest.
* **Coverage notices** appear when Fabric Jobs or semantic model monitoring is turned off (with links to [Microsoft Fabric Items](/en/power-monitor/monitoramento/itens-do-microsoft-fabric.md) and [Semantic Models](/en/power-monitor/monitoramento/modelos-semanticos.md)), when there are models linked through a shared SQL endpoint (check the relation before drawing conclusions), when the run list was truncated (maximum of 1,000), when old runs do not report the trigger, and for Dataflows Gen1, which are not covered. Dataflows Gen2 and Copy Jobs are linked to the item through the daily reading of their definitions.

### Capacity and cost

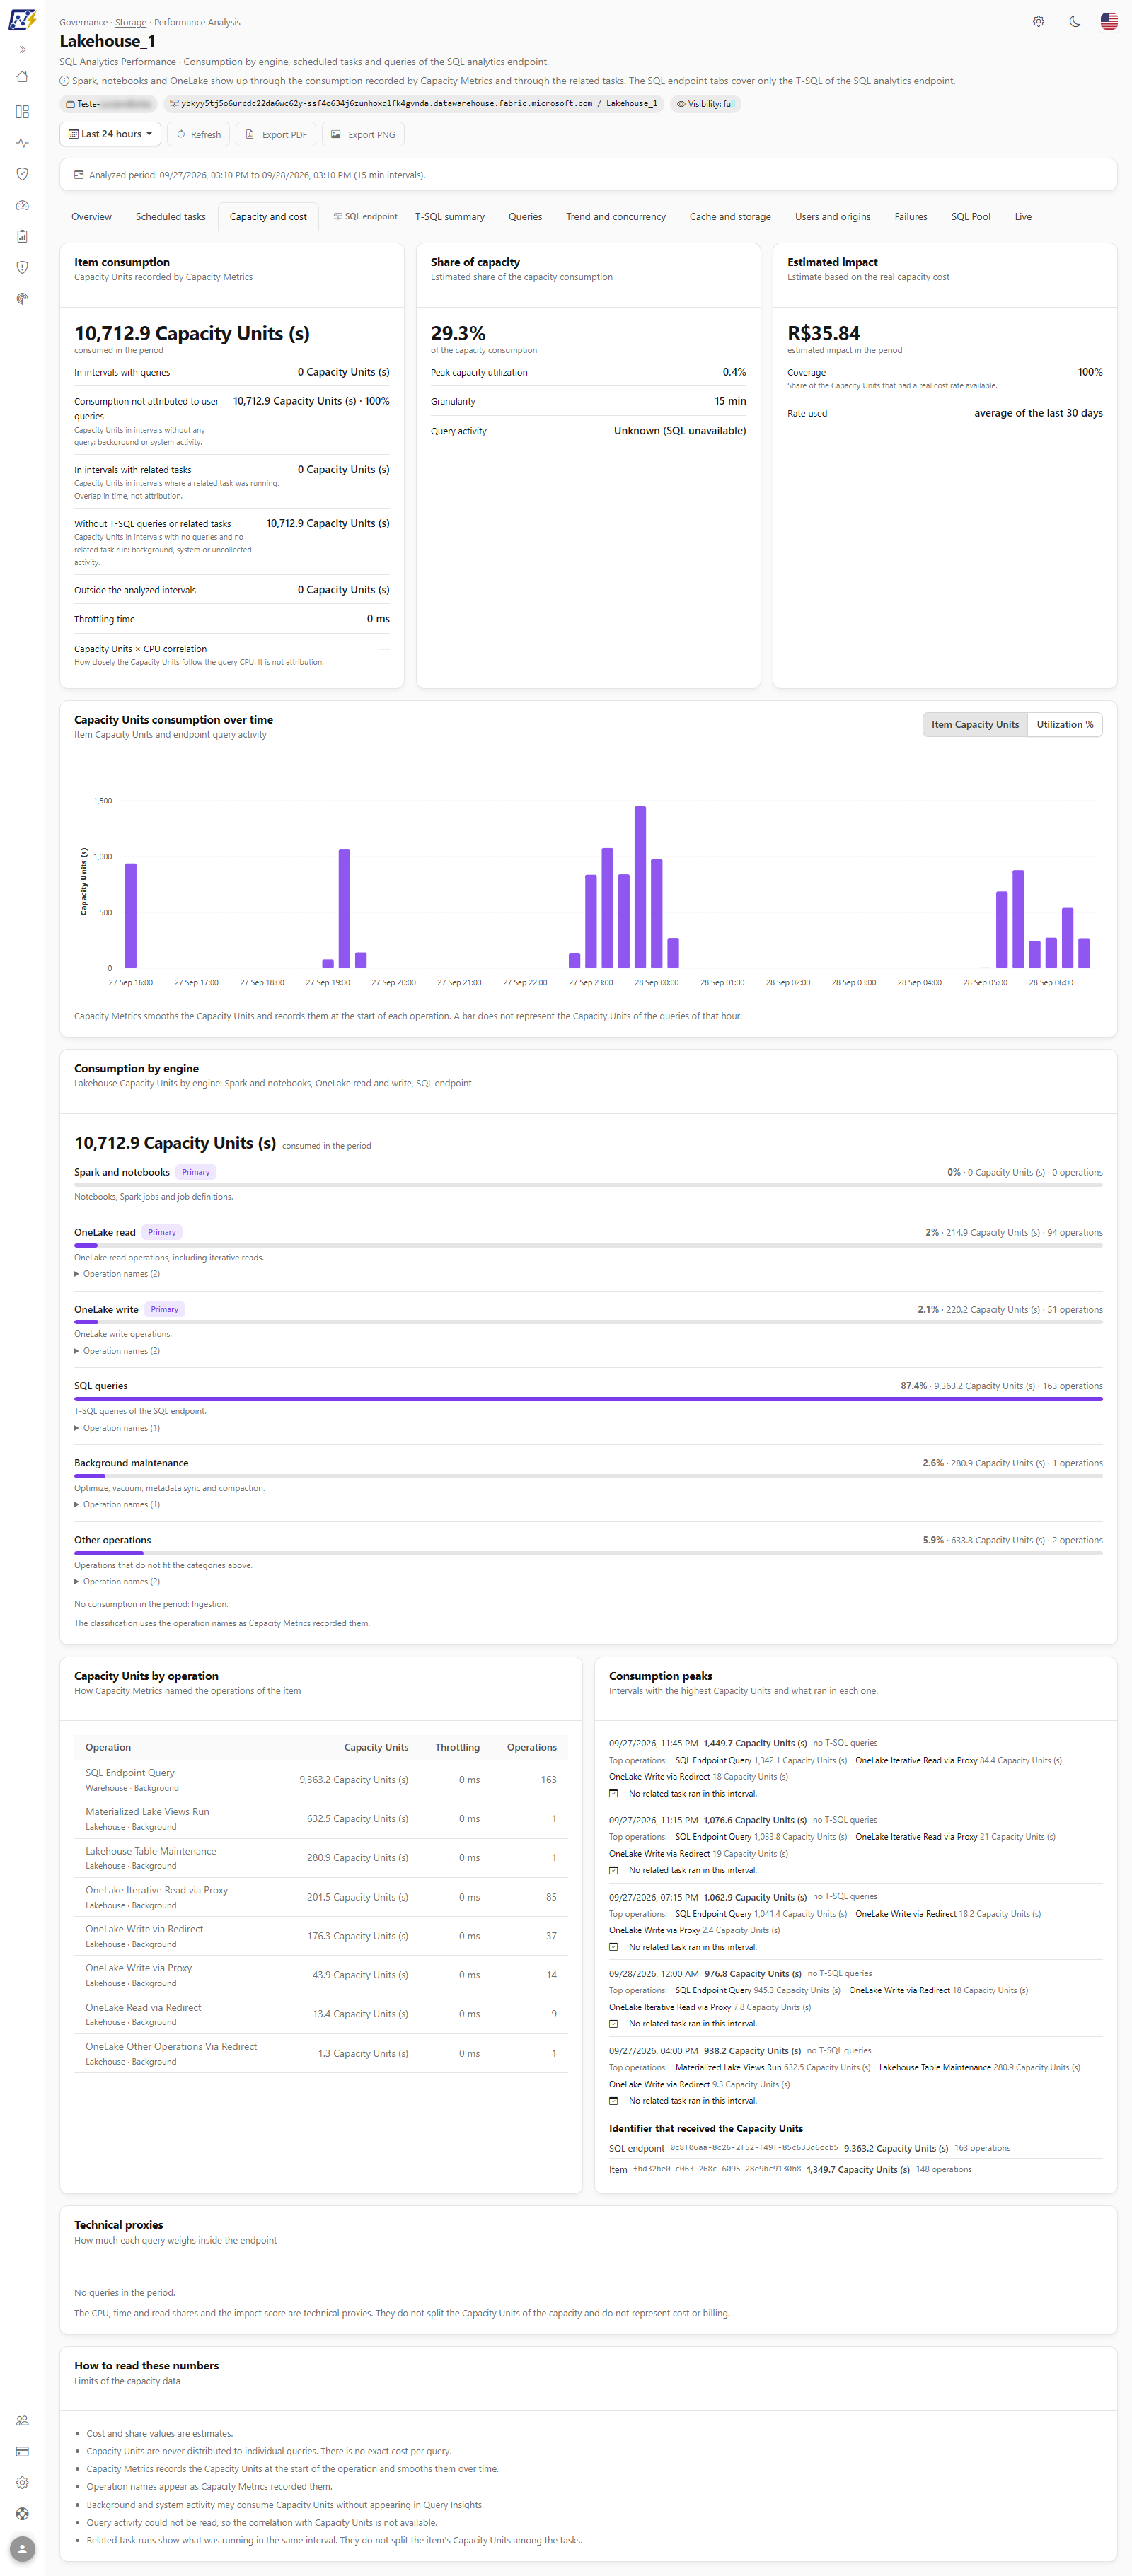
**What it is:** the tab with the item's **Capacity Units (CU)** consumption, based on Capacity Metrics. It works even when the SQL endpoint cannot be read.

**What it is for:** knowing how much the item weighs on the capacity, when the peaks occurred and how much this represents in estimated value.

<figure><picture><source srcset="/files/Ix1If0JfDb2yT5LlG7mn" media="(prefers-color-scheme: dark)"><img src="https://3938213054-files.gitbook.io/~/files/v0/b/gitbook-x-prod.appspot.com/o/spaces%2FH2bFRBmIfyK3kwVKbldl%2Fuploads%2Fgit-blob-f89f9492afe12fb18bced7f6732603eb24f9afc2%2Fpm-governanca-analise-performance-capacidade-en.png?alt=media" alt="Capacity and cost tab with the consumption, share and estimated impact cards, the consumption chart and the peaks"></picture><figcaption><p>Capacity and cost tab</p></figcaption></figure>

#### Consumption, share and estimated impact

<figure><picture><source srcset="/files/qWNnlyepU3aomvnicHpo" media="(prefers-color-scheme: dark)"><img src="https://3938213054-files.gitbook.io/~/files/v0/b/gitbook-x-prod.appspot.com/o/spaces%2FH2bFRBmIfyK3kwVKbldl%2Fuploads%2Fgit-blob-49e2fd914e9a06e9e21938679b0f2a68e4b82004%2Fpm-governanca-analise-performance-capacidade-resumo-en.png?alt=media" alt="Item consumption card with the total Capacity Units and the split into intervals with queries, with tasks and with neither"></picture><figcaption><p>Item consumption card</p></figcaption></figure>

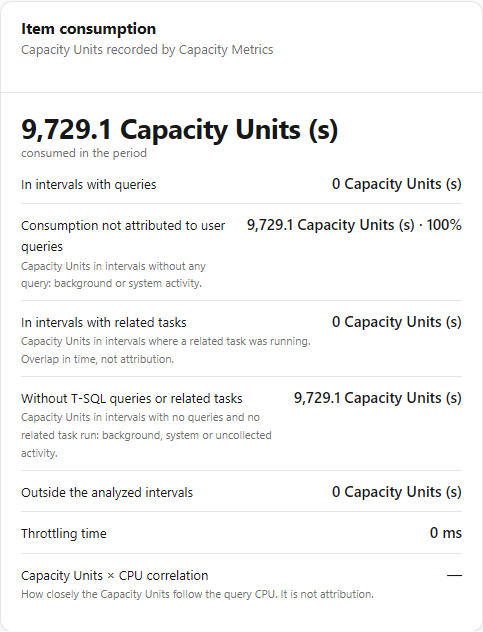
* **Item consumption:** total consumed in the period; how much occurred **in intervals with queries**, **in intervals with related tasks** (coincidence in time, not attribution) and **without T-SQL queries or related tasks** (background or system activity); throttling time; **Capacity Units × CPU correlation** of the queries.
* **Share of the capacity:** % of the capacity's consumption, peak capacity utilization and data granularity.
* **Estimated impact:** estimated value of the consumption, calculated with the capacity's **real cost rate** (average of the last 30 days), never with list price, and the **Coverage** (share of the Capacity Units that had a cost rate available). With no real cost configured, the screen shows only Capacity Units.

#### Capacity Units consumption over time

<figure><picture><source srcset="/files/AbeE8jNhyOalhHBFjTbJ" media="(prefers-color-scheme: dark)"><img src="https://3938213054-files.gitbook.io/~/files/v0/b/gitbook-x-prod.appspot.com/o/spaces%2FH2bFRBmIfyK3kwVKbldl%2Fuploads%2Fgit-blob-817c5605e7c98ced839109400d331f8b4019ae14%2Fpm-governanca-analise-performance-capacidade-grafico-en.png?alt=media" alt="Capacity Units consumption over time chart with the Item Capacity Units and Utilization % buttons"></picture><figcaption><p>Consumption over time chart</p></figcaption></figure>

1. In the **Capacity Units consumption over time** card, click **Item Capacity Units** (consumption columns, with the executions line when there is query data) or **Utilization %** (capacity utilization).
2. The **Utilization %** view is displayed only for periods of up to 7 days; for longer periods, the screen reports "Capacity utilization is shown only for periods of up to 7 days.".

#### Consumption by engine and by operation

* **Consumption by operation type/engine** (on a Lakehouse: Spark and notebooks, OneLake reads and writes, SQL queries).
* **Capacity Units by operation**: how Capacity Metrics named the item's operations, with Capacity Units, throttling and number of operations.
* **Identifier that received the Capacity Units**: separates the consumption recorded on the item and on the SQL endpoint.

#### Consumption peaks

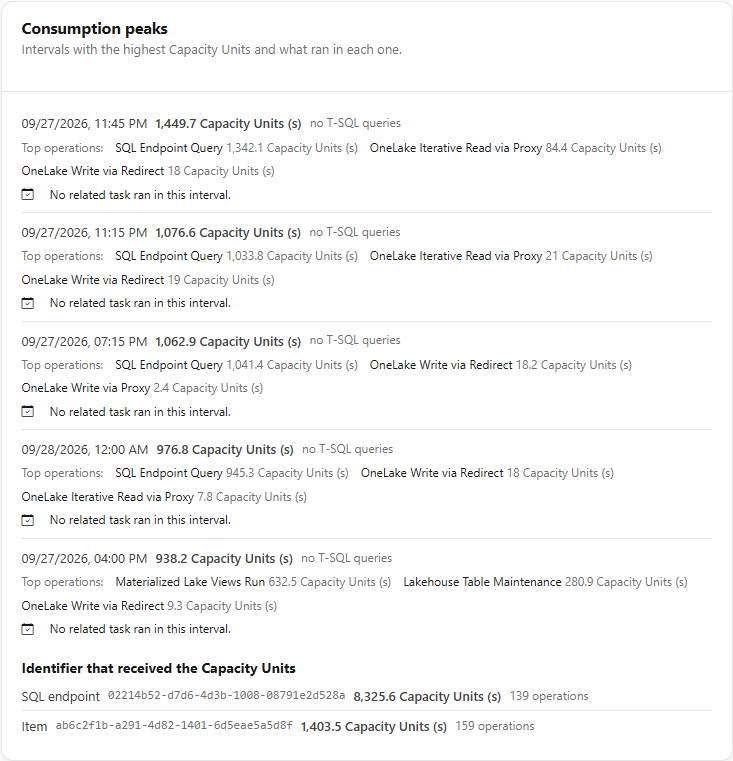
<figure><picture><source srcset="/files/v5RhB8bPGmuzp7qYaGKu" media="(prefers-color-scheme: dark)"><img src="https://3938213054-files.gitbook.io/~/files/v0/b/gitbook-x-prod.appspot.com/o/spaces%2FH2bFRBmIfyK3kwVKbldl%2Fuploads%2Fgit-blob-18e158672331668820d672725e4983461dbbea74%2Fpm-governanca-analise-performance-capacidade-picos-en.png?alt=media" alt="Consumption peaks card with the highest consumption intervals and what ran in each one"></picture><figcaption><p>Consumption peaks</p></figcaption></figure>

1. In **Consumption peaks**, see the 5 intervals with the most Capacity Units: time, Capacity Units, T-SQL queries, top operations and related task runs in the interval.
2. Click **Investigate** on the peak (available when there were T-SQL queries in the interval) to open [What ran in this window](#what-ran-in-this-window).

#### Technical proxies and How to read these numbers

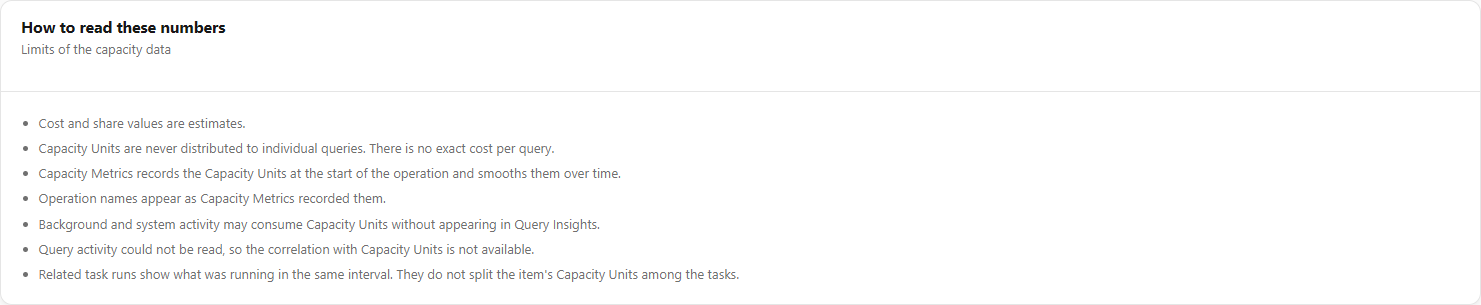
<figure><picture><source srcset="/files/kQHPoxdlnSU23dWhbwg5" media="(prefers-color-scheme: dark)"><img src="https://3938213054-files.gitbook.io/~/files/v0/b/gitbook-x-prod.appspot.com/o/spaces%2FH2bFRBmIfyK3kwVKbldl%2Fuploads%2Fgit-blob-618e537705fdcf56ce4f507785c32dc822783114%2Fpm-governanca-analise-performance-capacidade-como-ler-en.png?alt=media" alt="How to read these numbers card with the limits of the capacity data"></picture><figcaption><p>How to read these numbers card</p></figcaption></figure>

* **Technical proxies:** top 10 queries by share of CPU, time and reads within the endpoint.
* **How to read these numbers:** lists the limits of the displayed data (estimates, smoothing, background activity, truncation).

{% hint style="info" %}
**How to read these numbers:** Capacity Metrics smooths consumption and records it at the start of each operation. Capacity Units are **never** distributed among individual queries: there is no exact cost per query. Score and share are technical indicators for prioritization, not cost or billing.
{% endhint %}

### Lakehouse Overview

**What it is:** the first tab of a Lakehouse, centered on the item and not just on T-SQL.

**What it is for:** seeing at once the Lakehouse consumption, the tasks that feed it and a summary of the SQL analytics endpoint.

**How to use:**

1. Read the strip of cards **Lakehouse consumption**, **Related tasks** and **SQL analytics endpoint** (T-SQL queries, failures, P95, CPU, users).
2. Click **Open the SQL endpoint tabs →** to go to the T-SQL group, or **See capacity and cost →** for the capacity tab.
3. Below, see the consumption by engine, the top 5 consumers among the scheduled tasks and the consumption peaks.

**How it works:** the Overview opens without waiting for the T-SQL read, which continues in the background; the SQL analytics endpoint card is filled in when it finishes.

### Query details

**What it is:** the **Query details** modal, opened by clicking a hash on any tab, a row on the **Queries** tab, the **Investigate** button in the query list or a finding in **What stands out**.

**What it is for:** understanding a query pattern in depth and comparing fast and slow executions.

**How to use:**

{% stepper %}
{% step %}

#### Read the summary

At the top of the modal, see the score (click it to open **Why this score?**), the variability, the **Text of the last execution**, the metrics and the diagnoses.
{% endstep %}

{% step %}

#### Compare executions

In the **Executions** table, click a column header (**Submitted**, **Duration**, **CPU**, **OneLake**, **Rows**, **Concurrency at start**) to sort. Click an execution to see the **Text of the selected execution** just below.
{% endstep %}

{% step %}

#### Check the Fabric views

At the end of the modal, **Long-running queries** and **Frequently run queries** show how Fabric itself recorded the query over the last 30 days.
{% endstep %}
{% endstepper %}

**How it works:** the modal shows metrics (executions/failures/canceled, median, P95, P99, coefficient of variation, CPU, remote reads), full diagnoses with the facts that support them, a scatter chart of duration over time (*Succeeded* × *Failures and cancels*) and the executions table (up to 200, with status, result cache usage, acceleration, login, origin and pool). Close it with the **X**, the Esc key or by clicking outside it.

{% hint style="warning" %}
The modal displays the **SQL text** of the queries, which may contain sensitive or customer data. Be careful when copying, pasting or sharing this content.
{% endhint %}

### Why this score?

**What it is:** the modal that explains a query's [impact score](#impact-score).

**What it is for:** knowing whether the high score comes from CPU, time, reads, failures, regression or another factor: and, therefore, what kind of optimization to tackle.

**How to use:**

1. Click a query's score (**Queries** tab or **Query details**) or the **Explain score** button (**Queries most worth investigating** list).
2. See, as bars, the points for each component, the effective weight and the **Components without data (left out)**.
3. Click **Investigate** to open the **Query details**.

### What ran in this window

**What it is:** the investigation modal for a time window, opened by **Investigate window** (activity chart), **What ran?** (SQL Pool pressure event) or **Investigate** (consumption peak).

**What it is for:** showing what ran in a specific interval, for example the time when users complained about slowness.

**How to use:**

1. Open the modal through one of the paths above.
2. Read the window totals and the **Estimated share of the window consumption** table.
3. Click a query hash to open the **Query details**. Close the modal with the **X**, the Esc key or by clicking outside it.

**How it works:**

* The window is at most 24 hours, within the 30-day retention; larger selections are cut, with the notice "The window was limited to 24 hours, within the 30-day retention.".
* The modal shows executions, distinct queries and logins, **Estimated CPU in the window**, overlapping time, estimated remote reads, failures and average concurrency; the estimated share (impact in the window weighting CPU 50%, time 30% and executions 20%); the executions that used the most CPU; and the SQL Pool health in the window.
* The CPU in the window is estimated assuming that each execution's CPU is spread evenly over its duration.

### SQL endpoint block card

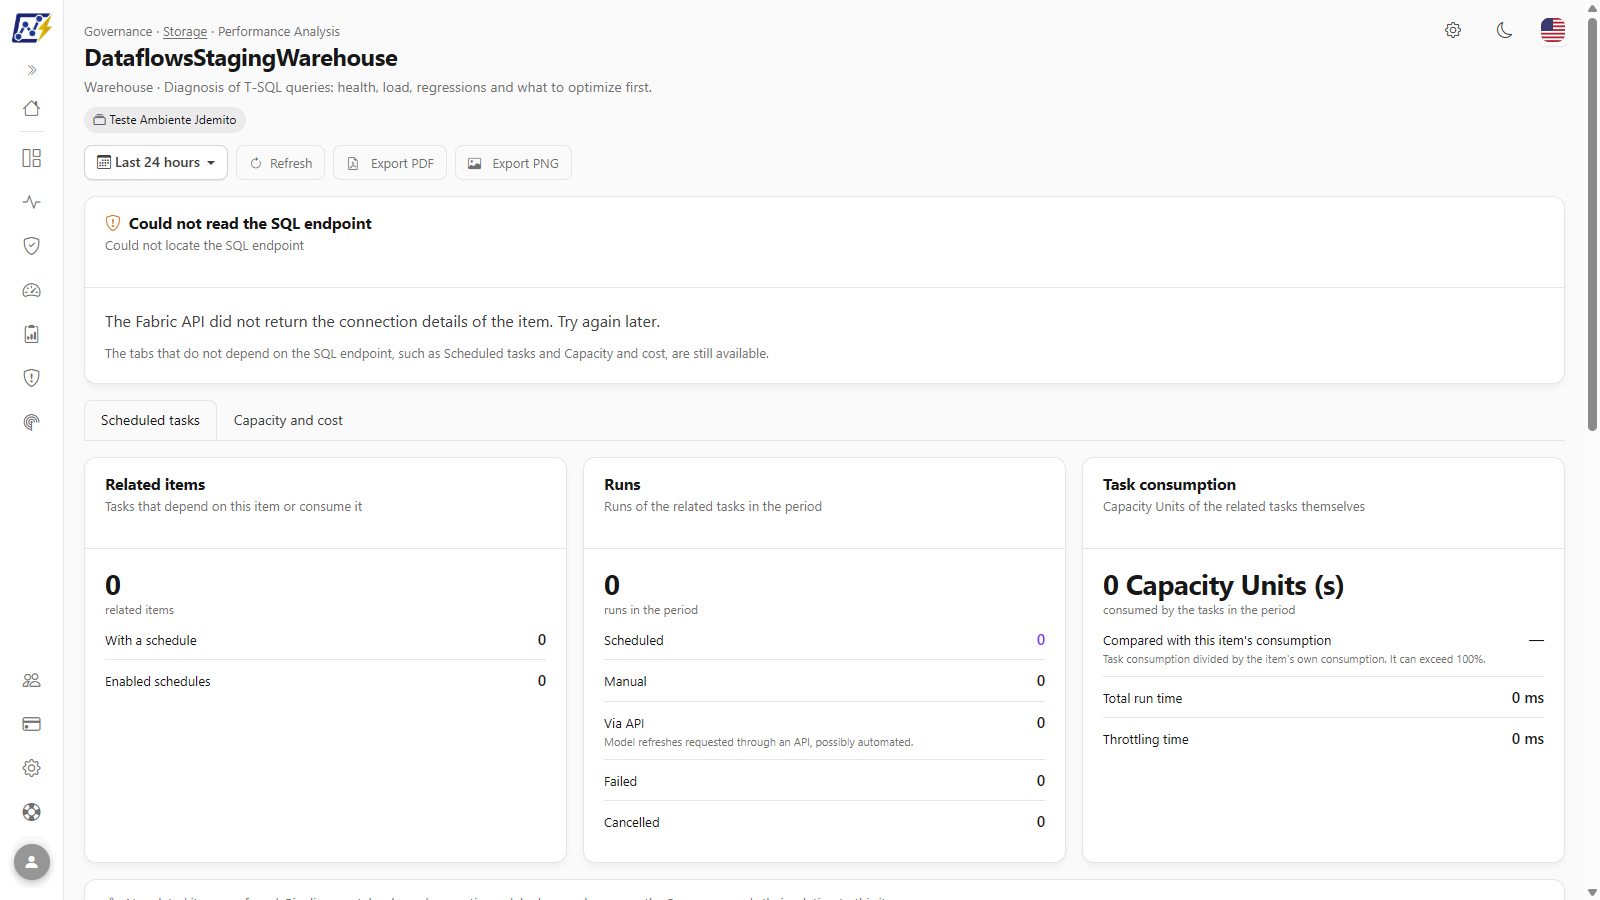
**What it is:** the **Could not read the SQL endpoint** card, displayed in place of the notices when Power Monitor cannot read the item. The subtitle gives the reason and the body, the fix hint.

**What it is for:** stating exactly why the T-SQL tabs do not appear and what to do to unlock them.

<figure><picture><source srcset="/files/0Jds6ltG3Eb2NQNgu4Ci" media="(prefers-color-scheme: dark)"><img src="https://3938213054-files.gitbook.io/~/files/v0/b/gitbook-x-prod.appspot.com/o/spaces%2FH2bFRBmIfyK3kwVKbldl%2Fuploads%2Fgit-blob-34c9ce18958cc7aa6290c2f0f102217733402dd7%2Fpm-governanca-analise-performance-bloqueio-en.png?alt=media" alt="Could not read the SQL endpoint card with the reason and the fix hint"></picture><figcaption><p>Block card with reason and hint</p></figcaption></figure>

**How to use:**

{% stepper %}
{% step %}

#### Read the reason

The card reports the reason (for example, **The Service Principal has no access to the workspace**) and the fix hint. See the table below.
{% endstep %}

{% step %}

#### Fix the access

For lack of access, an administrator adds the Service Principal as workspace administrator (**Add Service Principal**, in [Workspaces](/en/power-monitor/governanca/workspaces.md) or in Settings › Additional Permissions). For the other reasons, follow the card's hint.
{% endstep %}

{% step %}

#### Try again

Click **Refresh**. If the access was fixed, the T-SQL tabs appear again.
{% endstep %}
{% endstepper %}

**How it works:** while the block lasts, the tabs that do not depend on the SQL endpoint remain available: **Scheduled tasks** and **Capacity and cost** (and, on a Lakehouse, also the **Overview**).

| Reason                                                        | What to do                                                                                                 |
| ------------------------------------------------------------- | ---------------------------------------------------------------------------------------------------------- |
| **The Service Principal has no access to the workspace**      | Make the Service Principal a workspace administrator (**Add Service Principal**).                          |
| **Could not get the Service Principal token**                 | Check that the App Registration secret has not expired.                                                    |
| **Organization setup is incomplete**                          | Complete the App Registration setup in Settings.                                                           |
| **SQL endpoint login rejected**                               | Confirm the Service Principal's access and whether the use of Service Principals is enabled in the tenant. |
| **Permission denied on the SQL endpoint**                     | Grant read permission on the item or the Contributor role on the workspace.                                |
| **SQL endpoint unavailable**                                  | The capacity may be paused or overloaded.                                                                  |
| **SQL analytics endpoint is being provisioned**               | Wait a few minutes and try again.                                                                          |
| **Could not locate the SQL endpoint**                         | The Fabric API did not return the item's connection data; try again later.                                 |
| **Item has no SQL endpoint**                                  | The item does not expose a SQL analytics endpoint.                                                         |
| **Invalid SQL endpoint address**                              | The address returned by Fabric is not a recognized Fabric SQL host.                                        |
| **SQL endpoint query timed out**                              | Try a shorter period.                                                                                      |
| **Fabric request limit reached**                              | Wait a few minutes and refresh.                                                                            |
| **Item not found in Fabric**                                  | The item may have been deleted or moved; run a new inventory scan.                                         |
| **Query Insights unavailable**                                | The item does not expose the Query Insights views.                                                         |
| **Failed to read the SQL endpoint** / **Unidentified reason** | Unexpected error; try again later.                                                                         |

### Invalid link and Item not found

**What it is:** state cards displayed when the page is opened without identifying a valid item.

**What it is for:** explaining why nothing was loaded when opening an old or incomplete link.

<figure><picture><source srcset="/files/eFS5j1rvlZoJ2byHnZP3" media="(prefers-color-scheme: dark)"><img src="https://3938213054-files.gitbook.io/~/files/v0/b/gitbook-x-prod.appspot.com/o/spaces%2FH2bFRBmIfyK3kwVKbldl%2Fuploads%2Fgit-blob-5c6eb2df2892889e7302b4bd73f25873ecb65b2f%2Fpm-governanca-analise-performance-link-invalido-en.png?alt=media" alt="Invalid link card instructing you to open Performance Analysis from the Storage actions menu"></picture><figcaption><p>Invalid link state</p></figcaption></figure>

**How it works:**

* **Invalid link:** the page was opened without coming from the Storage menu (the item data is missing from the address). Open it from the **⋮** menu of a Warehouse or Lakehouse in *Governance › Storage* or search for the item in *Performance › Lakehouse and Warehouse*.
* **Item not found:** the Warehouse or Lakehouse does not exist in the organization or is outside your workspace scope.

## Impact score

The **impact score** (0 to 100) is calculated for each query pattern and indicates how much it weighs on the item in the period, combining 12 components:

| Component               | Weight | How it is normalized                                             |
| ----------------------- | ------ | ---------------------------------------------------------------- |
| Accumulated CPU         | 15     | Share of the total (20% of the total already scores the maximum) |
| Accumulated time        | 12     | Share of the total                                               |
| CPU per execution       | 8      | Position (percentile) among the analyzed queries                 |
| P95 duration            | 8      | Percentile                                                       |
| Remote read             | 8      | % remote                                                         |
| Accumulated read        | 8      | Share of the total                                               |
| Failure rate            | 8      | Rate                                                             |
| Regression              | 8      | How much the recent duration exceeded the previous one           |
| Frequency               | 7      | Share of executions                                              |
| Variability             | 6      | Coefficient of variation                                         |
| Pool pressure           | 6      | % of executions under pressure                                   |
| Concurrency sensitivity | 6      | Correlation with concurrency                                     |

| Range        | Score      |
| ------------ | ---------- |
| **Critical** | 75 or more |
| **High**     | 50 to 74   |
| **Moderate** | 25 to 49   |
| **Low**      | below 25   |

Components without data **do not count as zero**: they are left out of the calculation and the weight of the others is redistributed. The **Model coverage** (e.g. "Model coverage: 88%") indicates how much of the total weight could be calculated. The [Why this score?](#why-this-score) modal shows the composition of each score.

## Diagnoses

Each query pattern receives diagnoses with an evidence level: **Strong evidence**, **Possible cause** or **Could not be determined** (when data is missing to evaluate it).

| Diagnosis                    | Strong evidence                                                                  | Possible cause                                 |
| ---------------------------- | -------------------------------------------------------------------------------- | ---------------------------------------------- |
| **Read bound**               | Average read ≥ 1 GB per execution and ≥ 10% of total reads                       | ≥ 256 MB per execution or ≥ 10% of total reads |
| **CPU bound**                | CPU intensity ≥ 4×                                                               | ≥ 2×                                           |
| **Remote read (cold cache)** | ≥ 80% remote and ≥ 100 MB remote per execution                                   | ≥ 60% remote                                   |
| **Resource pressure**        | ≥ 50% of executions with the pool under pressure                                 | ≥ 20%                                          |
| **Concurrency sensitive**    | Correlation ≥ 0.5 (minimum of 20 executions)                                     | ≥ 0.3                                          |
| **High frequency**           | "Thousand cuts" pattern                                                          | 100 or more executions with median ≤ 1 s       |
| **Performance regression**   | Recent duration ≥ 2× the previous one (minimum of 5 executions in each stretch)  | ≥ 1.5×                                         |
| **Unstable performance**     | Coefficient of variation ≥ 1 **and** P95 ÷ median ≥ 3 (minimum of 10 executions) | One of the two signals                         |
| **Failure pattern**          | Failure rate ≥ 20% with 5 or more failures                                       | ≥ 5% with 2 or more failures                   |

**"Thousand cuts"** (death by a thousand cuts) is the pattern of a fast query (median ≤ 1 s), executed very frequently (at least 100 times and among the 10% most executed) that adds up to at least 5% of the total CPU or time.

## Rules and behavior

* **On-demand reading:** T-SQL data is read **directly from the item's SQL endpoint** each time you open the page, change the period or click **Refresh**: nothing is collected periodically or stored by Power Monitor. Capacity and task data come from data Power Monitor already collects.
* **Delay and retention:** Query Insights records queries with a delay of about 15 minutes and keeps them for 30 days.
* **Timeout:** very heavy reads may exceed the time limit; the affected section shows "Timed out": try a shorter period.
* **Isolated failures:** each section has its own state (*Available*, *No data in the period*, *Unavailable on this endpoint*, *Not run*, *Read failed*, *Timed out*). A section that fails does not bring down the others, and unknown values appear as "-", never as 0.

## Step by step: finding out why a Warehouse got slow today

{% stepper %}
{% step %}

#### Open the analysis

In *Governance › Storage*, open the Warehouse's **⋮** menu and click **Performance Analysis**. Keep the **Last 24 hours** period.
{% endstep %}

{% step %}

#### Read the findings

In **What stands out**, see whether there is regression, pool pressure, high remote reads or CPU concentration.
{% endstep %}

{% step %}

#### Investigate the moment of the slowdown

In the **Activity over time** chart, select the interval in which users complained and click **Investigate window** to see the queries that consumed the most in that stretch.
{% endstep %}

{% step %}

#### Dig into the query

Click the query hash to open the **Query details**, review the diagnoses and compare fast and slow executions (remote reads, cache, concurrency at start).
{% endstep %}

{% step %}

#### Record it

Use **Export PDF** to attach the analysis to the ticket. The SQL text is not included in the file.
{% endstep %}
{% endstepper %}

## Frequently asked questions

<details>

<summary>The queries from the last few minutes do not appear.</summary>

Query Insights takes about 15 minutes to record queries. Use the **Live** tab to see what is running now.

</details>

<details>

<summary>Why can't I analyze more than 30 days?</summary>

Fabric's Query Insights keeps the history for 30 days; the period is limited to that retention.

</details>

<details>

<summary>Only the Scheduled tasks and Capacity and cost tabs appear.</summary>

The SQL endpoint could not be read. The **Could not read the SQL endpoint** card at the top reports the reason and the fix; after fixing it, click **Refresh**.

</details>

<details>

<summary>The Live tab shows few sessions.</summary>

Without permission to view the database state, the Service Principal sees only its own sessions: the page displays the limited visibility notice. Grant the appropriate permission to the Service Principal on the item.

</details>

<details>

<summary>Is the "Estimated impact" the actual cost of each query?</summary>

No. It is an estimate of the value of **the item's** consumption in the period, using the capacity's real cost rate. Power Monitor does not distribute Capacity Units among individual queries, because Fabric does not provide that data.

</details>

<details>

<summary>The page takes a long time to load.</summary>

For long periods (7 to 30 days) and on items with many queries, reading Query Insights can take a few minutes. The progress screen shows which step the analysis is at. Shorter periods load faster.

</details>

## Related pages

* [Storage](/en/power-monitor/governanca/armazenamento.md)
* [Workspaces](/en/power-monitor/governanca/workspaces.md)
* [Microsoft Fabric Items](/en/power-monitor/monitoramento/itens-do-microsoft-fabric.md)
* [Performance Assessment](/en/power-monitor/performance/avaliacao-de-performance.md) (semantic models)


---

# Agent Instructions
This documentation is published with GitBook. GitBook is the documentation platform designed so that both humans and AI agents can read, navigate, and reason over technical content effectively. Learn more at gitbook.com.

## Querying This Documentation
If you need additional information that is not directly available in this page, you can query the documentation by asking a question.

Perform an HTTP GET request on the following URL with the `ask` and `goal` query parameters:

```
GET https://docs.powermonitor.com.br/en/power-monitor/governanca/armazenamento/analise-de-performance-sql.md?ask=<question>&goal=<user_goal>
```

`ask` is the immediate question: it should be specific, self-contained, and written in natural language.
`goal` is what the user is ultimately trying to achieve, the reason they need the answer. Sharing it helps GitBook give you a better, more relevant answer. A goal is most helpful when it describes the outcome the user wants rather than restating the question. For example, with `ask=how do I create an API token`, a goal like `automate deployments from our CI pipeline` lets GitBook tailor the answer to that use case.

The response will contain a direct answer to the question and relevant excerpts and sources from the documentation.

Use this mechanism when the answer is not explicitly present in the current page, you need clarification or additional context, or you want to retrieve related documentation sections.