> For the complete documentation index, see [llms.txt](https://docs.powermonitor.com.br/llms.txt). Markdown versions of documentation pages are available by appending `.md` to page URLs; this page is available as [Markdown](https://docs.powermonitor.com.br/en/power-monitor/governanca/dados-e-engenharia/engenharia-de-dados.md).

# Data Engineering

Inventory of Microsoft Fabric data integration and transformation artifacts, pipelines, dataflows, copy jobs, notebooks, environments, dbt, Spark and Airflow.

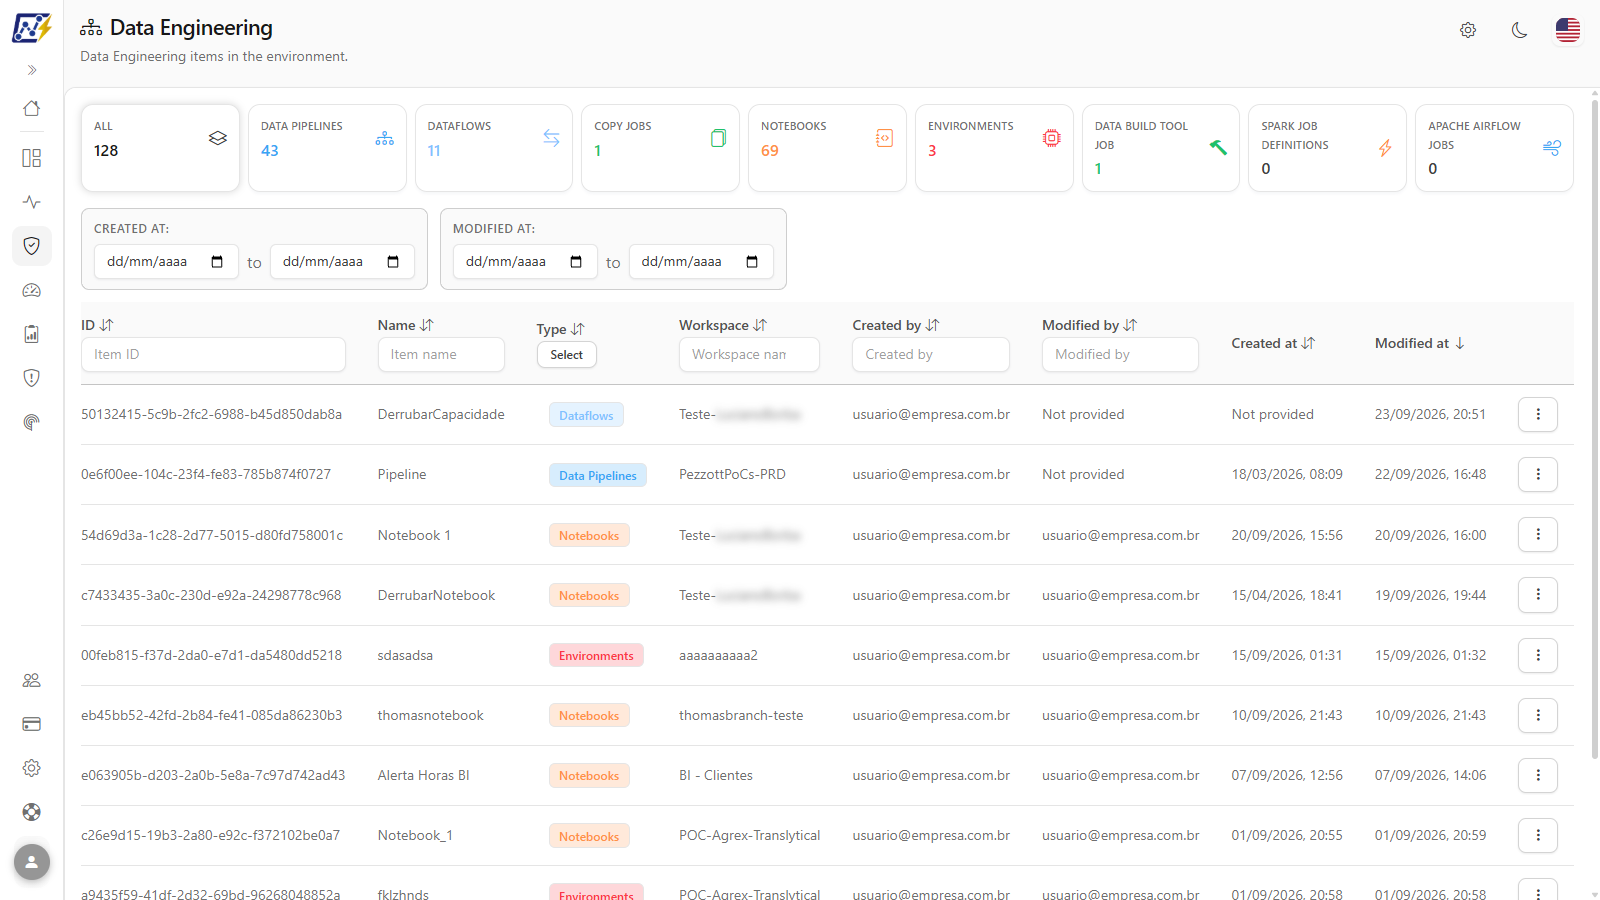
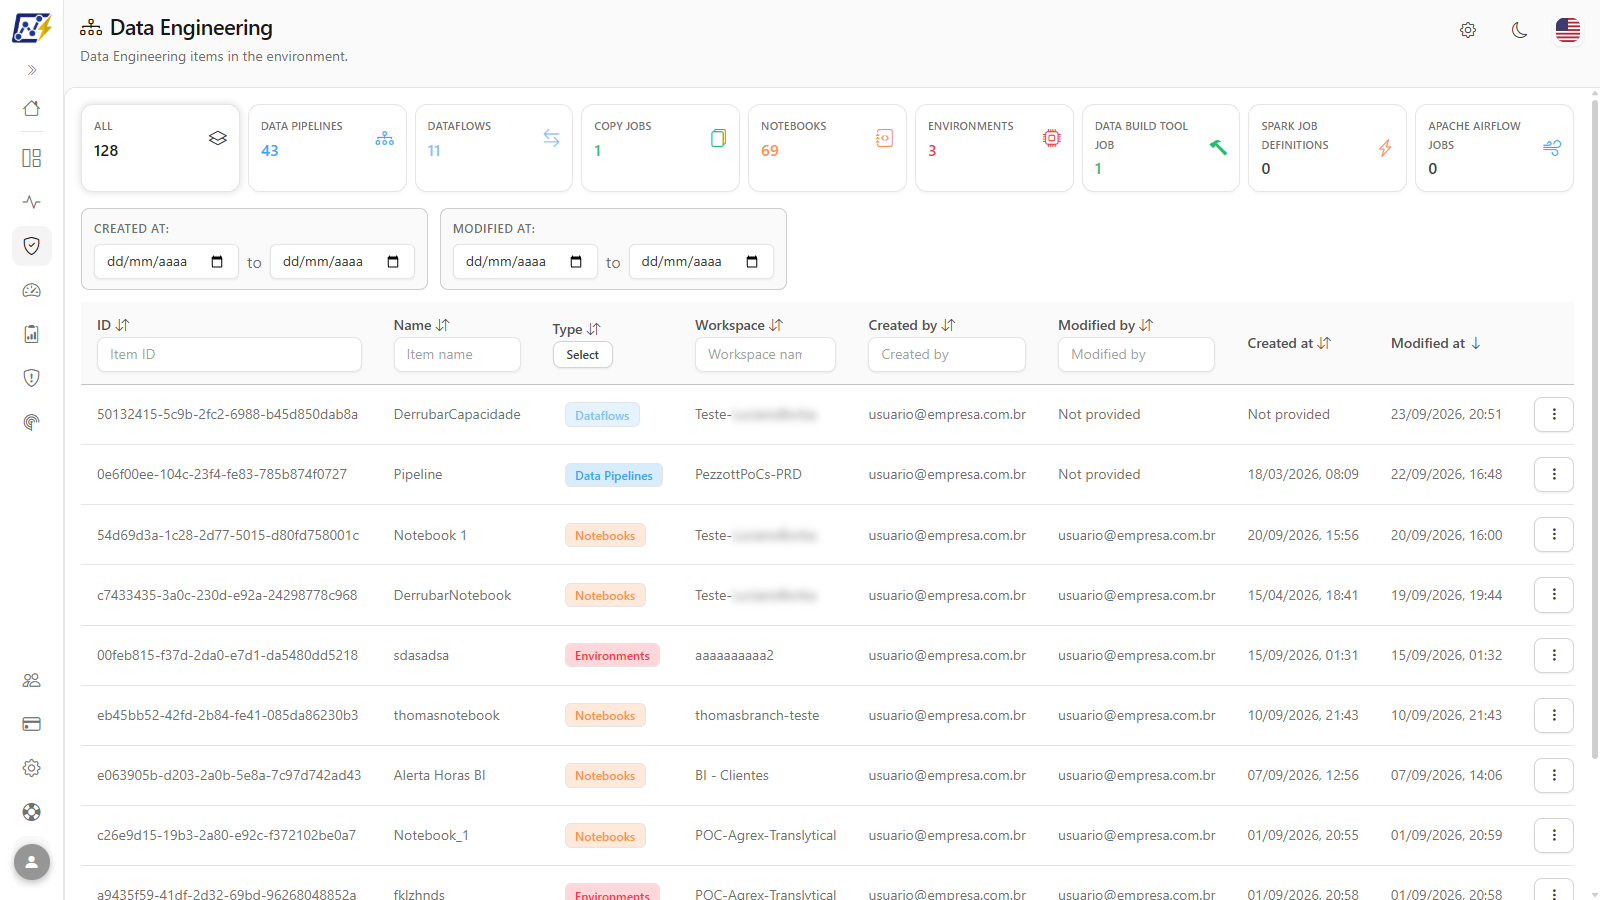
The **Data Engineering** screen brings together, in one place, the inventory of your Microsoft Fabric tenant's data integration, orchestration and transformation artifacts: who created them, who last modified them, which workspace they are in and when they were modified.

**How to access:** menu *Governance › Data and Engineering › Data Engineering*. The screen is available to all user profiles (respecting the workspace scope and page blocking configured for your user). Write actions (editing an item's governance, turning on execution duration deviation monitoring and adding, editing or deleting schedules) are exclusive to **Administrators**.

<figure><picture><source srcset="/files/s0tUv3pl9mhD4QN0yrsj" media="(prefers-color-scheme: dark)"><img src="https://3938213054-files.gitbook.io/~/files/v0/b/gitbook-x-prod.appspot.com/o/spaces%2FH2bFRBmIfyK3kwVKbldl%2Fuploads%2Fgit-blob-110d1db23b9c2620f60b538097924277ccbbe73f%2Fpm-governanca-engenharia-de-dados-en.png?alt=media" alt="Data Engineering screen with the cards by artifact type and the inventory table"></picture><figcaption><p>Governance › Data and Engineering › Data Engineering</p></figcaption></figure>

## What it is for

* **Catalog the company's ETL/ELT assets**: how many pipelines, dataflows, notebooks and jobs exist and where they are published.
* **Identify owners**: find out who created or last modified a pipeline before a change, a migration or an incident.
* **Find abandoned artifacts**: filter by modification date to locate items without maintenance for months.
* **Audit the distribution by workspace**: check whether production notebooks and pipelines are in the correct workspaces.
* **Quickly reach an item's schedules, permissions and dependencies**, without leaving Power Monitor.
* **Classify the criticality and owners** of pipelines, copy jobs, notebooks and Gen2 dataflows: information used by the criticality notification filters in *Settings › Notifications*.

{% hint style="info" %}
This screen covers the **registration** of artifacts. To track job runs, failures, cancellations and duration, use [Monitoring › Fabric Items](/en/power-monitor/monitoramento/itens-do-microsoft-fabric.md).
{% endhint %}

## Screen overview

From top to bottom, the screen has:

1. **Cards by artifact type**, which work as a view selector (All or a specific type).
2. **Period filters** (**Created at** and **Modified at**), above the table.
3. **Inventory table** of the chosen view, with text filters under the column titles, sorting, pagination and the **⋮** actions menu on each row.
4. **Details modal** of the artifact, opened from the row or the menu, with the **Overview**, **Users & Permissions**, **Schedules** and **Dependencies** tabs (depending on the type).

While the list loads, a loading indicator appears in place of the table. When the view has no items, the table shows an empty list message.

## Features

### Cards by artifact type

**What it is:** one card per artifact type, with the number of items. The selected card is highlighted and defines which table is displayed.

**What it is for:** seeing at a glance the size of the data engineering assets and isolating a type: for example, reviewing only the notebooks.

<figure><picture><source srcset="/files/oZEb18Rq4pd9aHod3nFY" media="(prefers-color-scheme: dark)"><img src="https://3938213054-files.gitbook.io/~/files/v0/b/gitbook-x-prod.appspot.com/o/spaces%2FH2bFRBmIfyK3kwVKbldl%2Fuploads%2Fgit-blob-ffbc70bccfe18a0037b30b78e6721fbe4fa35cd5%2Fpm-governanca-engenharia-de-dados-cards-en.png?alt=media" alt="All, Data Pipelines, Dataflows, Copy Jobs, Notebooks, Environments, Data Build Tool Job, Spark Job Definitions and Apache Airflow Jobs cards"></picture><figcaption><p>Cards by artifact type</p></figcaption></figure>

**How to use:**

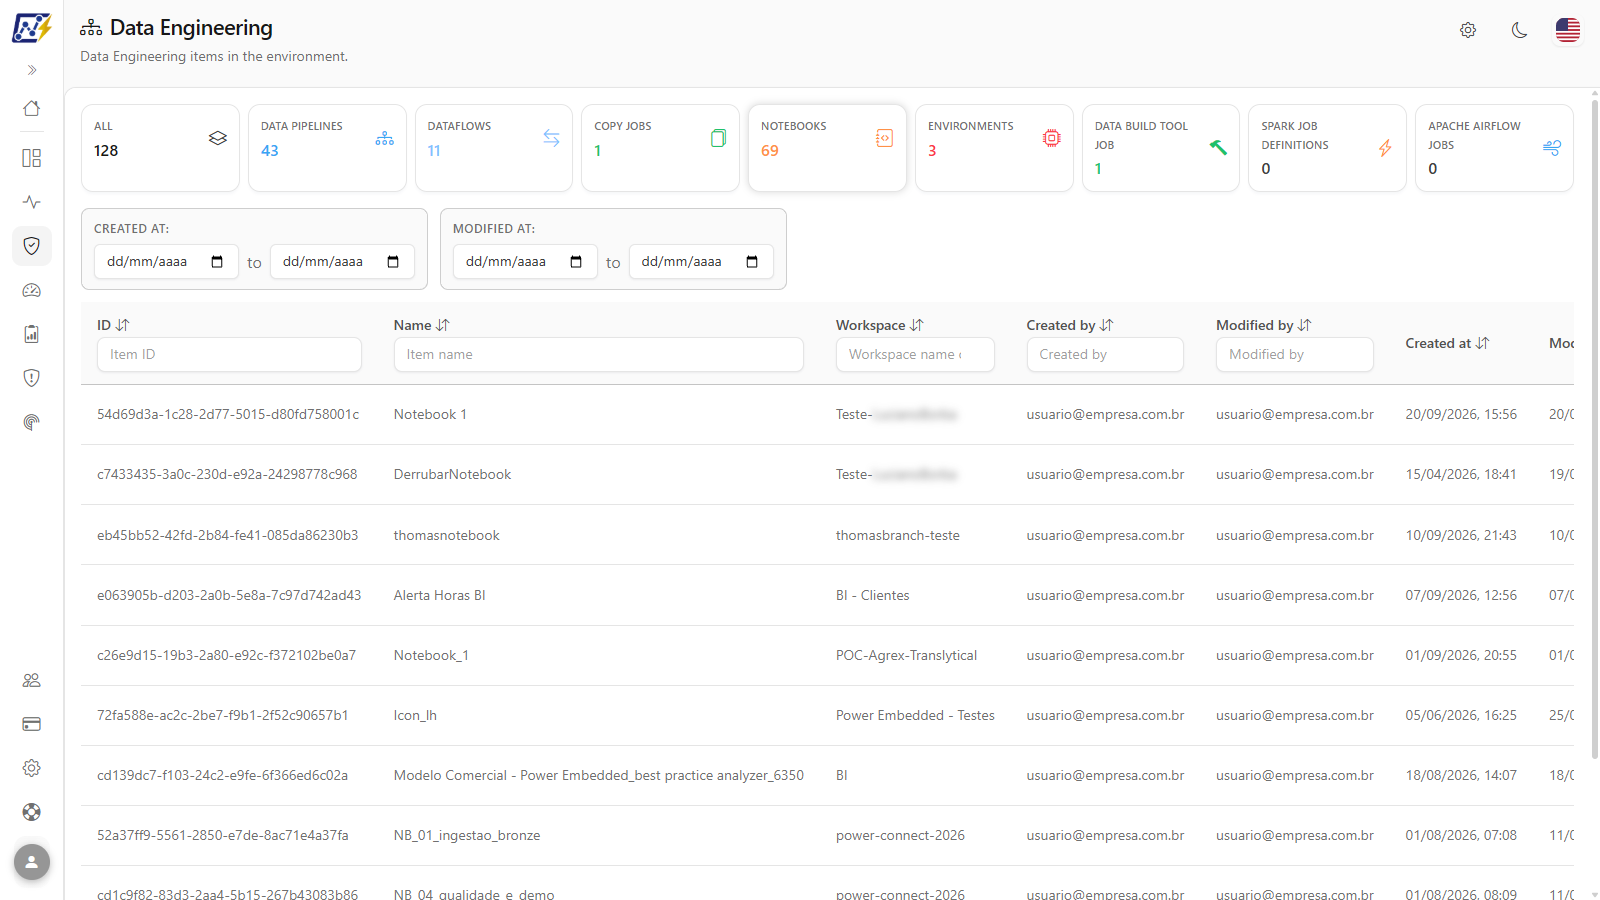
1. In *Governance › Data and Engineering › Data Engineering*, click the card of the desired type (for example, **Notebooks**).
2. The card is highlighted and the table shows only the items of that type, with the columns specific to it.
3. To return to the complete list, click the **All** card.

<figure><picture><source srcset="/files/vLwp25ZfjaIPFmkVLIOS" media="(prefers-color-scheme: dark)"><img src="https://3938213054-files.gitbook.io/~/files/v0/b/gitbook-x-prod.appspot.com/o/spaces%2FH2bFRBmIfyK3kwVKbldl%2Fuploads%2Fgit-blob-365c5d9c0a69e4d0c8f4df03ef2151fab6e35add%2Fpm-governanca-engenharia-de-dados-filtro-tipo-en.png?alt=media" alt="Notebooks card selected and the table showing only notebooks"></picture><figcaption><p>Notebooks card selected</p></figcaption></figure>

**How it works:**

| Card                      | What it counts                                                                                   |
| ------------------------- | ------------------------------------------------------------------------------------------------ |
| **All**                   | Data Pipelines, Dataflows, Copy Jobs, Notebooks, Environments and Data Build Tool Jobs, combined |
| **Data Pipelines**        | Data Factory orchestration pipelines in Fabric                                                   |
| **Dataflows**             | Dataflows (Gen1 and Gen2)                                                                        |
| **Copy Jobs**             | Data copy jobs                                                                                   |
| **Notebooks**             | Spark notebooks                                                                                  |
| **Environments**          | Spark environments (shared libraries and settings)                                               |
| **Data Build Tool Job**   | dbt (Data Build Tool) jobs                                                                       |
| **Spark Job Definitions** | Spark job definitions                                                                            |
| **Apache Airflow Jobs**   | Apache Airflow jobs                                                                              |

{% hint style="warning" %}
**Spark Job Definitions** and **Apache Airflow Jobs** have their own card and table, but are **not** included in the **All** view. To view them, click the corresponding card.
{% endhint %}

{% hint style="info" %}
**Switching cards clears the filters**: when you click another card, the column and period filters you filled in are cleared. Choose the card first and then apply the filters.
{% endhint %}

### Type filter in the All view

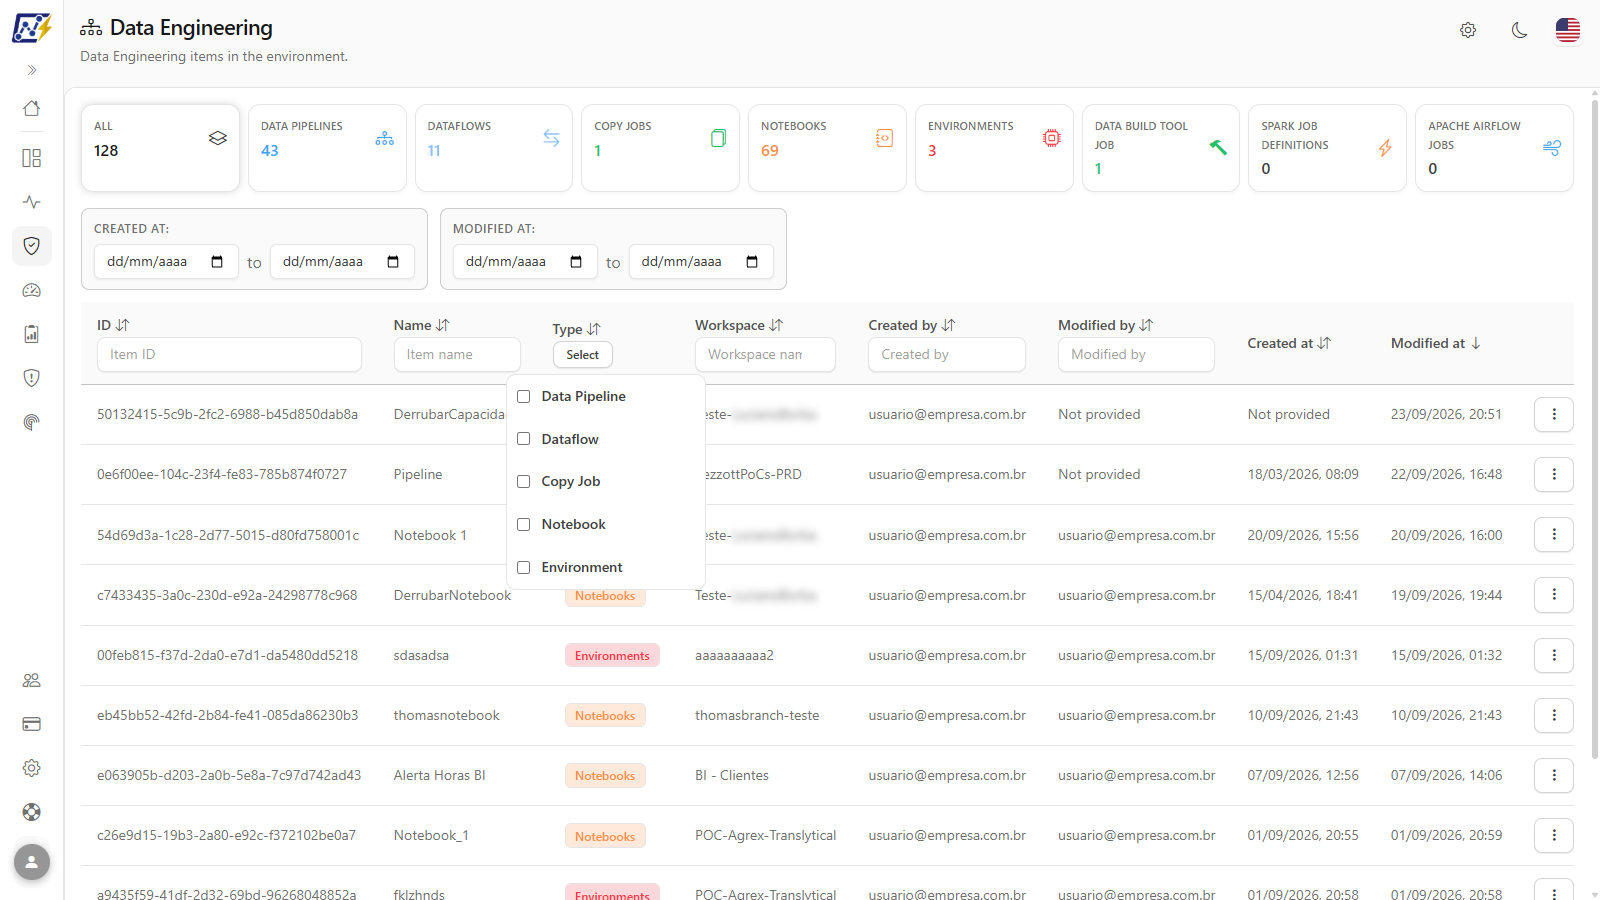
**What it is:** in the **All** view, below the **Type** column title, the **Select** button opens a multi-select list with **Data Pipeline**, **Dataflow**, **Copy Job**, **Notebook** and **Environment**.

**What it is for:** combining several types in the same list (for example, Data Pipelines and Notebooks together) without losing the consolidated view.

<figure><picture><source srcset="/files/ivSFFnYKYsQxlegaPE52" media="(prefers-color-scheme: dark)"><img src="https://3938213054-files.gitbook.io/~/files/v0/b/gitbook-x-prod.appspot.com/o/spaces%2FH2bFRBmIfyK3kwVKbldl%2Fuploads%2Fgit-blob-975301546f4317ca116e366b11e06f1652a8f816%2Fpm-governanca-engenharia-de-dados-filtro-tipo-todos-en.png?alt=media" alt="Type selection list open in the Type column of the All view"></picture><figcaption><p>Multi-select of types in the All view</p></figcaption></figure>

**How to use:**

{% stepper %}
{% step %}

#### Open the All view

Click the **All** card.
{% endstep %}

{% step %}

#### Open the type list

Click the **Select** button, below the **Type** column title.
{% endstep %}

{% step %}

#### Select the types

Select the boxes of the desired types (**Data Pipeline**, **Dataflow**, **Copy Job**, **Notebook**, **Environment**). The table is updated automatically; clear a box to remove the type from the filter.
{% endstep %}
{% endstepper %}

### Text filters by column

**What it is:** text boxes just below the titles of the **ID** (*Item ID*), **Name** (*Item name*), **Workspace** (*Workspace name or ID*), **Created by** (or **Configured by**, in Dataflows) and **Modified by** columns.

**What it is for:** locating an item by name or GUID, listing everything in a workspace or everything a person created or modified.

<figure><picture><source srcset="/files/xno1vYA31V97DB3bKiJR" media="(prefers-color-scheme: dark)"><img src="https://3938213054-files.gitbook.io/~/files/v0/b/gitbook-x-prod.appspot.com/o/spaces%2FH2bFRBmIfyK3kwVKbldl%2Fuploads%2Fgit-blob-1e085d5ff4e67f73e9b0a26872ee5029cc6372dc%2Fpm-governanca-engenharia-de-dados-filtros-coluna-en.png?alt=media" alt="Table header with the Item ID, Item name, Workspace name or ID, Created by and Modified by filter boxes"></picture><figcaption><p>Text filters under the column titles</p></figcaption></figure>

**How to use:**

1. Type the term in the filter box of the desired column (for example, part of the name in **Item name**).
2. The table is updated automatically as you type.
3. To remove the filter, delete the text in the box.

**How it works:**

* The search matches **part** of the text and is **not case-sensitive**.
* In the **Workspace** column, you can type the workspace name or ID.
* Filters on different columns are combined.

{% hint style="info" %}
In the **Data Build Tool Job**, **Spark Job Definitions** and **Apache Airflow Jobs** views, the list is refined only by the period filters (**Created at** and **Modified at**). In these three views, the column text filters and sorting by column title do not change the list.
{% endhint %}

### Period filters (Created at and Modified at)

**What it is:** date range selectors displayed above the table (**Created at** and **Modified at**), each with a start date and an end date (*… to …*).

**What it is for:** finding items created in a period (for example, in the last project) or items without maintenance for months.

<figure><picture><source srcset="/files/ArGuOXlCxcxLpZ9fXhnP" media="(prefers-color-scheme: dark)"><img src="https://3938213054-files.gitbook.io/~/files/v0/b/gitbook-x-prod.appspot.com/o/spaces%2FH2bFRBmIfyK3kwVKbldl%2Fuploads%2Fgit-blob-a6dd96d754af5e9afe7890a7ecfbbad1457db9b4%2Fpm-governanca-engenharia-de-dados-filtros-periodo-en.png?alt=media" alt="Created at and Modified at period selectors above the table"></picture><figcaption><p>Period filters</p></figcaption></figure>

**How to use:**

1. Above the table, fill in the start date and/or the end date of **Created at** or **Modified at**.
2. The table shows only the items within the range and is re-sorted by that date.
3. To remove the filter, clear the dates.

**How it works:**

* When you fill in a period, the table is sorted by the corresponding date (from oldest to newest when there is a start date).
* In the **Dataflows** view, only the **Modified at** filter exists, because Fabric does not report the creation date of dataflows.

### Sorting

**What it is:** sorting the table by clicking a column title; an arrow icon next to the title indicates the sorted column and direction.

**What it is for:** bringing the most recently modified items to the top, or grouping by workspace or by author.

**How to use:**

1. Click the column title (for example, **Modified at**). The first click sorts in **descending** order.
2. Click the same title again to reverse it.

**How it works:** the default sort is by **Modified at**, from newest to oldest.

### Inventory table and criticality badge

**What it is:** the table of the selected view, with one row per artifact.

**What it is for:** checking where each artifact is, who created and modified it and, for types with governance, what its criticality is.

**How it works:**

| Column          | Description                                                                                                                                                                                            |
| --------------- | ------------------------------------------------------------------------------------------------------------------------------------------------------------------------------------------------------ |
| **ID**          | Identifier (GUID) of the item in Fabric                                                                                                                                                                |
| **Name**        | Artifact name. In Data Pipelines, Copy Jobs, Notebooks and Gen2 Dataflows with a defined criticality, a colored badge next to the name shows the level (**Low**, **Medium**, **High** or **Critical**) |
| **Type**        | Badge with the artifact type (only in the **All** view)                                                                                                                                                |
| **Workspace**   | Workspace where the item is published                                                                                                                                                                  |
| **Created by**  | Who created the item. In the **Dataflows** view the column is called **Configured by**, which is the information Power BI provides for dataflows                                                       |
| **Modified by** | Who made the last change                                                                                                                                                                               |
| **Created at**  | Creation date (not displayed in the **Dataflows** view)                                                                                                                                                |
| **Modified at** | Date of the last modification                                                                                                                                                                          |

When the information is not provided by Fabric, the cell displays **Not reported**. The criticality badge reflects what was recorded in **Edit governance** (on the item or cascaded from the workspace).

### Pagination

**What it is:** navigation between pages in the table footer, with 10 items per page.

**What it is for:** browsing large inventories without overloading the screen.

<figure><picture><source srcset="/files/EaojtLdWNtdarTLpVKqt" media="(prefers-color-scheme: dark)"><img src="https://3938213054-files.gitbook.io/~/files/v0/b/gitbook-x-prod.appspot.com/o/spaces%2FH2bFRBmIfyK3kwVKbldl%2Fuploads%2Fgit-blob-2b580c1dc2ddb9f46183ed20e5cec719c3bb6bc5%2Fpm-governanca-engenharia-de-dados-paginacao-en.png?alt=media" alt="Table footer with page navigation"></picture><figcaption><p>Table pagination</p></figcaption></figure>

**How to use:** use the footer controls to move forward, back or go to a specific page.

### Row actions menu (⋮)

**What it is:** the **⋮** button at the end of the row (or right-clicking it) opens the menu with **Open details** and, for Administrators, **Edit governance**.

**What it is for:** going straight to the modal tab you need or editing the item's governance metadata.

<figure><picture><source srcset="/files/ZPzzxsVHPZwuB4aLLr3k" media="(prefers-color-scheme: dark)"><img src="https://3938213054-files.gitbook.io/~/files/v0/b/gitbook-x-prod.appspot.com/o/spaces%2FH2bFRBmIfyK3kwVKbldl%2Fuploads%2Fgit-blob-918c03c355ed24af5888a055c468600aed02de4a%2Fpm-governanca-engenharia-de-dados-menu-acoes-en.png?alt=media" alt="Row actions menu with the Open details submenu"></picture><figcaption><p>Actions menu with the submenu of modal tabs</p></figcaption></figure>

**How to use:**

1. Click the row's **⋮** (or right-click it).
2. Click **Open details** to open the modal on the **Overview** tab, **or** hover over **Open details** and choose the tab in the submenu:
   * **Overview**
   * **Users & Permissions**
   * **Schedules**: only for Data Pipelines, Dataflows, Copy Jobs and Notebooks, the types that Fabric allows to be scheduled.
3. Administrators also see **Edit governance** for Data Pipelines, Copy Jobs, Notebooks and **Gen2** Dataflows (the types whose failures generate alerts): see [Edit governance](#edit-governance-owners-and-criticality).

Clicking anywhere on the row also opens the details modal, on the **Overview** tab.

### Details modal: Overview tab

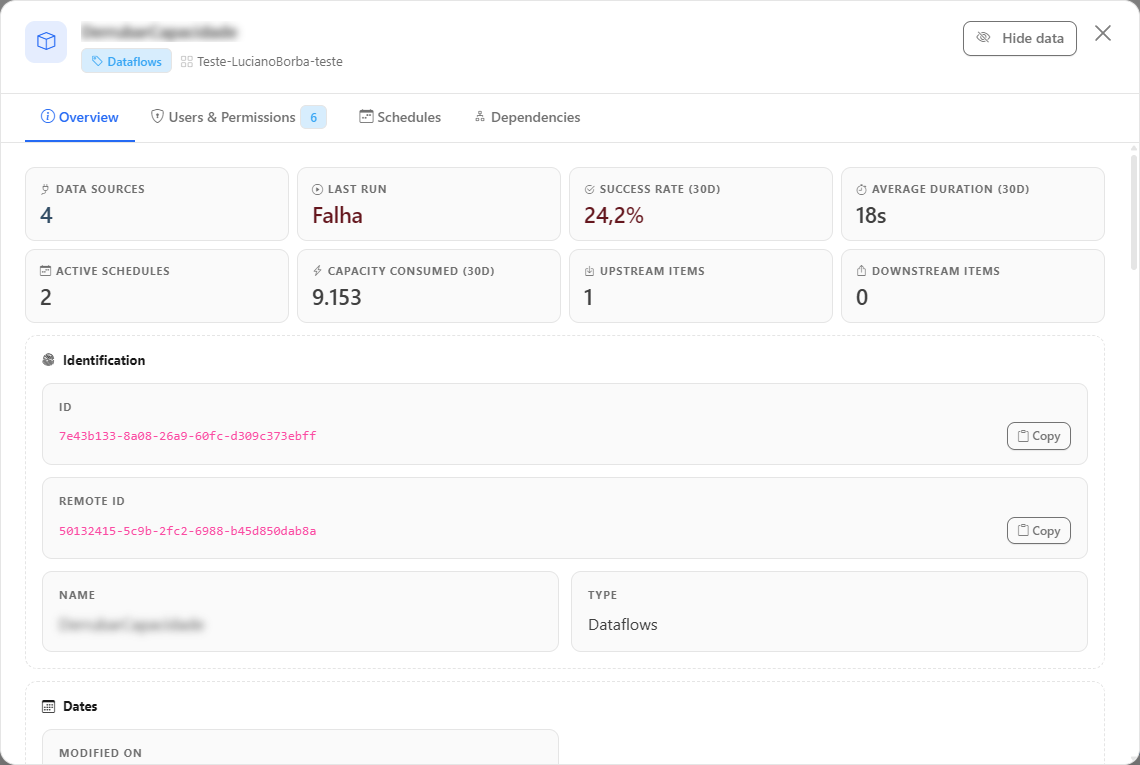
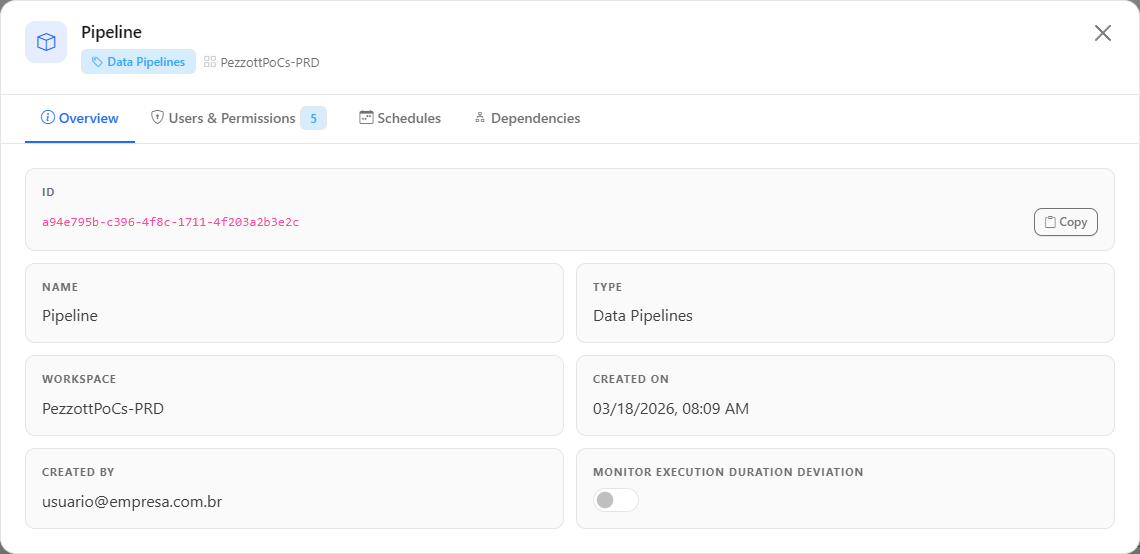
**What it is:** the artifact's record: **ID** (with a **Copy** button), **Name**, **Type**, **Workspace**, **Created at**, **Modified at**, **Created by**, **Modified by**, **Tags** and, when filled in, the **Governance** metadata (**Responsible person**, **Business Area Contact**, **Criticality**, **Business Area** and **Business Sub-Area**).

**What it is for:** checking an item's data and owners and copying the identifier to use in the Fabric portal, in scripts or in support tickets.

<figure><picture><source srcset="/files/Y0XfhVuQlvfZgXhKYSYx" media="(prefers-color-scheme: dark)"><img src="https://3938213054-files.gitbook.io/~/files/v0/b/gitbook-x-prod.appspot.com/o/spaces%2FH2bFRBmIfyK3kwVKbldl%2Fuploads%2Fgit-blob-d42f0423d5db685a260e013b41b10f02d2a612e7%2Fpm-governanca-engenharia-de-dados-modal-visao-geral-en.png?alt=media" alt="Details modal of a Data Pipeline on the Overview tab"></picture><figcaption><p>Details modal: Overview tab</p></figcaption></figure>

**How to use:**

1. Click a table row, or the **⋮** button › **Open details**.
2. Check the fields and the **Governance** section.
3. To copy the item's identifier, click **Copy** next to the **ID**; the button changes to **Copied!**.
4. To close, click the **X** in the header or outside the modal.

**How it works:** fields without a value are not displayed. For Data Pipelines, Dataflows, Copy Jobs and Notebooks, the tab also has the **Monitor execution duration deviation** switch (described below).

### Monitor execution duration deviation

**What it is:** a switch on the **Overview** tab of **Data Pipelines, Dataflows, Copy Jobs and Notebooks**. When it is on, Power Monitor tracks whether the item's runs are taking longer than its usual average time.

**What it is for:** being notified when an important pipeline or notebook starts to slow down, before the delay affects report refreshes.

<figure><picture><source srcset="/files/iMWczCegHsx2ikFOZoSC" media="(prefers-color-scheme: dark)"><img src="https://3938213054-files.gitbook.io/~/files/v0/b/gitbook-x-prod.appspot.com/o/spaces%2FH2bFRBmIfyK3kwVKbldl%2Fuploads%2Fgit-blob-38859f358adf8f7c2a5d46ddf376872ccf2d746e%2Fpm-governanca-engenharia-de-dados-modal-desvio-tempo-en.png?alt=media" alt="Overview tab of a Data Pipeline with the Monitor execution duration deviation switch"></picture><figcaption><p>Monitor execution duration deviation switch</p></figcaption></figure>

**How to use:**

{% hint style="info" %}
Requires the **Administrator** profile. The switch only appears when the modal is opened from the type's card (**Data Pipelines**, **Dataflows**, **Copy Jobs** or **Notebooks**), and not from the **All** view.
{% endhint %}

{% stepper %}
{% step %}

#### Select the type

Click the card of the item's type, for example **Data Pipelines**.
{% endstep %}

{% step %}

#### Open the item

Click the item's row to open the modal on the **Overview** tab.
{% endstep %}

{% step %}

#### Turn on the switch

Turn on the **Monitor execution duration deviation** switch. The change is saved immediately; to turn it off, click the switch again.
{% endstep %}

{% step %}

#### Track the result

The item starts being tracked in [Performance › Average Execution Time](/en/power-monitor/performance/tempo-medio-de-execucao.md). If saving fails, the switch returns to its previous state and the message "Failed to update the execution duration deviation monitoring." appears.
{% endstep %}
{% endstepper %}

**How it works:** for other profiles the switch appears disabled, with the tooltip "This action is restricted to organization administrators.".

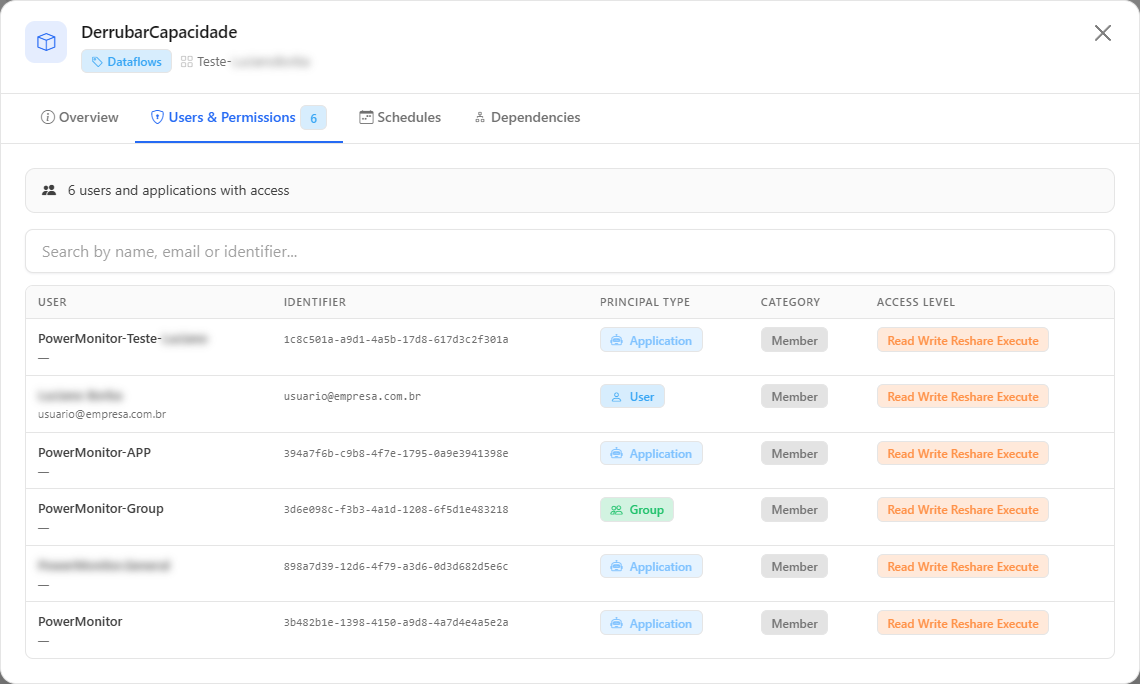
### Details modal: Users & Permissions tab
**What it is:** the list of users, groups and applications with access to the item, with the total at the top and the counter in the tab title.

**What it is for:** reviewing who can edit or run a pipeline or notebook, including external guests.

<figure><picture><source srcset="/files/izCpoESZ41KMgVmTdXkd" media="(prefers-color-scheme: dark)"><img src="https://3938213054-files.gitbook.io/~/files/v0/b/gitbook-x-prod.appspot.com/o/spaces%2FH2bFRBmIfyK3kwVKbldl%2Fuploads%2Fgit-blob-07154b4f7414386158d77a18b86e91ae1deb1903%2Fpm-governanca-engenharia-de-dados-modal-usuarios-en.png?alt=media" alt="Users and Permissions tab of the modal of a data engineering artifact"></picture><figcaption><p>Details modal: Users &#x26; Permissions tab</p></figcaption></figure>

**How to use:**

{% stepper %}
{% step %}

#### Open the tab

Click the row's **⋮** button and choose **Open details** › **Users & Permissions**.
{% endstep %}

{% step %}

#### Search for a principal

Type in the **Search by name, email or identifier...** box to locate a user, group or application.
{% endstep %}

{% step %}

#### Evaluate the access

Check the **User**, **Identifier**, **Principal Type** (**User**, **Group** or **Application**), **Category** (**Member** or **Guest/External**) and **Access Level** columns of each row.
{% endstep %}
{% endstepper %}

### Details modal: Schedules tab

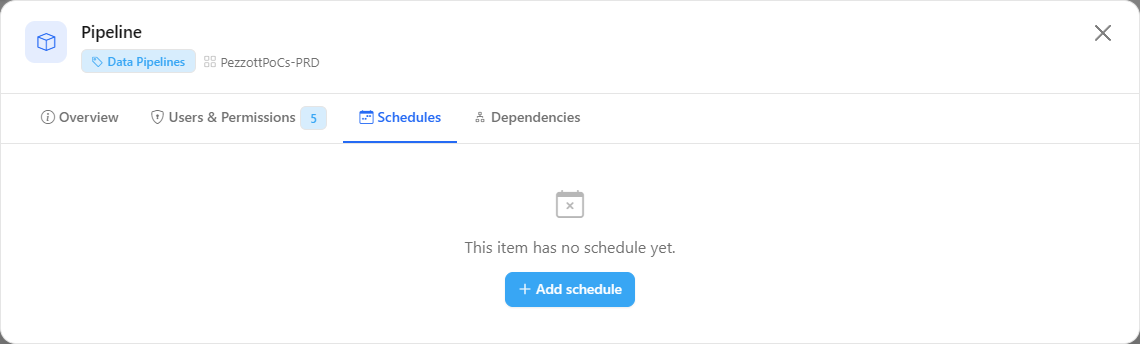
**What it is:** the list of the item's schedules, read **directly from Fabric** when the tab is opened, with the recurrence, the status (**Active** or **Paused**) and the time zone. It appears for Data Pipelines, Dataflows, Copy Jobs and Notebooks.

**What it is for:** checking when an item runs without opening the Fabric portal and, for Administrators, creating, changing, pausing or removing schedules.

<figure><picture><source srcset="/files/11JhnbXO5SzPxisVMPGr" media="(prefers-color-scheme: dark)"><img src="https://3938213054-files.gitbook.io/~/files/v0/b/gitbook-x-prod.appspot.com/o/spaces%2FH2bFRBmIfyK3kwVKbldl%2Fuploads%2Fgit-blob-77f96474b8135288e47a259387999afddeae17cd%2Fpm-governanca-engenharia-de-dados-modal-agendamentos-en.png?alt=media" alt="Schedules tab of the modal of a Data Pipeline"></picture><figcaption><p>Schedules tab: live reading of the item's schedules in Fabric</p></figcaption></figure>

#### How to view an item's schedules

1. Click the row's **⋮** button and choose **Open details** › **Schedules**.
2. Wait for the message "Checking the service principal’s access…" to disappear.
3. Check each schedule: the recurrence, the status (**Active** or **Paused**) and the time zone. If the item has no schedule, the tab displays "This item has no schedule yet.".

{% hint style="warning" %}
If the organization's Service Principal does not have access to the item's workspace, the tab states that it cannot read or create schedules. Click **Grant access to the service principal** to open the permission flow, or grant access manually in the workspace. If the organization does not have a Service Principal configured, the tab guides you to configure it in Settings.
{% endhint %}

#### How to add a schedule

{% hint style="info" %}
Requires the **Administrator** profile and that the organization's Service Principal has access to the item's workspace.
{% endhint %}

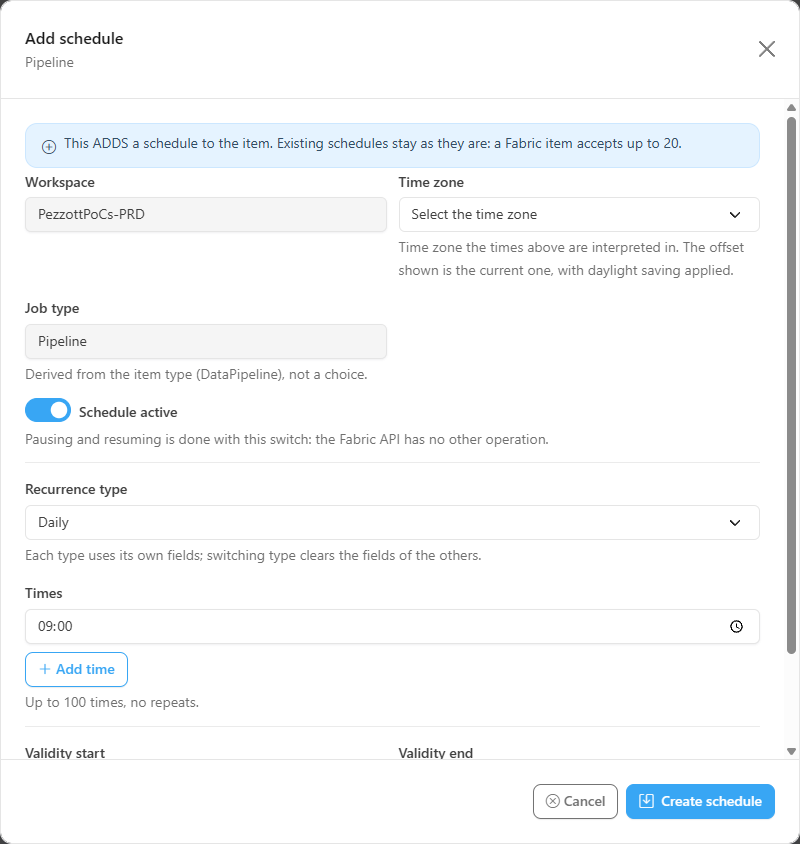
<figure><picture><source srcset="/files/LCv4c2JY06DGvprmW9WA" media="(prefers-color-scheme: dark)"><img src="https://3938213054-files.gitbook.io/~/files/v0/b/gitbook-x-prod.appspot.com/o/spaces%2FH2bFRBmIfyK3kwVKbldl%2Fuploads%2Fgit-blob-87b316d299ab348c17736fdd0bc67452e376b24e%2Fpm-governanca-engenharia-de-dados-agendamento-formulario-en.png?alt=media" alt="Add schedule form opened from the Schedules tab of an item"></picture><figcaption><p>Add schedule form</p></figcaption></figure>

{% stepper %}
{% step %}

#### Open the Schedules tab

Click the row's **⋮** button and choose **Open details** › **Schedules**.
{% endstep %}

{% step %}

#### Start the registration

Click **Add schedule**. The **Add schedule** form opens, with the job type already defined based on the item type.
{% endstep %}

{% step %}

#### Fill in the form

Define the recurrence, the times, the **Time zone** and, optionally, the **Validity start** and **Validity end**. The form fields are detailed in [Schedules](/en/power-monitor/governanca/operacao/agendamentos.md).
{% endstep %}

{% step %}

#### Save

Click **Create schedule**. The new schedule is added to the item in Fabric (existing schedules remain as they are) and starts appearing in the tab's list.
{% endstep %}
{% endstepper %}

#### How to edit or delete a schedule

{% hint style="info" %}
Requires the **Administrator** profile.
{% endhint %}

1. On the item's **Schedules** tab, locate the schedule.
2. To change it, click **Edit**, adjust the fields in the **Edit schedule** form and click **Save**. Fabric replaces the entire schedule configuration with what you submit. To pause or reactivate it, use the form's **Schedule active**/**Schedule paused** selector.
3. To remove it, click **Delete**, check the schedule in the **Delete schedule** form, and click **Delete schedule** (the form itself is the confirmation). Only that schedule is deleted, and the action cannot be undone.

### Details modal: Dependencies tab

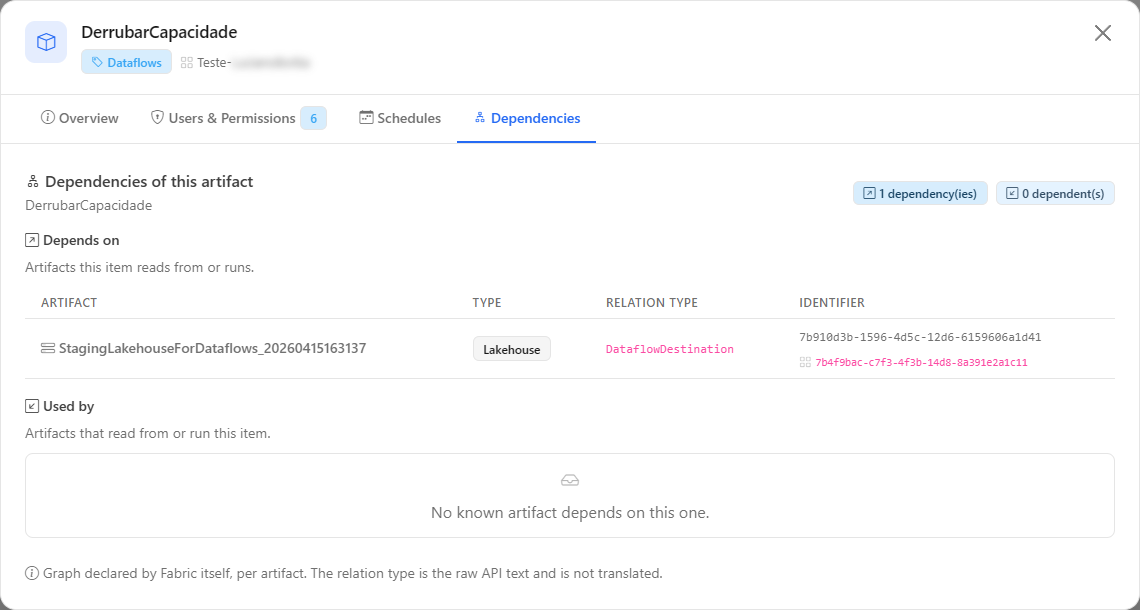
**What it is:** the dependency graph declared by Fabric itself, with the **Depends on** (artifacts that the item reads or runs) and **Used by** (artifacts that read or run the item) sections. It appears for Data Pipelines, Notebooks, Dataflows and Copy Jobs.

**What it is for:** assessing the impact before changing or removing an item: for example, finding out which pipelines run a notebook.

<figure><picture><source srcset="/files/c5YlfMOpDGQMAz8i0719" media="(prefers-color-scheme: dark)"><img src="https://3938213054-files.gitbook.io/~/files/v0/b/gitbook-x-prod.appspot.com/o/spaces%2FH2bFRBmIfyK3kwVKbldl%2Fuploads%2Fgit-blob-7bbe044b29441124c0b868c0ed7de6f46f868255%2Fpm-governanca-engenharia-de-dados-modal-dependencias-en.png?alt=media" alt="Dependencies tab of the modal of a Data Pipeline, with the Depends on and Used by sections"></picture><figcaption><p>Dependencies tab</p></figcaption></figure>

**How to use:**

1. Click the item's row to open the details modal.
2. Click the **Dependencies** tab.
3. Check the **Depends on** and **Used by** sections.

**How it works:** an **Unidentified artifact** row indicates a real dependency on an artifact outside the monitored scope (unmonitored workspace, type not collected or not yet scanned): only the name is not available.

### Edit governance (owners and criticality)

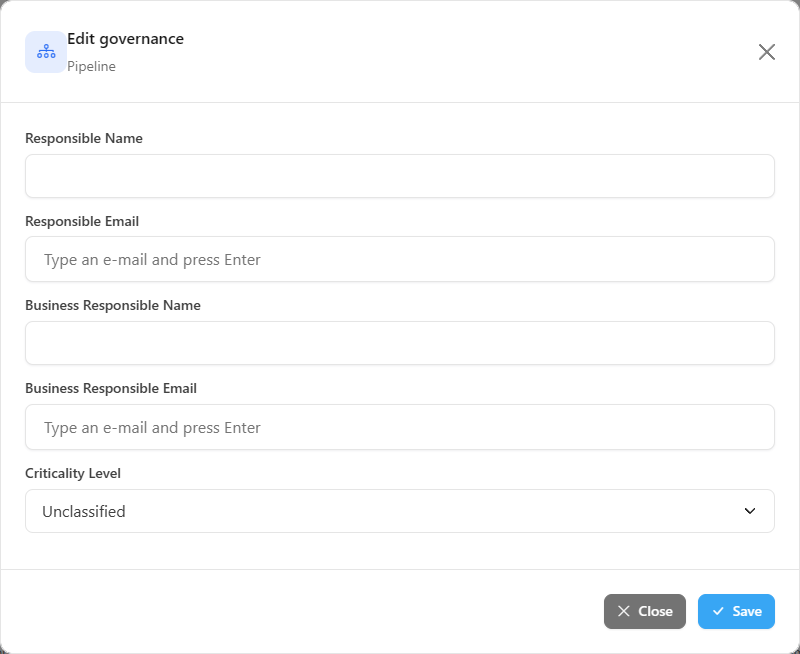
**What it is:** the governance metadata modal of a Fabric item, opened by the **Edit governance** item in the **⋮** menu. Available for Data Pipelines, Copy Jobs, Notebooks and **Gen2** Dataflows.

**What it is for:** recording the technical owner, the business contact and the criticality of the item: for example, so that failures of **Critical** items are notified even when the workspace is not critical.

<figure><picture><source srcset="/files/E7tfttfBgt1XzAye2DGG" media="(prefers-color-scheme: dark)"><img src="https://3938213054-files.gitbook.io/~/files/v0/b/gitbook-x-prod.appspot.com/o/spaces%2FH2bFRBmIfyK3kwVKbldl%2Fuploads%2Fgit-blob-89a53baa10cd0fddef36e2ebabbbc2863559d6a7%2Fpm-governanca-engenharia-de-dados-editar-governanca-en.png?alt=media" alt="Edit governance modal of a Data Pipeline with owners and criticality level"></picture><figcaption><p>Editing the governance of a Fabric item</p></figcaption></figure>

#### How to edit the governance of a Fabric item

Requires the **Administrator** profile.

{% stepper %}
{% step %}

#### Open the row menu

In *Governance › Data and Engineering › Data Engineering*, click the type's card (for example, **Data Pipelines**), locate the item and click the **⋮** at the end of the row (or right-click it).
{% endstep %}

{% step %}

#### Choose Edit governance

Click **Edit governance**. The option only appears for Administrators and for the types with governance (Gen1 Dataflows do not have it).
{% endstep %}

{% step %}

#### Fill in the fields

Enter the **Responsible Name** and **Responsible Email**, the **Business Responsible Name** and **Business Responsible Email** and the **Criticality Level** (**Low**, **Medium**, **High**, **Critical** or **Unclassified**). In the e-mail fields, type each address and press **Enter**.
{% endstep %}

{% step %}

#### Save

Click **Save**. The success message confirms the save, the modal closes and the criticality badge appears next to the item's name. If the item has been deleted in Fabric or changed type, *One or more items were not found in the organization (they may have been deleted or changed type). Nothing was changed.* appears.
{% endstep %}
{% endstepper %}

**How it works:**

* The same fields can be filled in by cascading from the workspace: edit the workspace's governance in [Workspaces](/en/power-monitor/governanca/workspaces.md#how-to-edit-the-governance-metadata) and select **Apply to all items in the workspace**: the values are saved to the semantic models and also to the workspace's pipelines, copy jobs, notebooks and Gen2 dataflows.
* The item's criticality is used by the **Fabric item criticality** filter of the failure notifications ([Settings › Notifications](/en/power-monitor/configuracoes/notificacoes.md#how-filters-are-evaluated)).
* Area and Sub-Area exist only on the workspace. Gen1 Dataflows, Environments, dbt, Spark Job Definitions and Airflow Jobs do not have per-item governance.

## Rules and behavior

* **Data source:** artifacts are collected by the [Inventory Scan](/en/power-monitor/mapeamento/inventarios.md) (Power BI/Fabric admin APIs). Changes made in Fabric appear here after the next scan run.
* **Monitored workspaces only:** the list shows the artifacts of the workspaces the organization chose to monitor; there is no option to include unmonitored workspaces.
* **Workspace scope:** if your user has visibility restricted to some workspaces, you will see only their artifacts.
* **Deleted items do not appear.** When an artifact no longer exists in Fabric, it is removed from this screen and listed in [Deleted Artifacts](/en/power-monitor/governanca/operacao/artefatos-excluidos.md). The same applies to the items of a deleted workspace.
* **Dates** are displayed in your browser's time zone.
* The **Schedules** tab queries Fabric in real time using the organization's Service Principal; the other information comes from the inventory collected by the scan.

## Step by step: common tasks

### How to find out who maintains a pipeline

{% stepper %}
{% step %}

#### Filter by type

Click the **Data Pipelines** card.
{% endstep %}

{% step %}

#### Locate the pipeline

Type part of the name in the **Name** column filter (or the workspace name in the **Workspace** column).
{% endstep %}

{% step %}

#### Check the owners

See **Created by** and **Modified by** on the row itself. For the business owners (governance metadata), open the modal from the row and check the **Governance** section of the **Overview** tab.
{% endstep %}
{% endstepper %}

### How to find notebooks without maintenance

{% stepper %}
{% step %}

#### Select the type

Click the **Notebooks** card.
{% endstep %}

{% step %}

#### Set the period

In the **Modified at** filter, enter an old end date (for example, six months ago) to list only the items that have not changed since then.
{% endstep %}

{% step %}

#### Evaluate the list

Sort by **Modified at** and check, through the modal's **Dependencies** tab, whether any other artifact still depends on the notebook before proposing its removal.
{% endstep %}
{% endstepper %}

## Frequently asked questions

<details>

<summary>Why doesn't the sum of the cards match the "All" card?</summary>

The **All** card adds up only Data Pipelines, Dataflows, Copy Jobs, Notebooks, Environments and Data Build Tool Jobs. **Spark Job Definitions** and **Apache Airflow Jobs** are counted only on their own cards.

</details>

<details>

<summary>I created a pipeline in Fabric and it does not appear yet. Why?</summary>

The list is fed by the Inventory Scan. The item appears after the next scan run, as long as the workspace is monitored, covered by the scan and within your viewing scope.

</details>

<details>

<summary>Why doesn't the Schedules tab appear for Environments, dbt, Spark or Airflow?</summary>

Power Monitor only offers the tab for the types that the Fabric API allows to be scheduled: Data Pipelines, Dataflows, Copy Jobs and Notebooks.

</details>

<details>

<summary>I cannot turn on the "Monitor execution duration deviation" switch.</summary>

The switch is exclusive to **Administrators**. In addition, it only appears when the modal is opened from the type's card (Data Pipelines, Dataflows, Copy Jobs or Notebooks), and not from the **All** view.

</details>

<details>

<summary>I do not see the "Add schedule" button on the Schedules tab.</summary>

Adding, editing and deleting schedules is exclusive to **Administrators**. Other profiles can only view the schedules. If the tab shows an access warning, the organization's Service Principal needs to be granted access to the item's workspace.

</details>

<details>

<summary>Why doesn't a Dataflow show "Created by" and "Created at"?</summary>

For dataflows, Power BI reports who **configured** the dataflow and the modification date, but not the creation date. That is why the view shows **Configured by** and does not have the **Created at** column.

</details>

<details>

<summary>I do not see the "Edit governance" option in the row menu.</summary>

The option is exclusive to **Administrators** and appears only for Data Pipelines, Copy Jobs, Notebooks and **Gen2** Dataflows: the types whose failures generate alerts. Environments, dbt, Spark Job Definitions, Airflow Jobs and Gen1 Dataflows do not have per-item governance.

</details>

<details>

<summary>I filled in a filter and it disappeared when I switched cards. Is that normal?</summary>

Yes. When you switch cards, the column and period filters are cleared. Choose the card first and then apply the filters.

</details>

## Related pages

* [Schedules](/en/power-monitor/governanca/operacao/agendamentos.md)
* [Deleted Artifacts](/en/power-monitor/governanca/operacao/artefatos-excluidos.md)
* [Workspaces](/en/power-monitor/governanca/workspaces.md)
* [Monitoring › Fabric Items](/en/power-monitor/monitoramento/itens-do-microsoft-fabric.md)
* [Performance › Average Execution Time](/en/power-monitor/performance/tempo-medio-de-execucao.md)
* [Settings › Notifications (criticality filters)](/en/power-monitor/configuracoes/notificacoes.md)
* [Mapping › Inventory](/en/power-monitor/mapeamento/inventarios.md)


---

# Agent Instructions
This documentation is published with GitBook. GitBook is the documentation platform designed so that both humans and AI agents can read, navigate, and reason over technical content effectively. Learn more at gitbook.com.

## Querying This Documentation
If you need additional information that is not directly available in this page, you can query the documentation by asking a question.

Perform an HTTP GET request on the following URL with the `ask` and `goal` query parameters:

```
GET https://docs.powermonitor.com.br/en/power-monitor/governanca/dados-e-engenharia/engenharia-de-dados.md?ask=<question>&goal=<user_goal>
```

`ask` is the immediate question: it should be specific, self-contained, and written in natural language.
`goal` is what the user is ultimately trying to achieve, the reason they need the answer. Sharing it helps GitBook give you a better, more relevant answer. A goal is most helpful when it describes the outcome the user wants rather than restating the question. For example, with `ask=how do I create an API token`, a goal like `automate deployments from our CI pipeline` lets GitBook tailor the answer to that use case.

The response will contain a direct answer to the question and relevant excerpts and sources from the documentation.

Use this mechanism when the answer is not explicitly present in the current page, you need clarification or additional context, or you want to retrieve related documentation sections.