> For the complete documentation index, see [llms.txt](https://docs.powermonitor.com.br/llms.txt). Markdown versions of documentation pages are available by appending `.md` to page URLs; this page is available as [Markdown](https://docs.powermonitor.com.br/en/power-monitor/governanca/dados-e-engenharia/fabric-mirroring.md).

# Fabric Mirroring

Inventory of the tenant's mirrored databases (Fabric Mirroring / Mirrored Databases), with a live query of the sync status of each table.

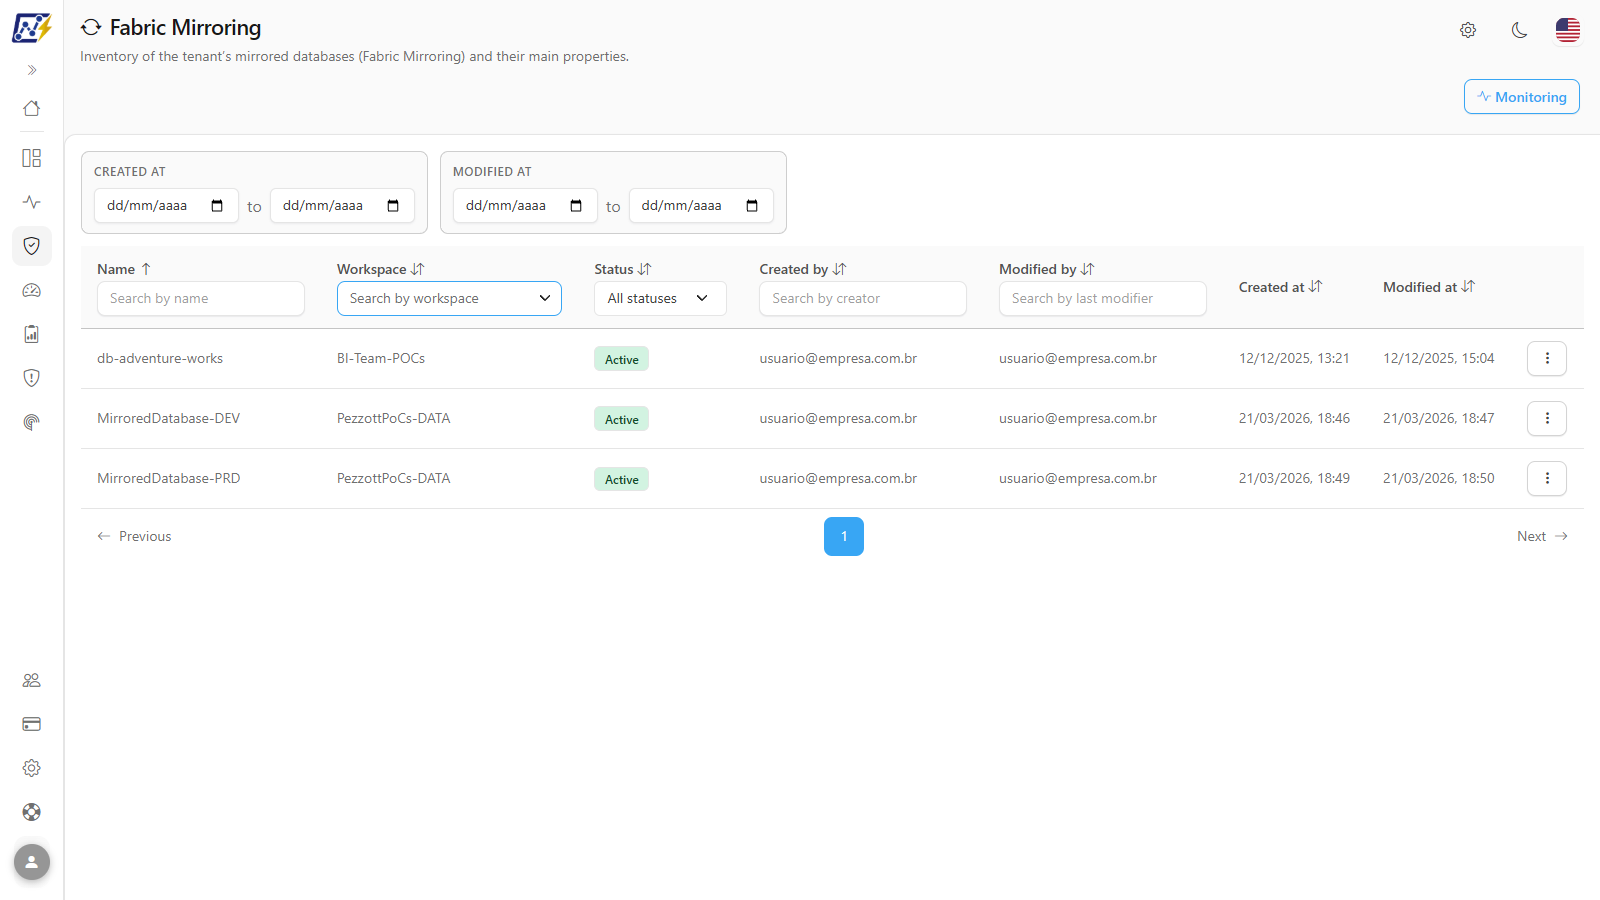
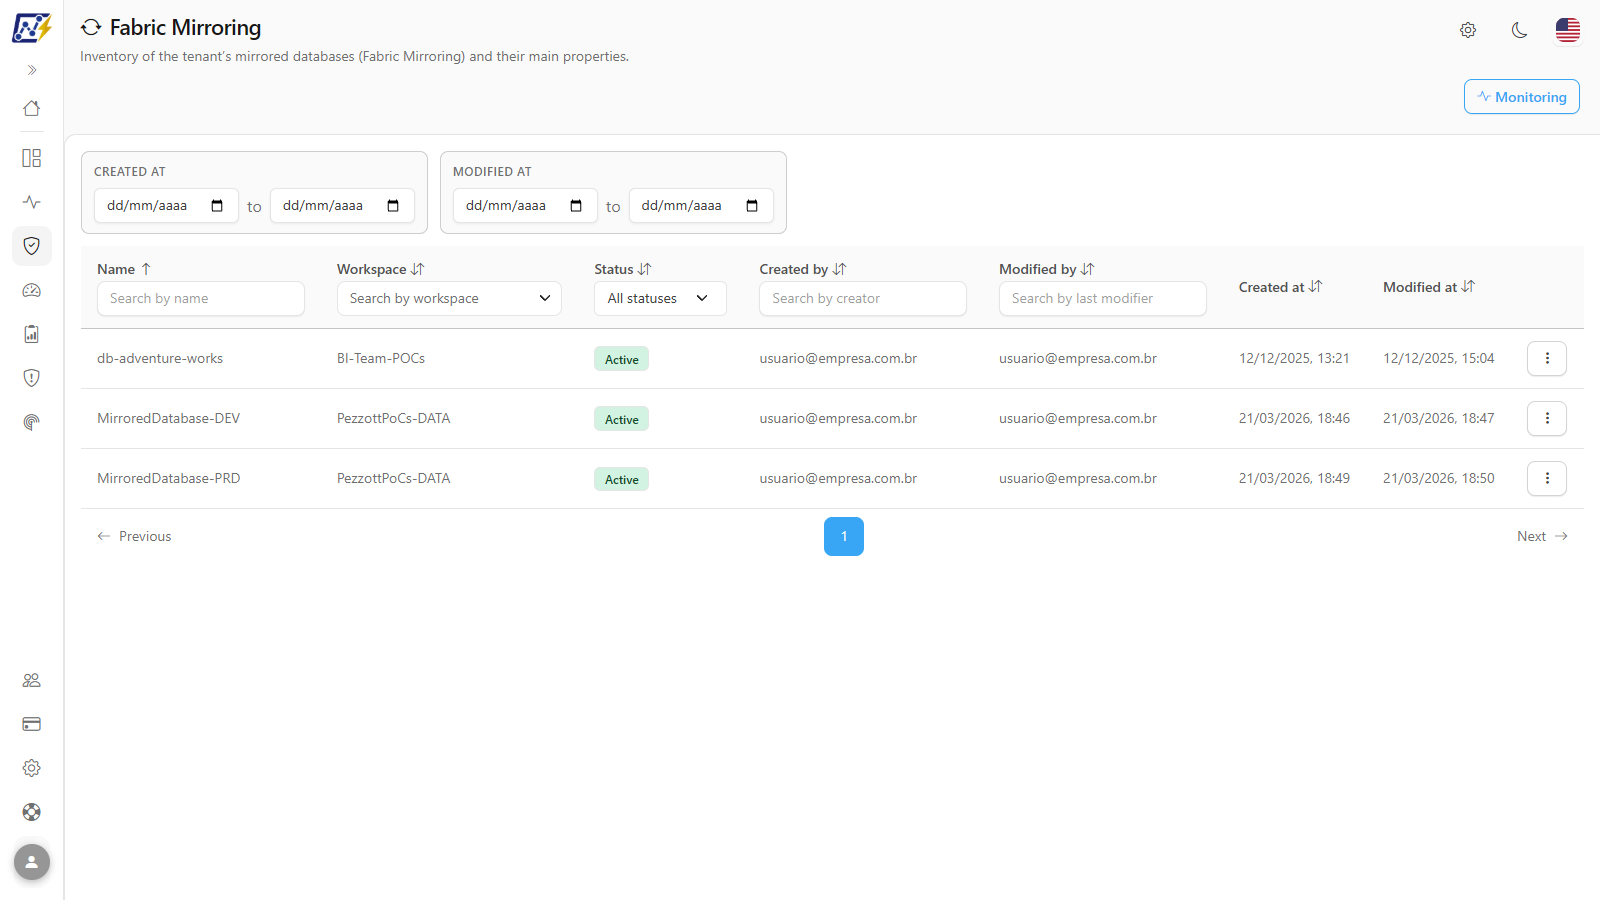
The **Fabric Mirroring** screen (under *Governance*) is the inventory of Microsoft Fabric **mirrored databases** (*Mirrored Databases*) in the monitored workspaces, that is, the continuous replicas, in OneLake, of databases such as Azure SQL, Snowflake, Cosmos DB and others. In addition to listing what exists, the screen queries the sync status of each database **live**, table by table.

**How to access:** menu *Governance › Data and Engineering › Fabric Mirroring*. Available to all profiles. The screen is read-only.

<figure><picture><source srcset="/files/F3L9t6t4Ya5mtBiZtaHs" media="(prefers-color-scheme: dark)"><img src="https://3938213054-files.gitbook.io/~/files/v0/b/gitbook-x-prod.appspot.com/o/spaces%2FH2bFRBmIfyK3kwVKbldl%2Fuploads%2Fgit-blob-47f3e2fdc19f3ccb3d0fc04bfd8dd4d1a108a3a2%2Fpm-governanca-fabric-mirroring-en.png?alt=media" alt="Governance Fabric Mirroring screen with the table of mirrored databases and the Monitoring button"></picture><figcaption><p>Inventory of mirrored databases</p></figcaption></figure>

{% hint style="info" %}
There are two screens named *Fabric Mirroring*. This one, under **Governance**, answers "what exists" and "what is the sync status right now". The one under [Monitoring › Fabric Mirroring](/en/power-monitor/monitoramento/fabric-mirroring.md) is where you configure **delay limits and e-mail alerts** for each database. The **Monitoring** button, at the top of this screen, takes you directly there.
{% endhint %}

## What it is for

* Inventory all mirrored databases in the environment, with owner and dates.
* Check, on the spot, whether a database is replicating and which tables are late, stopped or failing, without having to configure monitoring first.
* Audit who has access to each mirrored database and which artifacts depend on it.

## Features

The screen follows the [common structure of the Governance lists](/en/power-monitor/governanca/relatorios.md#common-structure-of-the-lists).

### Mirrored databases table

**What it is:** the list of all mirrored databases in the monitored workspaces, one per row.

**What it is for:** having the complete inventory in one place and quickly identifying the workspace, the author and the date of the last change of each database.

| Column          | Description                                                   |
| --------------- | ------------------------------------------------------------- |
| **Name**        | Name of the mirrored database.                                |
| **Workspace**   | Workspace of the database.                                    |
| **Status**      | **Active** (green), **Inactive** or **Unknown** (gray) badge. |
| **Created by**  | Account that created the database.                            |
| **Modified by** | Account of the last change.                                   |
| **Created at**  | Creation date and time.                                       |
| **Modified at** | Date and time of the last change.                             |
| **⋮**           | Row actions menu.                                             |

**How to use:**

1. Go to *Governance › Data and Engineering › Fabric Mirroring*.
2. Browse the list. Use **Previous**, **Next** or the page number, in the footer, to navigate (10 items per page).
3. Click anywhere on a row to open the database details.

**How it works:**

* The list comes from the [Inventory Scan](/en/power-monitor/mapeamento/inventarios.md) and shows only databases from monitored workspaces. Databases deleted in the tenant are removed from the list.
* When a value is not provided by Fabric, the cell shows "-" (or "Not reported", in the date columns).
* If no database matches the filters, the table shows "No mirrored database found.".
* If the list cannot be loaded, the screen shows "Could not load the mirrored databases." with the **Try again** button, which reruns the query.

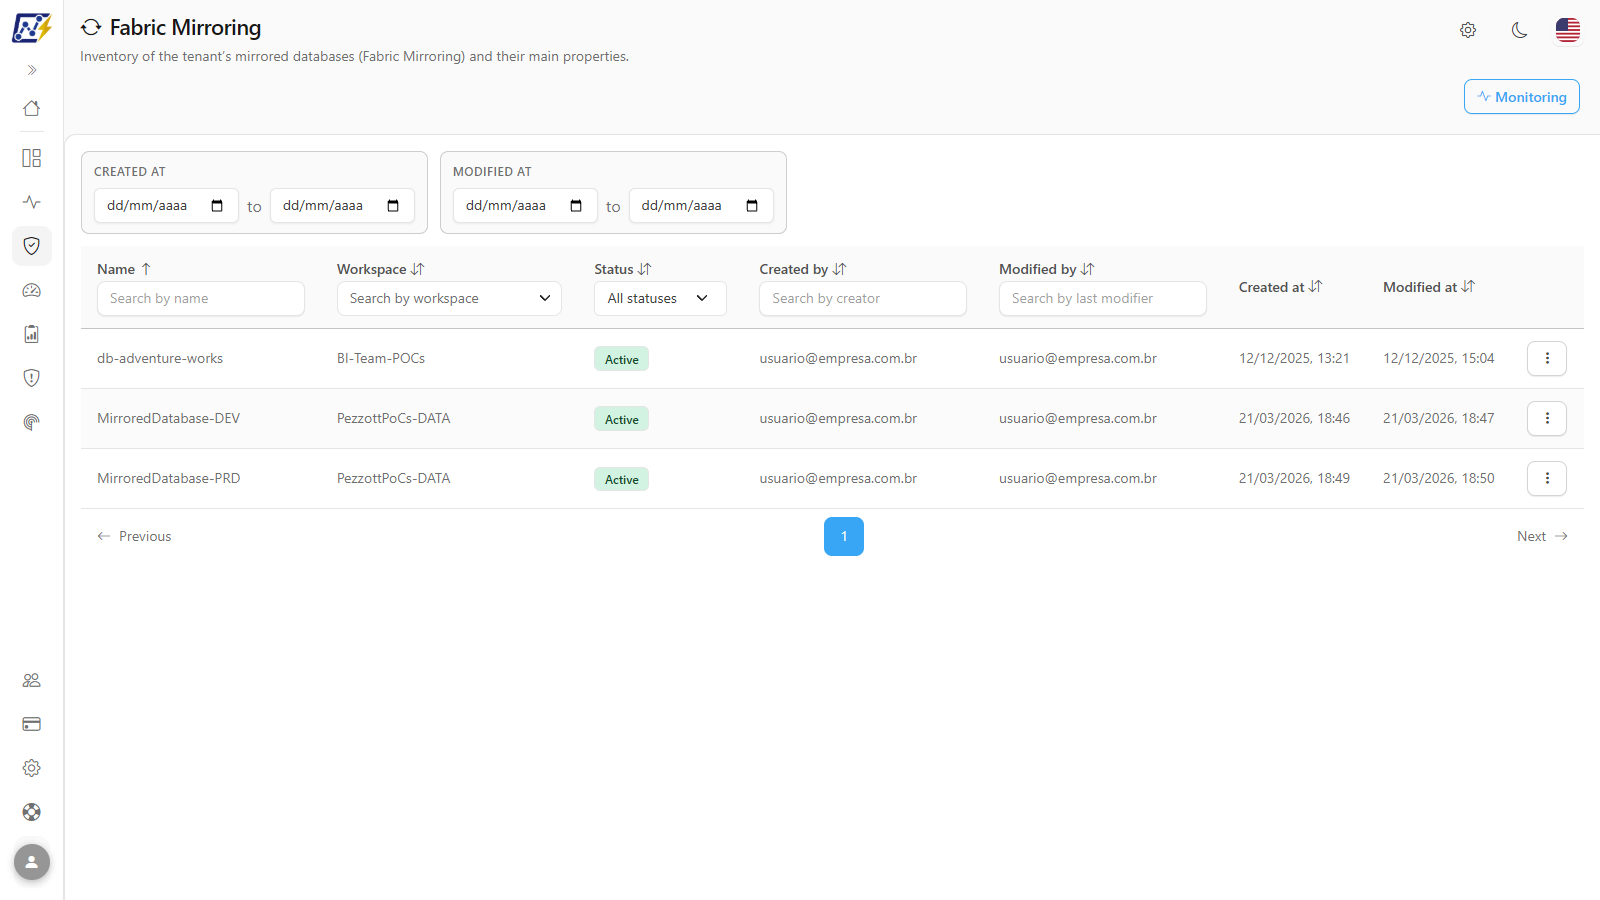
### Monitoring button

**What it is:** the **Monitoring** button, in the upper-right corner of the screen.

**What it is for:** going directly to the screen where continuous monitoring of the databases is configured (maximum delay per table and e-mail alert recipients).

<figure><picture><source srcset="/files/vVTSa8RIgOWQVsA0zTDu" media="(prefers-color-scheme: dark)"><img src="https://3938213054-files.gitbook.io/~/files/v0/b/gitbook-x-prod.appspot.com/o/spaces%2FH2bFRBmIfyK3kwVKbldl%2Fuploads%2Fgit-blob-9947768466b57fa54c2a3ba7178339c944abed88%2Fpm-governanca-fabric-mirroring-botao-monitoramento-en.png?alt=media" alt="Header of the Fabric Mirroring screen with the Monitoring button"></picture><figcaption><p>Monitoring button in the header</p></figcaption></figure>

**How to use:**

1. Click **Monitoring**.
2. You are taken to *Monitoring › Fabric Mirroring*.

**How it works:** the button only navigates; any profile can open the destination screen, but creating, editing or deleting a monitor there is exclusive to the **Administrator** profile.

### Text filters (Name, Created by, Modified by)

**What it is:** search boxes just below the titles of the **Name** (*Search by name*), **Created by** (*Search by creator*) and **Modified by** (*Search by last modifier*) columns.

**What it is for:** locating a database by name or all databases created or changed by a person, for example, by an employee who left the company.

**How to use:**

1. Type part of the name, the e-mail or the person's name in the box of the desired column.
2. The table is filtered automatically, right after you stop typing, and returns to the first page.
3. Delete the text to remove the filter.

**How it works:** the search matches part of the text and is not case-sensitive. Filters on different columns are combined.

### Workspace filter

**What it is:** a multi-select list (*Search by workspace*) below the **Workspace** column title.

**What it is for:** seeing only the mirrored databases of one or more workspaces, for example, only the production ones.

<figure><picture><source srcset="/files/0V86NfpjsFqhGWtKCrXu" media="(prefers-color-scheme: dark)"><img src="https://3938213054-files.gitbook.io/~/files/v0/b/gitbook-x-prod.appspot.com/o/spaces%2FH2bFRBmIfyK3kwVKbldl%2Fuploads%2Fgit-blob-f4737c658f42e698b592f57ad7bddd2e9d405937%2Fpm-governanca-fabric-mirroring-filtro-workspace-en.png?alt=media" alt="Multi-select list of workspaces open in the Workspace column"></picture><figcaption><p>Workspace filter with multi-select</p></figcaption></figure>

**How to use:**

1. Click **Search by workspace**.
2. If the list is long, type in the **Search...** box to find the workspace.
3. Select one or more workspaces. Use **Select all** / **Deselect all** to select or clear the visible workspaces at once.
4. To clear the filter, click the **X** next to the selection.

**How it works:** the list offers only the workspaces that have at least one mirrored database on the screen. Each click applies the filter immediately and returns the table to the first page.

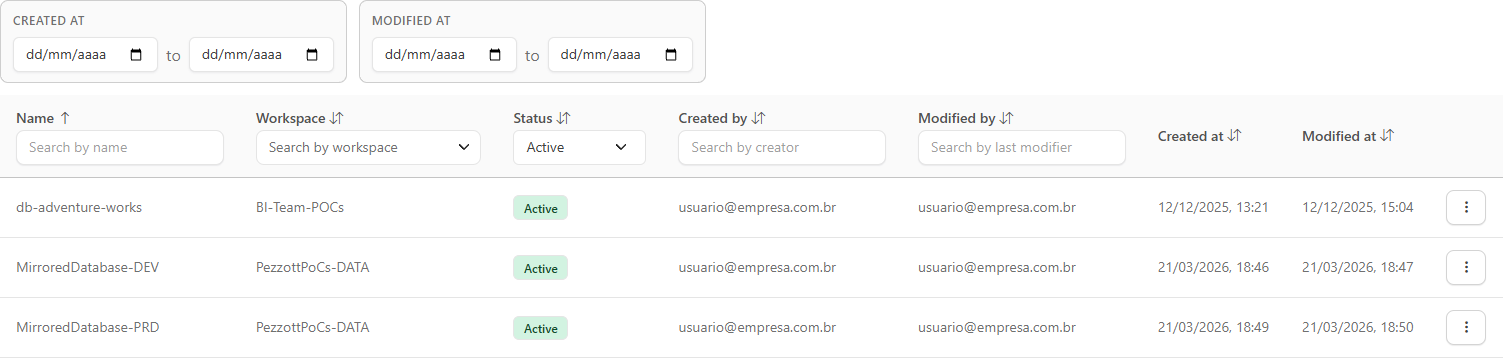
### Status filter

**What it is:** the **All statuses** list, below the **Status** column title.

**What it is for:** separating active databases from inactive ones, for example, to find databases that nobody uses anymore and can be removed.

<figure><picture><source srcset="/files/EtVOoBTtGRxuMtn2vUz2" media="(prefers-color-scheme: dark)"><img src="https://3938213054-files.gitbook.io/~/files/v0/b/gitbook-x-prod.appspot.com/o/spaces%2FH2bFRBmIfyK3kwVKbldl%2Fuploads%2Fgit-blob-598736275de0736041afd1e2d4f37199c667ef3e%2Fpm-governanca-fabric-mirroring-filtro-status-en.png?alt=media" alt="Table of mirrored databases filtered by the Active status"></picture><figcaption><p>Table filtered by status</p></figcaption></figure>

**How to use:**

1. Open the **All statuses** list.
2. Choose **Active**, **Inactive** or **Unknown**.
3. To remove the filter, choose **All statuses** again.

### Period filter (Created at and Modified at)

**What it is:** the **Created at** and **Modified at** boxes, above the table, each with a start date and an end date (**to**).

**What it is for:** finding databases created in a period (for example, in the last month) or that have not been changed for a long time.

<figure><picture><source srcset="/files/DNdNEjPenN8orVP5cSMy" media="(prefers-color-scheme: dark)"><img src="https://3938213054-files.gitbook.io/~/files/v0/b/gitbook-x-prod.appspot.com/o/spaces%2FH2bFRBmIfyK3kwVKbldl%2Fuploads%2Fgit-blob-ec3c579757bed3d659764c36bf8434481022999d%2Fpm-governanca-fabric-mirroring-filtro-periodo-en.png?alt=media" alt="Created at and Modified at period boxes with start date and end date"></picture><figcaption><p>Period filter</p></figcaption></figure>

**How to use:**

1. In the **Created at** (or **Modified at**) box, enter the start date, the end date or both.
2. The table shows only the databases within the range.
3. Clear the dates to remove the filter.

**How it works:** dates are interpreted in your browser's time zone, from the beginning of the start day to the end of the end day. Databases without the corresponding date do not appear when a range is filled in.

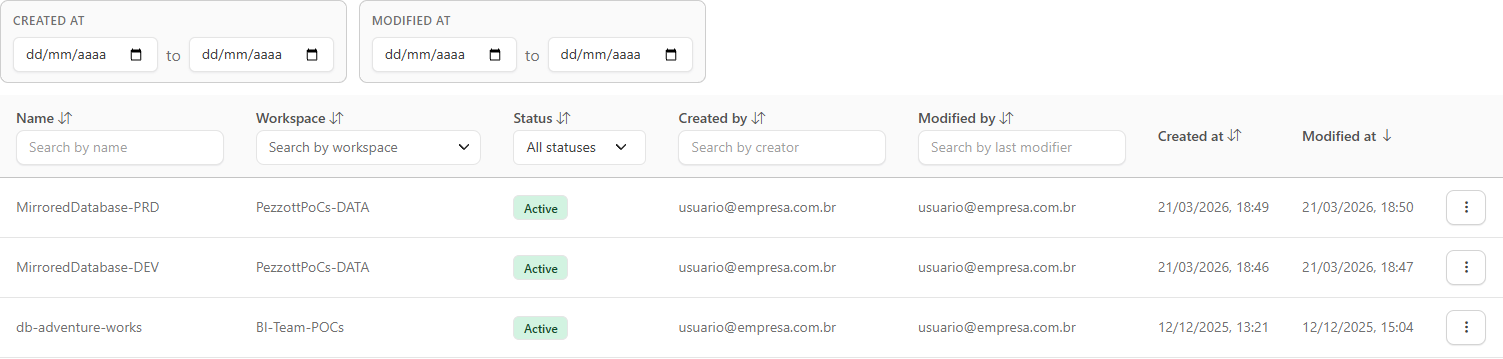
### Sorting

**What it is:** sorting the table by clicking a column title.

**What it is for:** bringing to the top, for example, the most recently changed databases, or grouping by workspace.

<figure><picture><source srcset="/files/Mo0mnpxlYjbit6EoZ5EL" media="(prefers-color-scheme: dark)"><img src="https://3938213054-files.gitbook.io/~/files/v0/b/gitbook-x-prod.appspot.com/o/spaces%2FH2bFRBmIfyK3kwVKbldl%2Fuploads%2Fgit-blob-3e65baf252b3c3ac30f474c0f6311894d84c750b%2Fpm-governanca-fabric-mirroring-ordenacao-en.png?alt=media" alt="Table of mirrored databases sorted by the Modified at column"></picture><figcaption><p>Table sorted by Modified at</p></figcaption></figure>

**How to use:**

1. Click the column title (for example, **Modified at**). The first click sorts in descending order.
2. Click again to reverse the order. The arrow next to the title indicates the direction.

**How it works:** by default, the list is sorted by **Name**, in alphabetical order. All columns with data can be sorted.

### Actions menu (⋮)

**What it is:** the menu opened by the **⋮** button at the end of the row, or by right-clicking the row. It has the **Open details** item, with a submenu of the modal tabs.

**What it is for:** opening the details modal directly on the tab of interest.

<figure><picture><source srcset="/files/3QrWhL7N2MUPF8GUl7Vq" media="(prefers-color-scheme: dark)"><img src="https://3938213054-files.gitbook.io/~/files/v0/b/gitbook-x-prod.appspot.com/o/spaces%2FH2bFRBmIfyK3kwVKbldl%2Fuploads%2Fgit-blob-1db432146f60dd19f76fe56b27cadce2c09e2667%2Fpm-governanca-fabric-mirroring-menu-acoes-en.png?alt=media" alt="Row actions menu with the Open details submenu open"></picture><figcaption><p>Actions menu with the Open details submenu</p></figcaption></figure>
**How to use:**

1. Click **⋮** on the database row (or right-click it).
2. Click **Open details** to open the modal on the **Overview** tab, or hover over the item and choose **Overview** or **Users & Permissions** in the submenu.

### Details modal: Overview

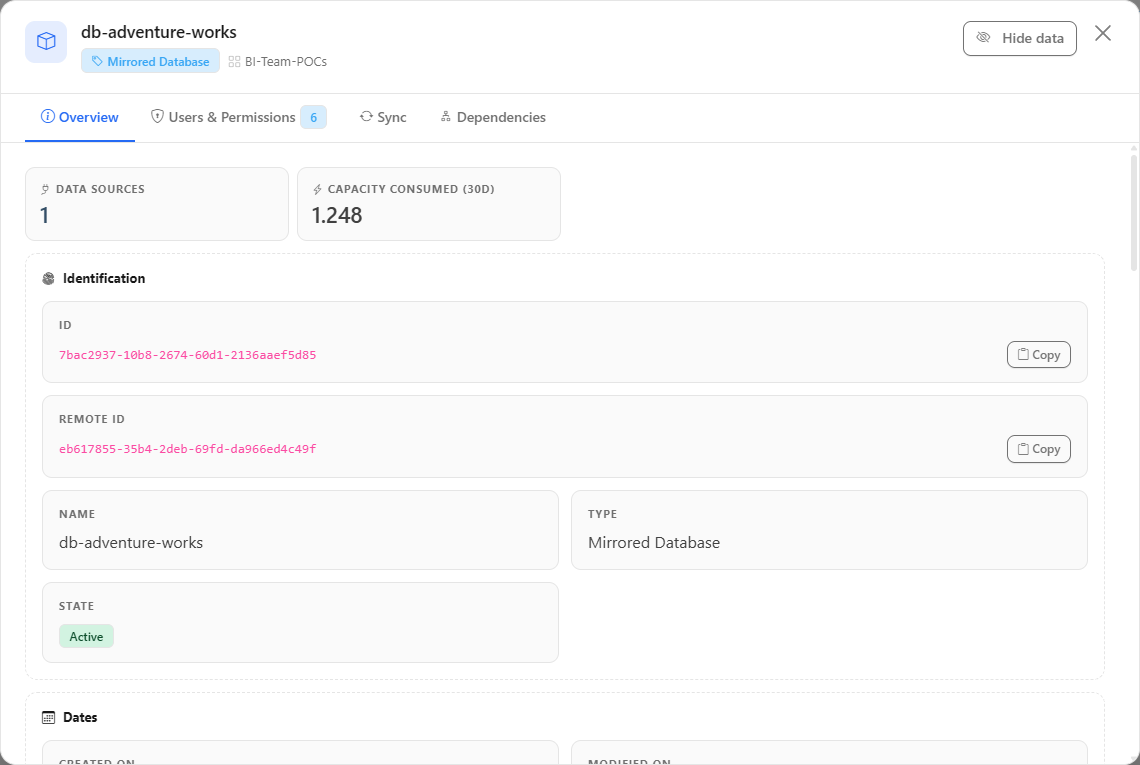
**What it is:** the first tab of the details modal, with the database's record data.

**What it is for:** checking the identifier and authorship of the database, for example, to locate it in Fabric or open a support ticket.

<figure><picture><source srcset="/files/jiuVXSAbBlg1LwfBBFW2" media="(prefers-color-scheme: dark)"><img src="https://3938213054-files.gitbook.io/~/files/v0/b/gitbook-x-prod.appspot.com/o/spaces%2FH2bFRBmIfyK3kwVKbldl%2Fuploads%2Fgit-blob-81ce6549927518a4da6de03e6f4754c7624477fa%2Fpm-governanca-fabric-mirroring-modal-visao-geral-en.png?alt=media" alt="Details modal of a mirrored database on the Overview tab"></picture><figcaption><p>Overview tab</p></figcaption></figure>

**How to use:**

1. Click the database row (or **⋮** › **Open details**).
2. Check **ID**, **Name**, **Type** (*Mirrored Database*), **State**, **Workspace**, **Created at**, **Modified at**, **Created by**, **Modified by** and, when present, **Tags**.
3. To copy the identifier, click **Copy** next to the **ID**; the button changes to **Copied!**.
4. Use the tabs at the top to navigate and the **X** (or a click outside the modal) to close.

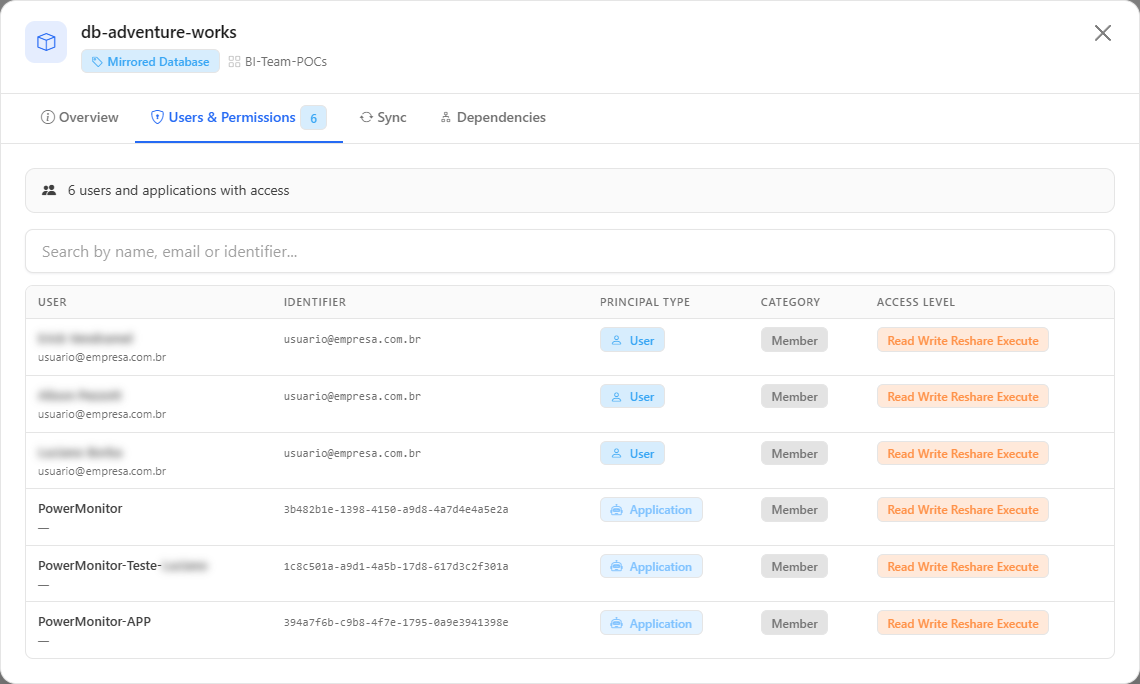
### Details modal: Users & Permissions

**What it is:** the tab that lists users, groups and applications with access to the mirrored database.

**What it is for:** auditing who can read or change the database, including external guests.

<figure><picture><source srcset="/files/9SHjOM5A4sEVkzpZGH5t" media="(prefers-color-scheme: dark)"><img src="https://3938213054-files.gitbook.io/~/files/v0/b/gitbook-x-prod.appspot.com/o/spaces%2FH2bFRBmIfyK3kwVKbldl%2Fuploads%2Fgit-blob-1bb5f395c420d2fb4cd158b4c848a975159771f5%2Fpm-governanca-fabric-mirroring-modal-usuarios-en.png?alt=media" alt="Users &#x26; Permissions tab of the modal of a mirrored database"></picture><figcaption><p>Users &#x26; Permissions tab</p></figcaption></figure>

**How to use:**

1. In the database's **⋮** menu, choose **Open details › Users & Permissions** (or open the modal and click the tab).
2. See at the top the total number of users and applications with access.
3. Use the **Search by name, email or identifier...** box to locate someone.
4. Check the **User**, **Identifier**, **Principal Type** (**User**, **Group** or **Application**), **Category** (**Member** or **Guest/External**, the latter highlighted in yellow) and **Access Level** columns.

**How it works:** the **Access Level** badge uses red for administration or owner access, yellow for write and blue for read.

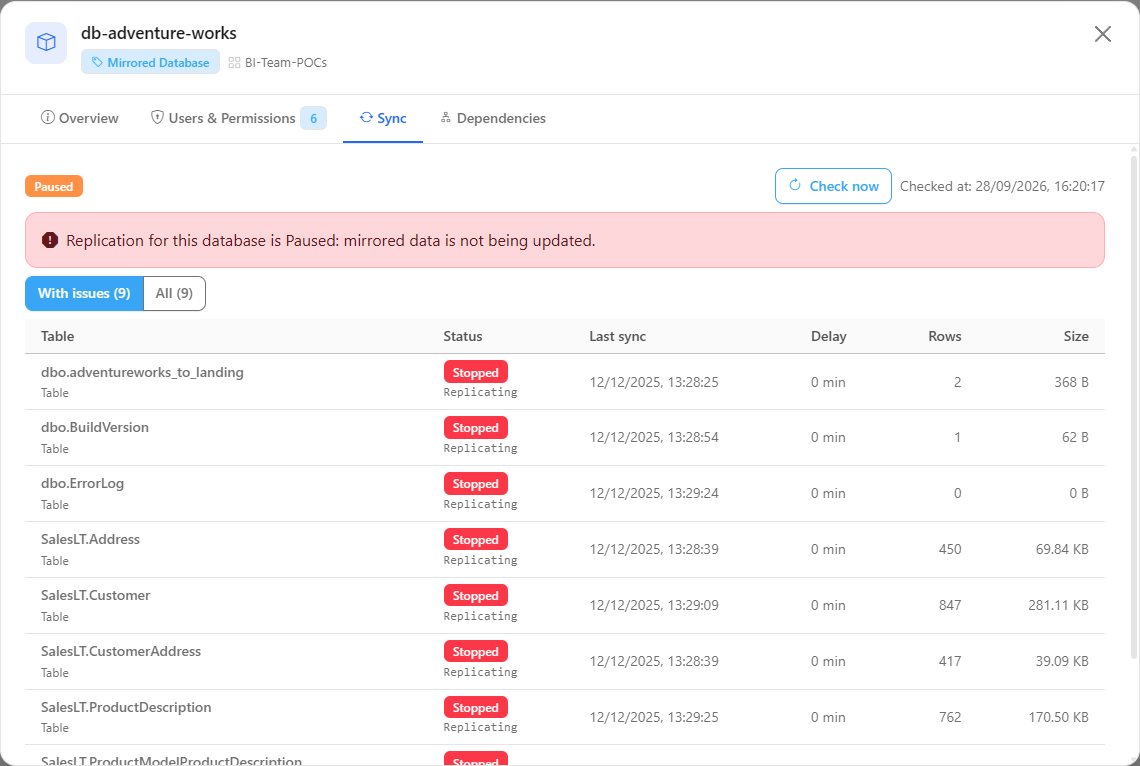
### Details modal: Sync

**What it is:** the tab that queries Fabric **live** and shows the replication status of the database, table by table.

**What it is for:** knowing, at that moment, whether the database is replicating and which tables are late, stopped or failing, without having to configure monitoring first.

<figure><picture><source srcset="/files/vm5qqidcRI7Qfqq19WbK" media="(prefers-color-scheme: dark)"><img src="https://3938213054-files.gitbook.io/~/files/v0/b/gitbook-x-prod.appspot.com/o/spaces%2FH2bFRBmIfyK3kwVKbldl%2Fuploads%2Fgit-blob-179d763a75f7281c49379cc882503537c6dabc9f%2Fpm-governanca-fabric-mirroring-modal-sincronismo-en.png?alt=media" alt="Sync tab of the modal of a mirrored database with the list of tables, status, last sync and delay"></picture><figcaption><p>Sync status queried live in Fabric</p></figcaption></figure>

**How to use:**

{% stepper %}
{% step %}

#### Open the Sync tab

Open the database details and click the **Sync** tab. While Fabric is being queried, the tab shows "Querying Fabric...".
{% endstep %}

{% step %}

#### Read the database status

At the top, the badge shows the replication state of the database (for example, **Running**, in green; **Paused**, in yellow; **Stopped**, in red), and **Checked at** shows the time of the reading. If replication of the entire database is not running, an alert states "Replication for this database is *status*: mirrored data is not being updated.".
{% endstep %}

{% step %}

#### Choose the list scope

Keep **With issues (*****N*****)** (default) to see only the Late, Failed, Stopped or Error tables, or click **All (*****N*****)** to see all tables.
{% endstep %}

{% step %}

#### Analyze each table

Check the list columns (described below). Hover over the **Delay** to see how it was measured.
{% endstep %}

{% step %}

#### Query again

Click **Check now** to repeat the reading. If the new query fails, the last reading remains on the screen with the warning "Refresh failed. Showing the last reading.".
{% endstep %}
{% endstepper %}

| Column        | Description                                                                                                                                                                                                       |
| ------------- | ----------------------------------------------------------------------------------------------------------------------------------------------------------------------------------------------------------------- |
| **Table**     | Name of the mirrored table (with the source schema).                                                                                                                                                              |
| **Status**    | **OK** (green), **Late** (yellow), **Failed**, **Stopped** or **Error** (red), **Initial load** (blue) or **Unknown**. When available, the original Fabric status and the error message appear below.             |
| **Last sync** | Last processing of the table.                                                                                                                                                                                     |
| **Delay**     | Replica delay. When Fabric reports the actual replication latency, it is used; otherwise, the delay is measured from the table's last processing (indicated by an information icon and explained in the tooltip). |
| **Rows**      | Replicated rows.                                                                                                                                                                                                  |
| **Size**      | Replicated volume.                                                                                                                                                                                                |

**How it works:**

* The query is made when the tab opens and on each click of **Check now**; nothing is saved or alerted from this screen.
* The query uses the organization's Service Principal, which must have access to the database's workspace in Fabric. If Fabric rejects the query (permission, token), the tab shows the returned error message.
* If the query fails without any previous reading, the tab shows "Could not query the sync status for this mirrored database." with **Try again**.
* "With issues" groups the **Late**, **Failed**, **Stopped** and **Error** tables. If there are none, the list shows "No table with issues.".

{% hint style="info" %}
If there is no monitor configured for the database, the tab warns that the delay classification uses the **product's default limit: 30 minutes**. Create a monitor in *Monitoring › Fabric Mirroring* to define your own limit and receive e-mail alerts.
{% endhint %}

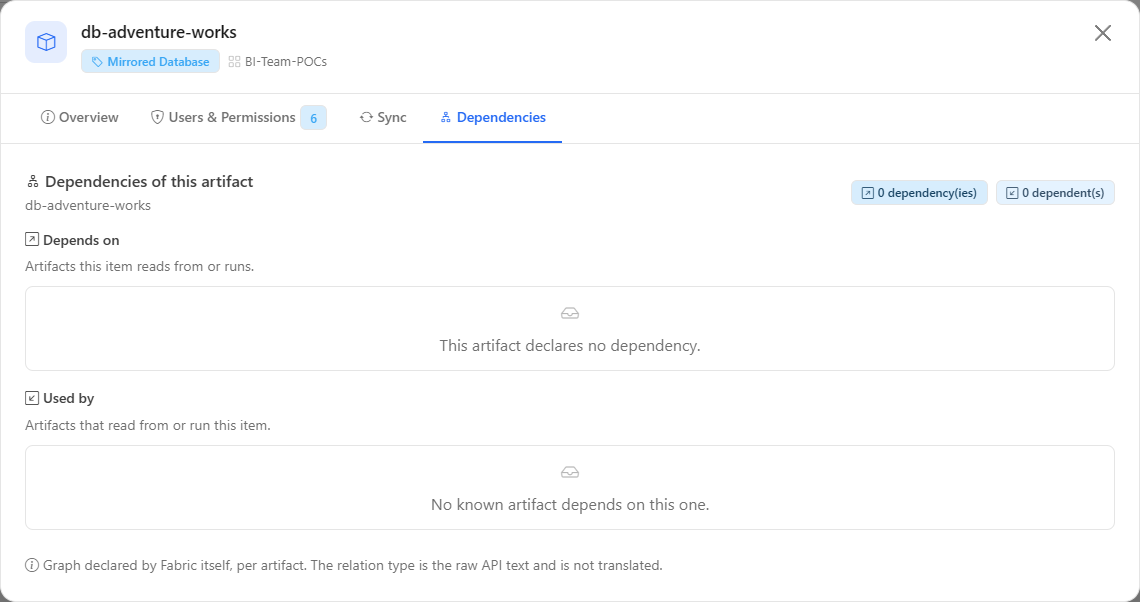
### Details modal: Dependencies

**What it is:** the tab with the database's dependency graph, declared by Fabric itself.

**What it is for:** knowing which artifacts read the mirrored database before pausing, changing or removing it.

<figure><picture><source srcset="/files/xi4EIbARwSDQ7pFO2Ggh" media="(prefers-color-scheme: dark)"><img src="https://3938213054-files.gitbook.io/~/files/v0/b/gitbook-x-prod.appspot.com/o/spaces%2FH2bFRBmIfyK3kwVKbldl%2Fuploads%2Fgit-blob-93def0d059a36fc1483be37aec990813b82969fb%2Fpm-governanca-fabric-mirroring-modal-dependencias-en.png?alt=media" alt="Dependencies tab of the modal of a mirrored database, with the Depends on and Used by sections"></picture><figcaption><p>Dependencies tab</p></figcaption></figure>

**How to use:**

1. Open the database details and click the **Dependencies** tab.
2. At the top, see the totals of dependencies, dependents and items outside the monitored scope.
3. In the **Used by** section, see the artifacts that read or run this database; in **Depends on**, what the database reads. Each row shows **Artifact**, **Type**, **Relation type** and **Identifier**.

**How it works:** items from unmonitored workspaces, from types not collected or not yet scanned appear as "Unidentified artifact": the dependency is real, only the name is not available. If the database does not declare any dependency, the tab displays "There is no dependency graph for this artifact.". See also [The details modal](/en/power-monitor/governanca/relatorios.md#the-details-modal).

## Rules and behavior

* The **inventory** comes from the inventory scans; the **sync status** is queried live, each time the tab is opened or *Check now* is clicked. Nothing is saved or alerted from this screen.
* Only databases from monitored workspaces appear; databases deleted in the tenant are removed from the list.
* **Workspace scope:** if your user has visibility restricted to some workspaces, you will see only their databases.
* The live query uses the Power Monitor Service Principal, which must have access to the database's workspace.
* Dates are displayed in your browser's time zone.
* The other [common rules of the lists](/en/power-monitor/governanca/relatorios.md#rules-that-apply-to-all-lists) apply.

## Step by step

### How to find late tables in a database

{% stepper %}
{% step %}

#### Locate the database

In *Governance › Data and Engineering › Fabric Mirroring*, type part of the name in **Search by name** or select the workspace in **Search by workspace**.
{% endstep %}

{% step %}

#### Open the sync status

Click the database row and, in the modal, the **Sync** tab.
{% endstep %}

{% step %}

#### Read the tables with issues

With **With issues (*****N*****)** selected, see the late, stopped or failed tables, with the **Delay** and the **Last sync** of each one.
{% endstep %}
{% endstepper %}

### How to configure delay alerts for a database

This screen does not save or send alerts. To be notified by e-mail when a database falls behind:

{% hint style="info" %}
Creating, editing or deleting a monitor is exclusive to the **Administrator** profile.
{% endhint %}

1. Click **Monitoring**, at the top of the screen.
2. You are taken to *Monitoring › Fabric Mirroring*, where you create the database monitor with the maximum delay per table and the recipients. The complete step by step is in [Monitoring › Fabric Mirroring](/en/power-monitor/monitoramento/fabric-mirroring.md).
3. From then on, the **Sync** tab of this screen classifies the delay by the configured limit, instead of the default limit of 30 minutes.

## Frequently asked questions

<details>

<summary>What is the difference between this screen and Monitoring › Fabric Mirroring?</summary>

This screen is inventory + on-demand query. The Monitoring screen periodically checks the databases you register, applies the configured maximum delay and sends e-mail alerts.

</details>

<details>

<summary>The Sync tab shows "No table with issues". Is everything fine?</summary>

Yes, within the considered limit (that of the configured monitor or, in its absence, 30 minutes). Click **All** to see all tables and their delays.

</details>

<details>

<summary>The Sync tab shows an error message instead of the tables.</summary>

Fabric rejected the query, usually because the organization's Service Principal does not have access to the database's workspace. Grant the access in Fabric and click **Check now**.

</details>

## Related pages

* [Monitoring › Fabric Mirroring](/en/power-monitor/monitoramento/fabric-mirroring.md)
* [Storage](/en/power-monitor/governanca/armazenamento.md)
* [Real Time](/en/power-monitor/governanca/dados-e-engenharia/tempo-real.md)
* [Workspaces](/en/power-monitor/governanca/workspaces.md)
* [Mapping › Inventory](/en/power-monitor/mapeamento/inventarios.md)


---

# Agent Instructions
This documentation is published with GitBook. GitBook is the documentation platform designed so that both humans and AI agents can read, navigate, and reason over technical content effectively. Learn more at gitbook.com.

## Querying This Documentation
If you need additional information that is not directly available in this page, you can query the documentation by asking a question.

Perform an HTTP GET request on the following URL with the `ask` and `goal` query parameters:

```
GET https://docs.powermonitor.com.br/en/power-monitor/governanca/dados-e-engenharia/fabric-mirroring.md?ask=<question>&goal=<user_goal>
```

`ask` is the immediate question: it should be specific, self-contained, and written in natural language.
`goal` is what the user is ultimately trying to achieve, the reason they need the answer. Sharing it helps GitBook give you a better, more relevant answer. A goal is most helpful when it describes the outcome the user wants rather than restating the question. For example, with `ask=how do I create an API token`, a goal like `automate deployments from our CI pipeline` lets GitBook tailor the answer to that use case.

The response will contain a direct answer to the question and relevant excerpts and sources from the documentation.

Use this mechanism when the answer is not explicitly present in the current page, you need clarification or additional context, or you want to retrieve related documentation sections.