> For the complete documentation index, see [llms.txt](https://docs.powermonitor.com.br/llms.txt). Markdown versions of documentation pages are available by appending `.md` to page URLs; this page is available as [Markdown](https://docs.powermonitor.com.br/en/power-monitor/governanca/dados-e-engenharia/ontologias.md).
# Ontologies
Structure of the Microsoft Fabric ontologies (Fabric IQ): entities, relationships, data bindings, rules, metrics and the problems found, with the notice about the retirement of the old experience on 0
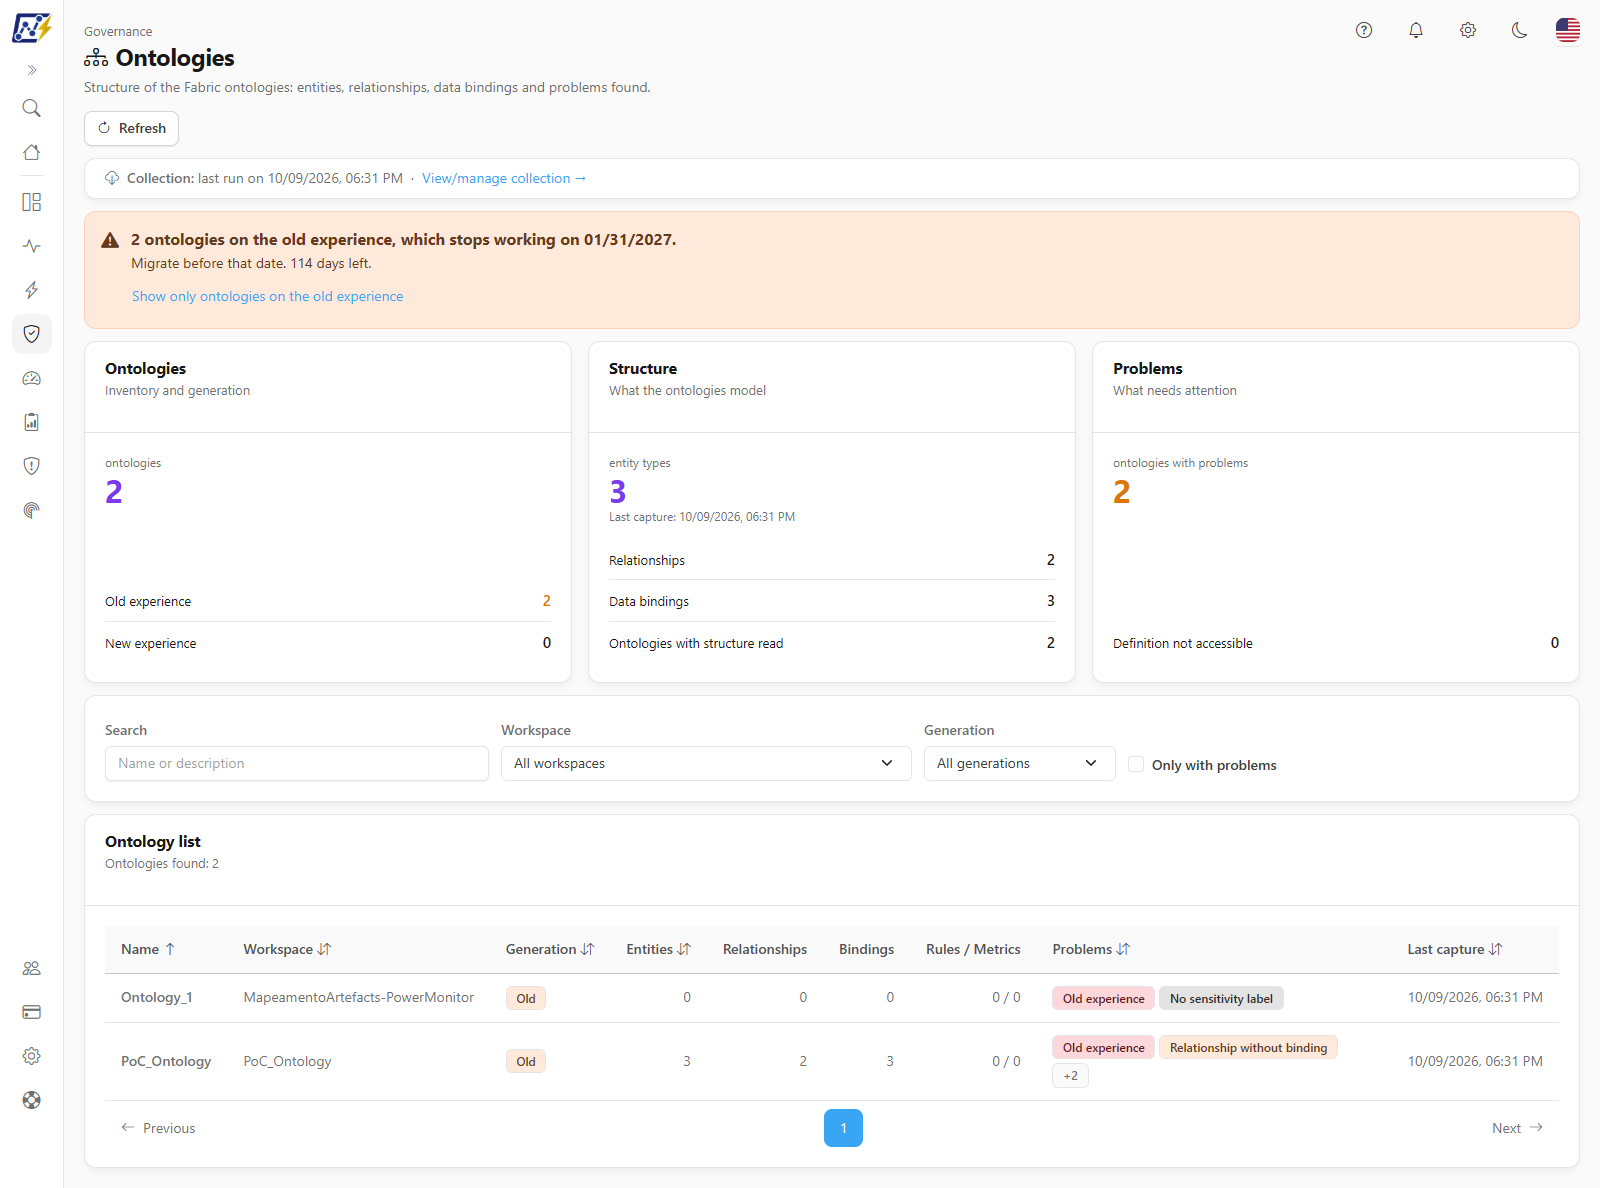
The **Ontologies** screen shows what each Microsoft Fabric ontology models: the entity types, the properties, the relationships between entities, the bindings to the tables that bring the data, the rules and the metrics. Power Monitor reads the definition of each ontology once a day and points out the problems that keep the ontology from working well, such as entities without a data binding, bindings that point to items that no longer exist and ontologies still on the old experience, which stops working on **01/31/2027**.
**How to access:** menu *Governance › Data and Engineering › Ontologies*. The screen is read-only and is available to the **Administrator** and **Member** profiles; for the **Audit** profile it is blocked by default. The workspace scope and the page blocking configured for your user in [Users](/en/power-monitor/usuarios.md) also apply here.
Governance › Data and Engineering › Ontologies
## What it is for
* **Plan the migration from the old experience:** know how many ontologies still use the old experience (generation 1) and how many days are left before it stops working.
* **Make sure the ontology shows data:** find entities and relationships not bound to any table, which appear empty to whoever queries the ontology.
* **Detect broken bindings:** find entities bound to a Lakehouse, Warehouse or other item that was deleted or moved.
* **Improve quality for people and AI agents:** find entities without a description and ontologies without a sensitivity label.
* **Understand the model without opening Fabric:** check the entities, properties, relationships, rules and metrics of each ontology in one place.
## Screen overview
From top to bottom, the screen has:
1. **Header**, with the **Refresh** button and the **Collection** line, which shows the last run of the collection and, for administrators, the **View/manage collection →** link, which leads to [Mapping › Ontologies](/en/power-monitor/mapeamento/ontologias.md).
2. **Old experience notice**, when there are generation 1 ontologies.
3. **Indicator cards**: **Ontologies**, **Structure** and **Problems**.
4. **Filters**.
5. **Ontology list**, with the paginated table.
Clicking a row opens the [detail modal](#ontology-detail-modal).
## Features
### Old experience notice
**What it is:** the orange strip at the top, with the title *N ontologies on the old experience, which stops working on 01/31/2027.*, the text **Migrate before that date.**, the countdown (*N days left.*) and the **Show only ontologies on the old experience** link.
**What it is for:** reminding you of Microsoft's deadline to migrate ontologies from the old experience (generation 1) to the new experience (generation 2). After 01/31/2027, the ontologies left on the old experience stop working.
**How to use:** click **Show only ontologies on the old experience** to apply the **Generation** filter and see only the ontologies that need to be migrated.
**How it works:**
* The notice only appears when there is at least one ontology on the old experience in the workspaces you can see.
* After the date, the text says that the old experience has stopped working and asks you to migrate the remaining ontologies.
### Indicator cards
**What it is:** three cards right below the notice.
**What it is for:** getting at a glance the size of the inventory, what the ontologies model and how many need attention.
| Card | Main value | Card rows |
| ------------------------------------------- | ------------------------------------------------- | -------------------------------------------------------------------------------------- |
| **Ontologies** (*Inventory and generation*) | Total **ontologies** | **Old experience**, **New experience** and, when there are any, **Unknown generation** |
| **Structure** (*What the ontologies model*) | Total **entity types**, with *Last capture: date* | **Relationships**, **Data bindings** and **Ontologies with structure read** |
| **Problems** (*What needs attention*) | **ontologies with problems** | **Definition not accessible** |
**How it works:** the cards consider all ontologies in the monitored workspaces you can see, regardless of the list filters. The generation shows as **Unknown generation** while the ontology has not been read by the collection yet.
### Filters
**What it is:** the filters card above the list, with **Search** (*Name or description*), **Workspace** (**All workspaces**), **Generation** (**All generations**, **Old**, **New** or **Unknown**) and the **Only with problems** checkbox. With any filter active, the **Clear filters** button appears.
**What it is for:** focusing, for example, on the ontologies of a production workspace or only on those with problems.
**How to use:**
1. Type part of the name or description in **Search**, or choose a **Workspace** and a **Generation**.
2. Check **Only with problems** to hide the ontologies with no problem found.
3. Click **Clear filters** to go back to the full list.
**How it works:** the filters add up, the search is case-insensitive and any change takes the list back to the first page.
### Ontology list
**What it is:** the **Ontology list** table (*Ontologies found: N*), with 25 ontologies per page.
**What it is for:** comparing the ontologies and choosing which one to open.
| Column | Description |
| ------------------- | ----------------------------------------------------------------------------------------------------------------------- |
| **Name** | Name of the ontology and, below it, the description, when there is one |
| **Workspace** | Workspace where the ontology is |
| **Generation** | **Old** (old experience), **New** (new experience) or **Unknown** badge |
| **Entities** | Number of entity types |
| **Relationships** | Number of relationships between entities |
| **Bindings** | Number of data bindings (links between entities and tables) |
| **Rules / Metrics** | Number of rules and metrics |
| **Problems** | Up to two problem badges, plus the **+N** badge when there are others |
| **Last capture** | Date of the last read of the structure and, when the structure was not read, the status badge (hover to see the reason) |
**How to use:** click the title of a sortable column (**Name**, **Workspace**, **Generation**, **Entities**, **Problems** or **Last capture**) to sort; click again to reverse. The default sort is by **Name**. Click a row to open the details.
**Read status (badge in the Last capture column):**
| Badge | Meaning |
| --------------------- | ------------------------------------------------------------------------------ |
| **Not collected yet** | The ontology is in the inventory, but its structure has not been collected yet |
| **No access** | The Service Principal has no access to the definition of this ontology |
| **Encrypted label** | The encrypted sensitivity label prevents reading the definition |
| **Not supported** | Fabric does not allow reading the definition of this item |
| **Read failure** | The definition was read, but its structure could not be interpreted |
| **Collection failed** | The collection of this ontology failed; it is retried in the next run |
When the structure was not read, the count columns show "-".
### Problems found
Each ontology can have one or more of the problems below. They appear as badges in the list and with the full explanation on the **Problems** tab of the details.
| Problem | When it appears |
| -------------------------------- | ----------------------------------------------------------------------------------------------- |
| **Old experience** | The ontology uses the old experience, which stops working on 01/31/2027 |
| **Entity without binding** | An entity type is not bound to any table, so it shows no records |
| **Relationship without binding** | A relationship has no binding table, so it does not link records between the entities |
| **Broken binding** | A binding points to an item that no longer exists in the inventory (deleted or moved) |
| **Entity without description** | An entity type has no description, which makes it harder for people and AI agents to understand |
| **No sensitivity label** | The ontology has no sensitivity label |
| **Definition not accessible** | The definition could not be read (no access, encrypted label or unsupported item) |
| **Unreadable definition** | The definition was read, but its structure could not be interpreted |
### Ontology detail modal
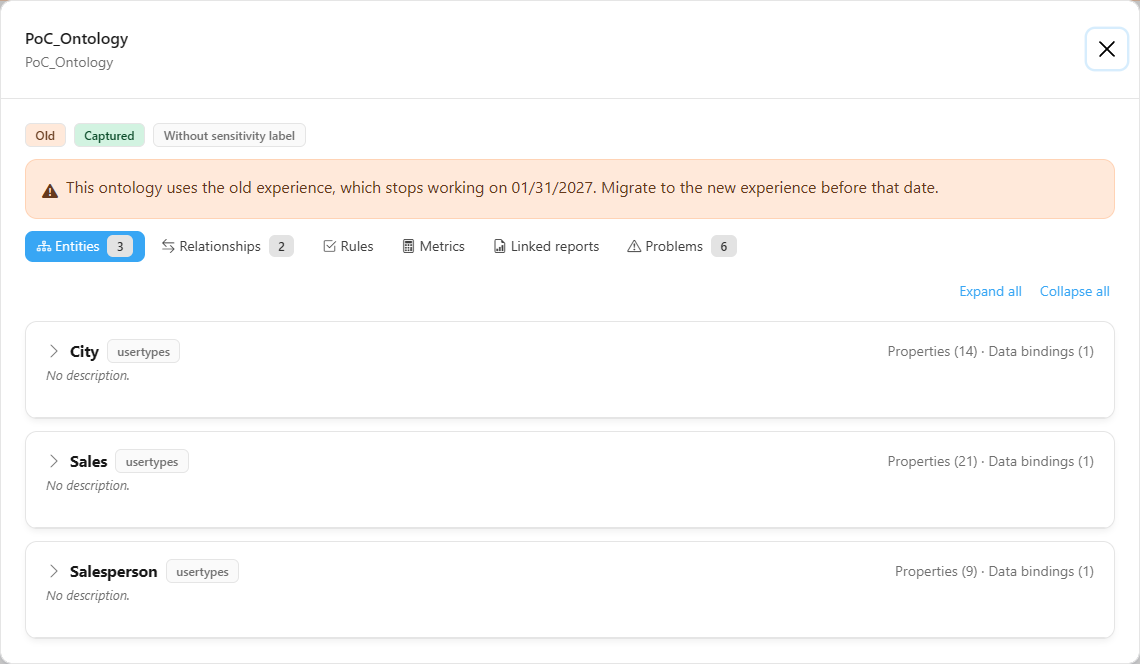
**What it is:** the modal opened by clicking the row, with the ontology name and the workspace in the header, the **generation**, read status and label badges (**With sensitivity label** or **Without sensitivity label**), the description and the **Entities**, **Relationships**, **Rules**, **Metrics**, **Linked reports** and **Problems** tabs, each with its count.
**What it is for:** understanding the ontology's model and locating exactly the entity, property or binding that needs fixing.
Detail modal with the entities collapsed
**How to use:**
{% stepper %}
{% step %}
#### Open the details
Click the ontology's row in the **Ontology list**. On the old experience, a notice at the top of the modal recalls the retirement date; when the structure was not read, a notice shows the status and the reason.
{% endstep %}
{% step %}
#### Go through the entities
On the **Entities** tab, each entity type appears **collapsed**, with its name and the property and binding counts in the header. Click an entity's header to expand it, or use **Expand all** and **Collapse all**.
{% endstep %}
{% step %}
#### Check the bindings
In the expanded entity, see the description (or **No description.**), **Synonyms**, **Key**, **Display name**, **Inherits from**, the **Properties** table and the **Data bindings** table. A binding that points to an item that no longer exists gets the **Broken** badge; an entity with no binding shows **No data binding. The entity shows no records.**
{% endstep %}
{% step %}
#### Review the other tabs
Use **Relationships**, **Rules**, **Metrics**, **Linked reports** and **Problems** to complete the analysis.
{% endstep %}
{% endstepper %}
**How each tab works:**
| Tab | What it shows |
| ------------------ | ----------------------------------------------------------------------------------------------------------------------------------------------------------------------------------------------------------------------------------------------------------------------------------------------------------------------------------------- |
| **Entities** | Collapsible entity types. The **Properties** table has **Property**, **Type**, **Bound column** and **Description** (time series properties get the **Time series** badge); the **Data bindings** table has **Source item**, **Workspace**, **Table** and **Binding type**. An entity with no binding gets the **No data binding** badge. |
| **Relationships** | **Relationship**, **Source and target** and **Binding table**, with the **Bound** or **No binding** badge |
| **Rules** | The statement of each rule (or **No statement.**) and the entities involved |
| **Metrics** | The metrics defined in the ontology |
| **Linked reports** | The items linked to the ontology, with **Item** and **Type** |
| **Problems** | The list of problems, with the explanation of each one, or **No problems found.** |
* Entities **always start collapsed** and, when you open another ontology, they are collapsed again. This keeps large ontologies from turning into an endless page.
* A bound item that is in a workspace you cannot see appears without a name (**Unknown item**), so as not to reveal what is outside your scope.
## Rules and behavior
* **Data source:** the ontology list comes from the [Inventory Scan](/en/power-monitor/mapeamento/inventarios.md); the structure comes from the daily collection in [Mapping › Ontologies](/en/power-monitor/mapeamento/ontologias.md), which reads the definition of each ontology through the Fabric API. A new ontology appears as **Not collected yet** until the next collection.
* **Monitored workspaces only:** only the ontologies of the workspaces the organization chose to monitor are included, without personal workspaces.
* **Service Principal permission:** to list the ontologies and know their generation, the Service Principal must be at least a **Viewer** of the workspace; to read the definition (structure), it needs **read and write** on the item (**Contributor** or higher in the workspace). Since Power Monitor recommends the Service Principal as an administrator of the workspaces, usually nothing needs to be done. See [Add Service Principal to Workspaces](/en/power-monitor/configuracoes/permissoes-adicionais.md#add-service-principal-to-workspaces).
* **Fabric restrictions:** ontologies with an encrypted sensitivity label and items whose definition Fabric does not allow reading stay without a structure (**Encrypted label** or **Not supported**). A failed read keeps the last known structure.
* **Old and new experience:** Power Monitor reads both generations. On the new experience, Fabric rarely reports the source item of the binding, so the **Broken binding** problem is, in practice, flagged on ontologies of the old experience.
* **Preview feature:** the Fabric ontology APIs are in preview and may change.
* **Read-only:** the screen does not change anything in Fabric; the migration and the fixes are done in Fabric itself.
## Frequently asked questions
The ontology appears as "Not collected yet". What do I do?
The ontology is already in the inventory, but the structure collection has not gone through it yet. Wait for the next daily collection or ask an administrator to use **Run now** in [Mapping › Ontologies](/en/power-monitor/mapeamento/ontologias.md).
The ontology appears as "No access".
The Service Principal could not read the definition. Check that it is a **Contributor** or higher (preferably an administrator) in the ontology's workspace and wait for the next collection.
Why does an entity appear as "Entity without binding"?
The entity type was created, but it was not bound to any table. Without a binding, the entity shows no records to whoever queries the ontology. Bind it to a table in Fabric.
What happens to the ontologies on the old experience after 01/31/2027?
They stop working. Migrate each one to the new experience before that date; use the **Show only ontologies on the old experience** link in the notice to build the list.
Does this screen replace the Ontology tab of Data Science?
No. [Data Science](/en/power-monitor/governanca/dados-e-engenharia/ciencia-de-dados.md) still lists the ontologies along with the other AI artifacts, with creation, changes and access. This screen shows the structure and the problems of each ontology.
## Related pages
* [Mapping › Ontologies](/en/power-monitor/mapeamento/ontologias.md)
* [Data Science](/en/power-monitor/governanca/dados-e-engenharia/ciencia-de-dados.md)
* [Data and Engineering](/en/power-monitor/governanca/dados-e-engenharia.md)
* [Deleted Artifacts](/en/power-monitor/governanca/operacao/artefatos-excluidos.md)
* [Settings › Monitoring](/en/power-monitor/configuracoes/monitoramento.md#scans-and-collections)
---
# Agent Instructions
This documentation is published with GitBook. GitBook is the documentation platform designed so that both humans and AI agents can read, navigate, and reason over technical content effectively. Learn more at gitbook.com.
## Querying This Documentation
If you need additional information that is not directly available in this page, you can query the documentation by asking a question.
Perform an HTTP GET request on the following URL with the `ask` and `goal` query parameters:
```
GET https://docs.powermonitor.com.br/en/power-monitor/governanca/dados-e-engenharia/ontologias.md?ask=&goal=
```
`ask` is the immediate question: it should be specific, self-contained, and written in natural language.
`goal` is what the user is ultimately trying to achieve, the reason they need the answer. Sharing it helps GitBook give you a better, more relevant answer. A goal is most helpful when it describes the outcome the user wants rather than restating the question. For example, with `ask=how do I create an API token`, a goal like `automate deployments from our CI pipeline` lets GitBook tailor the answer to that use case.
The response will contain a direct answer to the question and relevant excerpts and sources from the documentation.
Use this mechanism when the answer is not explicitly present in the current page, you need clarification or additional context, or you want to retrieve related documentation sections.