> For the complete documentation index, see [llms.txt](https://docs.powermonitor.com.br/llms.txt). Markdown versions of documentation pages are available by appending `.md` to page URLs; this page is available as [Markdown](https://docs.powermonitor.com.br/en/power-monitor/governanca/dados-e-engenharia/tempo-real.md).

# Real Time

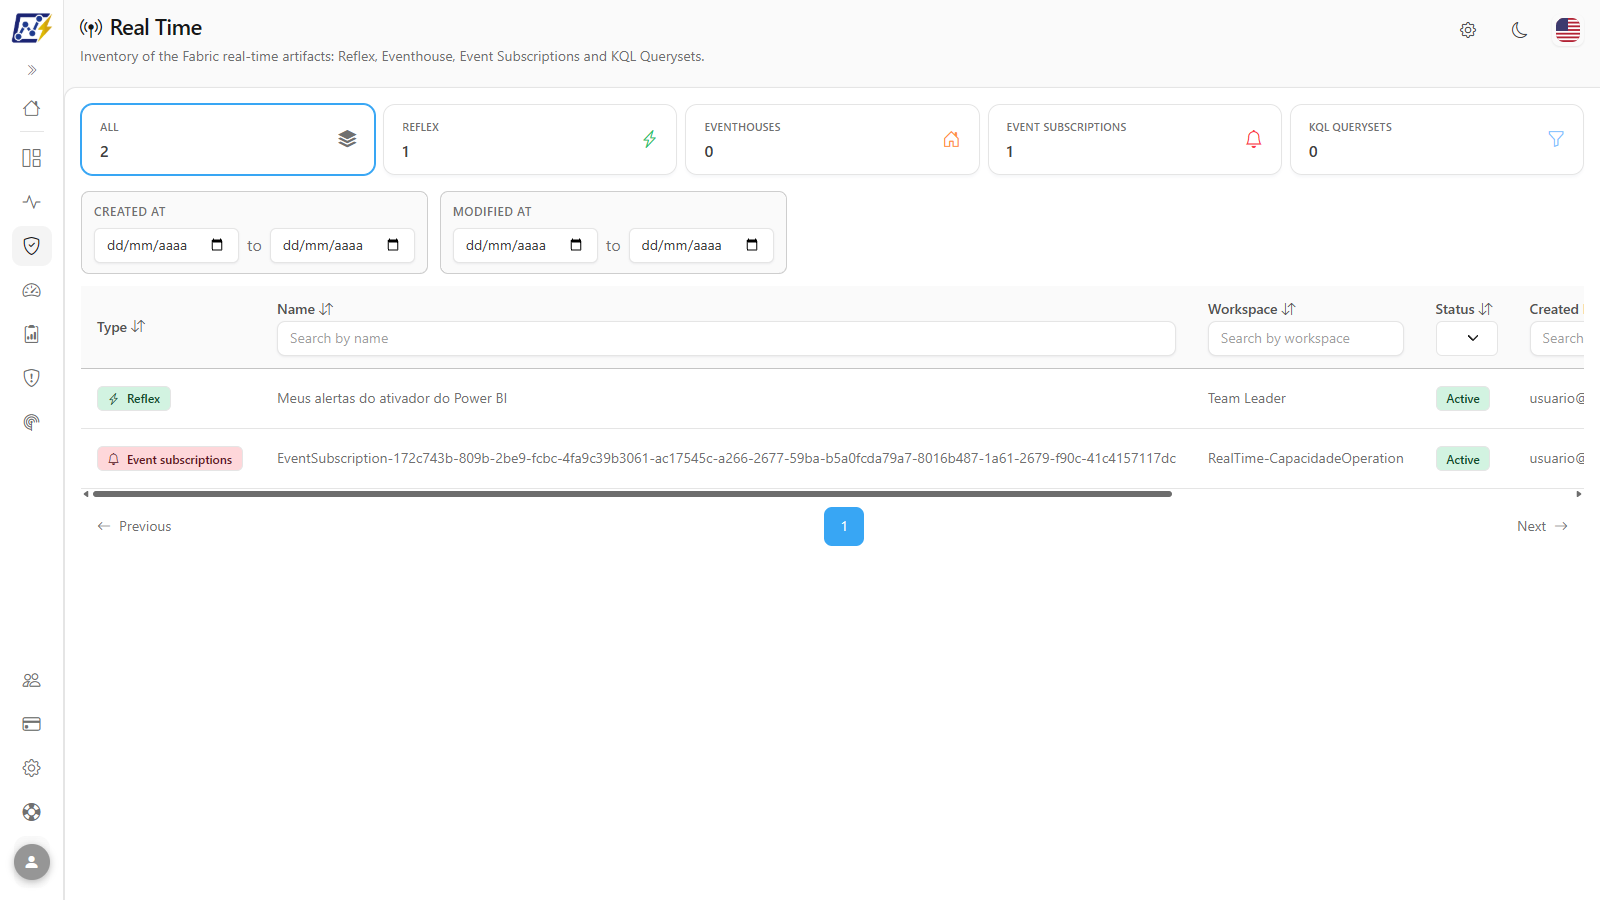
Inventory of the Fabric Real-Time Intelligence artifacts, Reflex (Activator), Eventhouses, Event Subscriptions and KQL Querysets, with cards by type, a unified table and a details modal.

The **Real Time** screen brings together the Microsoft Fabric *Real-Time Intelligence* artifacts in the monitored workspaces in a single table, with cards by type and the status, author and dates of each item.

**How to access:** menu *Governance › Data and Engineering › Real Time*. The screen is read-only and is available to all user profiles.

<figure><picture><source srcset="/files/QpGMZZGG9ZIA2eKh92dc" media="(prefers-color-scheme: dark)"><img src="https://3938213054-files.gitbook.io/~/files/v0/b/gitbook-x-prod.appspot.com/o/spaces%2FH2bFRBmIfyK3kwVKbldl%2Fuploads%2Fgit-blob-437d23a967f36866b0868e0fc8270043104db327%2Fpm-governanca-tempo-real-en.png?alt=media" alt="Real Time screen with the All, Reflex, Eventhouses, Event Subscriptions and KQL Querysets cards and the unified table"></picture><figcaption><p>Governance › Data and Engineering › Real Time</p></figcaption></figure>

{% hint style="info" %}
KQL databases and Eventstreams are on the [Storage](/en/power-monitor/governanca/armazenamento.md) screen; real-time dashboards (Real-Time Dashboards) are in [KQL Dashboards](/en/power-monitor/governanca/relatorios/kql-dashboards.md).
{% endhint %}

## What it is for

* **Reconcile inventory and billing:** these four types are monitored items and count toward the Power Monitor item count. Here you see exactly which ones they are.
* **Find orphaned items:** find out who created the Activator alerts and the event subscriptions, items that "act on their own" and often end up without an owner when the author leaves the company.
* **Understand the chain:** see the dependencies of each artifact (for example, which Eventstream or KQL database a Reflex reads from).
* **Review access:** check, through the details modal, who has access to each artifact.

## Features

### Cards by artifact type

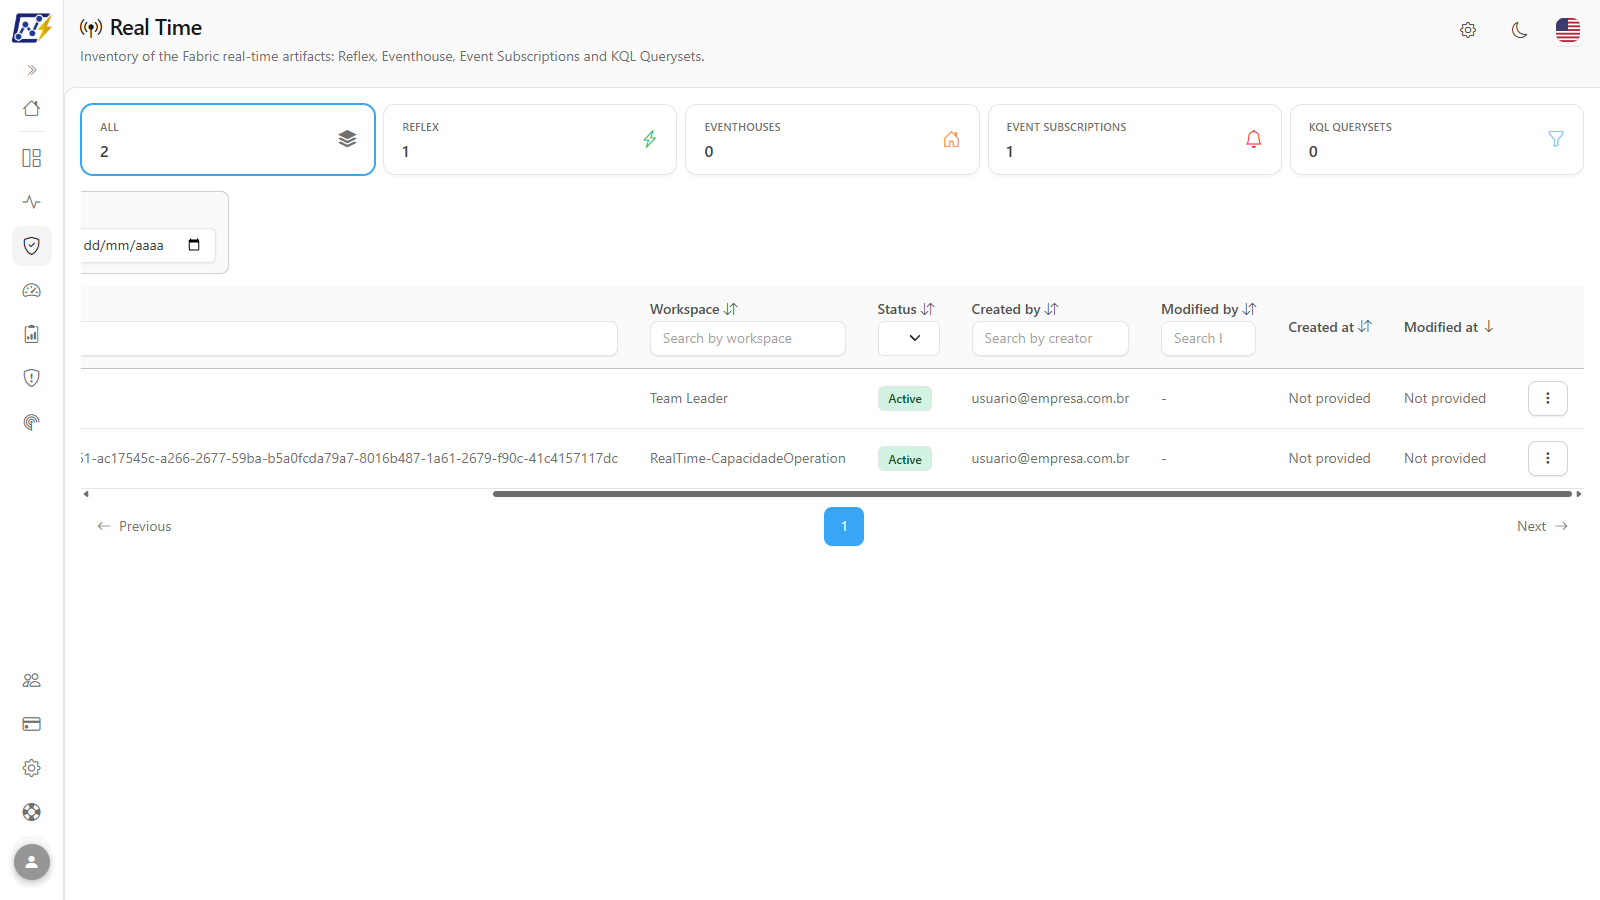
**What it is:** the strip of cards at the top of the screen, one per type, each with the number of items. Clicking a card filters the table to that type.

**What it is for:** see how many items of each type exist and focus on one type, for example, only the Activator Reflex items.

<figure><picture><source srcset="/files/M8ioVqOEl7HyBcl2hfvO" media="(prefers-color-scheme: dark)"><img src="https://3938213054-files.gitbook.io/~/files/v0/b/gitbook-x-prod.appspot.com/o/spaces%2FH2bFRBmIfyK3kwVKbldl%2Fuploads%2Fgit-blob-b6e072a21c8cbe482243ee57cfbb176a774fad96%2Fpm-governanca-tempo-real-cards-en.png?alt=media" alt="All, Reflex, Eventhouses, Event Subscriptions and KQL Querysets cards with the count of each type"></picture><figcaption><p>Cards by artifact type</p></figcaption></figure>

| Card                    | What it counts                                                                                        |
| ----------------------- | ----------------------------------------------------------------------------------------------------- |
| **All**                 | Total of the four types below                                                                         |
| **Reflex**              | *Activator* (Reflex) items, which trigger actions and alerts based on conditions in the data          |
| **Eventhouses**         | Containers of KQL databases for event and telemetry data                                              |
| **Event Subscriptions** | Fabric event subscriptions (*Event Subscriptions*), which route Fabric or Azure events to other items |
| **KQL Querysets**       | Sets of saved KQL queries                                                                             |

**How to use:**

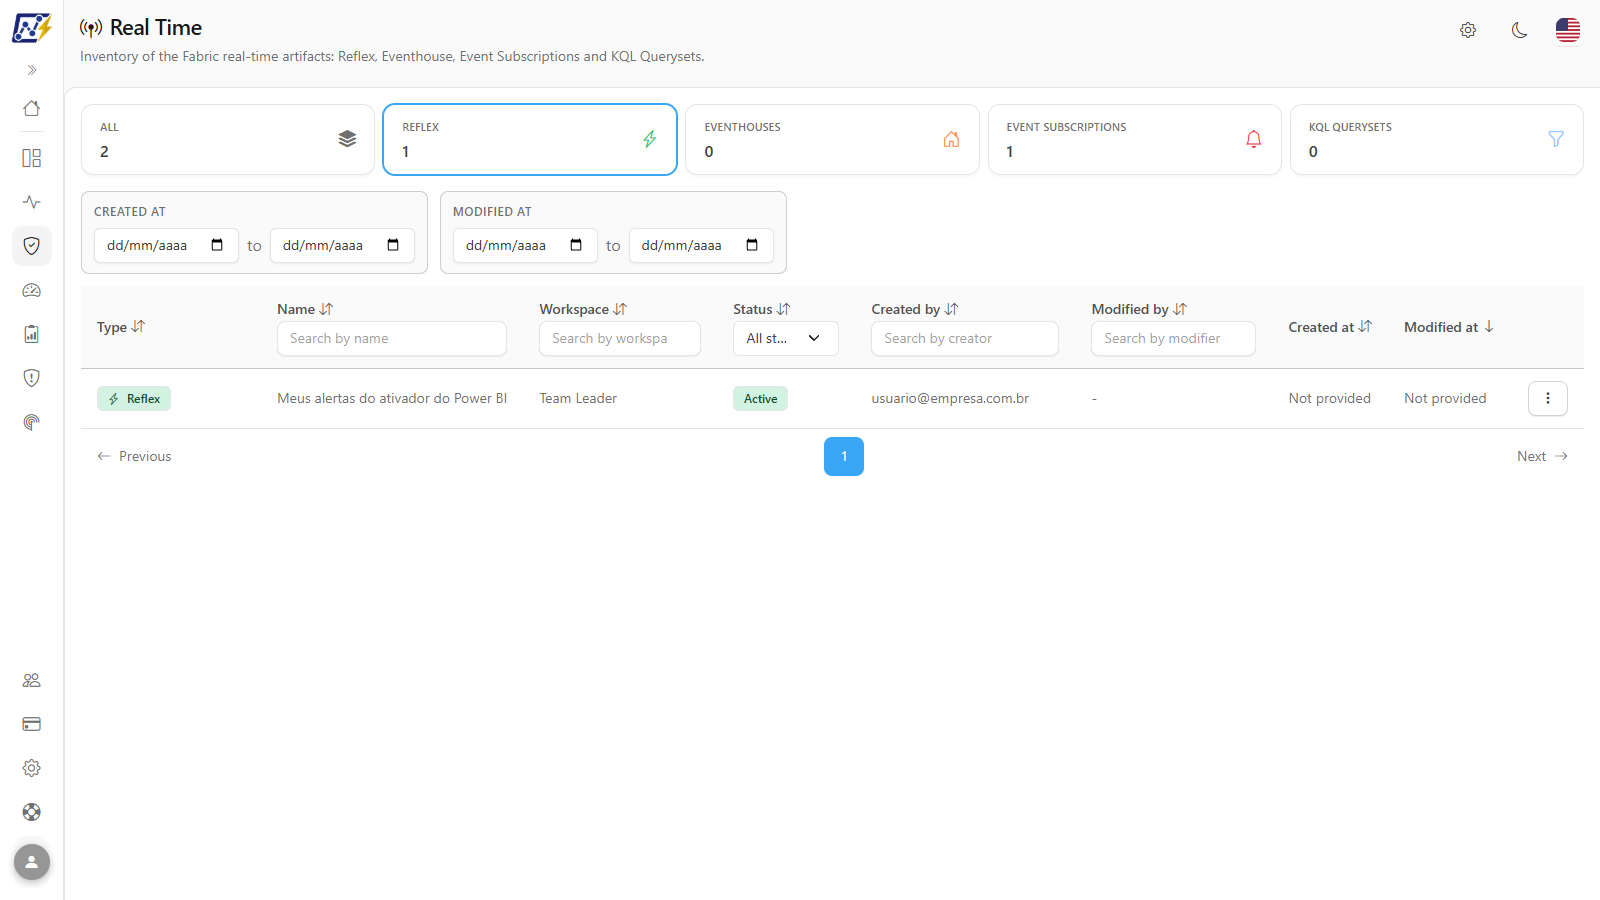
1. Click the card of the desired type (for example, **Reflex**).
2. The card is highlighted and the table shows only the items of that type, returning to the first page. Column filters already filled in remain in effect.
3. To return to the full list, click **All**.

<figure><picture><source srcset="/files/E4dRd1vQY76ScRmIsa0G" media="(prefers-color-scheme: dark)"><img src="https://3938213054-files.gitbook.io/~/files/v0/b/gitbook-x-prod.appspot.com/o/spaces%2FH2bFRBmIfyK3kwVKbldl%2Fuploads%2Fgit-blob-d6b15e266837f3d1210b16b40851b872e761fdc8%2Fpm-governanca-tempo-real-card-filtrado-en.png?alt=media" alt="Reflex card selected and table showing only Reflex items"></picture><figcaption><p>Table filtered by the Reflex card</p></figcaption></figure>

**How it works:** on this screen, the counters **respect the column filters**: the number on each card is always equal to what the table shows for that type with the current filters.

### Inventory table

**What it is:** a single table with the four artifact types, one item per row.

**What it is for:** have the complete real-time inventory in one place, with type, workspace, status and authorship.

| Column          | Description                                                  |
| --------------- | ------------------------------------------------------------ |
| **Type**        | Colored badge with the type's icon and name                  |
| **Name**        | Name of the artifact                                         |
| **Workspace**   | Workspace of the artifact                                    |
| **Status**      | **Active** (green), **Inactive** or **Unknown** (gray) badge |
| **Created by**  | Account that created the item                                |
| **Modified by** | Account of the last change                                   |
| **Created at**  | Creation date and time                                       |
| **Modified at** | Date and time of the last change                             |
| **⋮**           | Row actions menu                                             |

**How to use:**

1. Go through the list. Use **Previous**, **Next** or the page number, in the footer, to navigate (10 items per page).
2. Click anywhere on a row to open the details modal.

**How it works:**

* When Fabric does not provide a piece of data, the cell displays "-" (or "Not provided", in the date columns).
* If no item matches the filters, the table shows "No real-time artifact found.".
* The four types are loaded separately. If one of them fails, the screen shows "Could not load: *type*. The remaining types are still listed." with the **Retry** button, which queries the four types again; if the load succeeds, the notice disappears and the items return to the table.

### Text filters (Name, Workspace, Created by, Modified by)

**What it is:** search boxes right below the title of the **Name** (*Search by name*), **Workspace** (*Search by workspace*), **Created by** (*Search by creator*) and **Modified by** (*Search by modifier*) columns.

**What it is for:** find an artifact by name, list the items of a workspace or those created by a person.

**How to use:**

1. Type part of the text in the box of the desired column. In the **Workspace** column, you can type the workspace name or ID.
2. The table and the card counters are updated automatically, right after you stop typing.
3. Clear the text to remove the filter.

**How it works:** the search matches partial text and is case-insensitive. Filters in different columns add up and are kept when switching cards.

### Status filter

**What it is:** the **All statuses** list, below the **Status** column title.

**What it is for:** separate active items from inactive ones, for example, to find Activator alerts that are turned off.

<figure><picture><source srcset="/files/vifGfcwXZ11860v2Phqw" media="(prefers-color-scheme: dark)"><img src="https://3938213054-files.gitbook.io/~/files/v0/b/gitbook-x-prod.appspot.com/o/spaces%2FH2bFRBmIfyK3kwVKbldl%2Fuploads%2Fgit-blob-5510558a04d4a94d5327f5d25fc33880478c4ff4%2Fpm-governanca-tempo-real-filtro-status-en.png?alt=media" alt="Real Time table filtered by the Active status"></picture><figcaption><p>Table filtered by status</p></figcaption></figure>

**How to use:**

1. Open the **All statuses** list.
2. Choose **Active**, **Inactive** or **Unknown**. The table and the card counters then consider only the items with that status.
3. To remove the filter, select **All statuses** again.

### Period filter (Created at and Modified at)

**What it is:** the **Created at** and **Modified at** boxes, above the table, each with a start date and an end date (**to**).

**What it is for:** find items created recently or that have not been changed in a long time.

<figure><picture><source srcset="/files/fxT25PbbJPKOAOl64E1i" media="(prefers-color-scheme: dark)"><img src="https://3938213054-files.gitbook.io/~/files/v0/b/gitbook-x-prod.appspot.com/o/spaces%2FH2bFRBmIfyK3kwVKbldl%2Fuploads%2Fgit-blob-fed453d29df29a32ac0009cbd2a4380d23e0a62b%2Fpm-governanca-tempo-real-filtro-periodo-en.png?alt=media" alt="Created at and Modified at period boxes with start date and end date"></picture><figcaption><p>Period filter</p></figcaption></figure>

**How to use:**

1. In the **Created at** (or **Modified at**) box, fill in the start date, the end date, or both.
2. The table then shows only the items within the range.
3. Clear the dates to remove the filter.

**How it works:** the dates are interpreted in your browser's time zone, from the start of the first day to the end of the last day. Items without the date provided do not appear when a range is filled in.

### Sorting

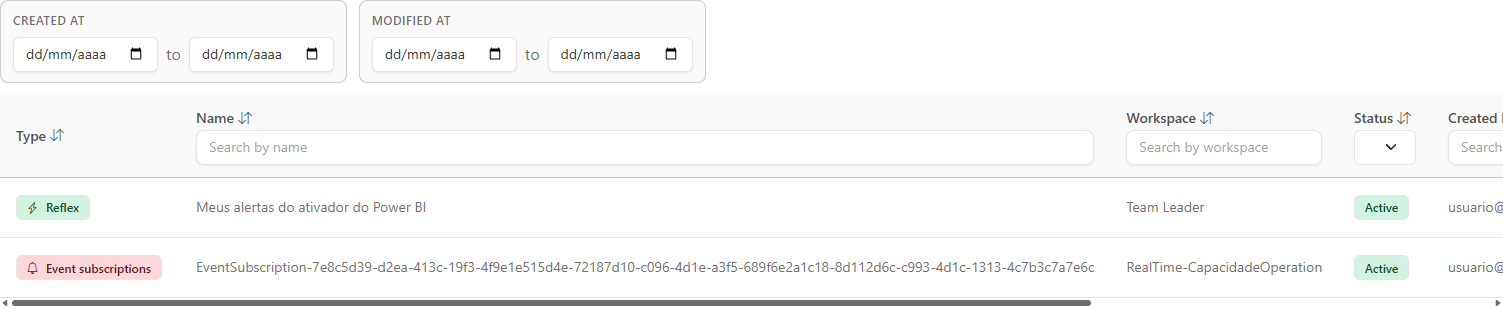
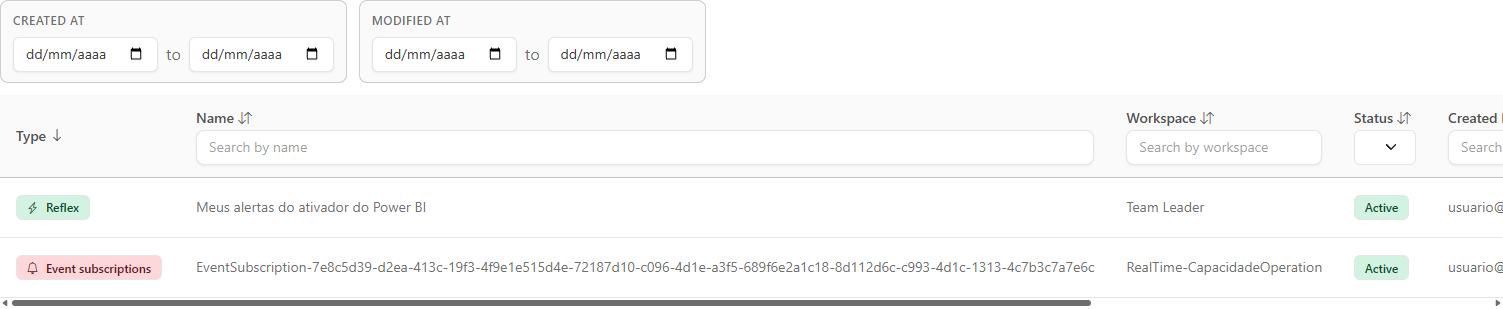
**What it is:** sorting the table by clicking a column title, including **Type**.

**What it is for:** group items by type, by workspace or bring the most recently changed ones to the top.

<figure><picture><source srcset="/files/taVWK78WwtIv5aGXVw15" media="(prefers-color-scheme: dark)"><img src="https://3938213054-files.gitbook.io/~/files/v0/b/gitbook-x-prod.appspot.com/o/spaces%2FH2bFRBmIfyK3kwVKbldl%2Fuploads%2Fgit-blob-b1f93bdd08eedfb991830367a941c13b67d2eff1%2Fpm-governanca-tempo-real-ordenacao-en.png?alt=media" alt="Real Time table sorted by the Type column"></picture><figcaption><p>Table sorted by the Type column</p></figcaption></figure>

**How to use:**

1. Click the column title. The first click sorts in descending order.
2. Click again to reverse the order. The arrow next to the title indicates the direction.

**How it works:** the default sort is by **Modified at**, from most recent to oldest. In date columns, items without a date always stay at the end of the list.

### Row actions menu (⋮)

**What it is:** the menu opened by the **⋮** button at the end of the row, or by right-clicking it. It has the **Open details** item, with a submenu of the modal's tabs.

**What it is for:** open the details modal directly on the tab of interest.

<figure><picture><source srcset="/files/Xzapi7vw5K2JWTIAkb2u" media="(prefers-color-scheme: dark)"><img src="https://3938213054-files.gitbook.io/~/files/v0/b/gitbook-x-prod.appspot.com/o/spaces%2FH2bFRBmIfyK3kwVKbldl%2Fuploads%2Fgit-blob-a907e892be6e2609bf5631baa457daba9d48c0ac%2Fpm-governanca-tempo-real-menu-acoes-en.png?alt=media" alt="Row actions menu with the Open details submenu"></picture><figcaption><p>Actions menu with the submenu of modal tabs</p></figcaption></figure>

**How to use:**

1. Click **⋮** on the row (or right-click it).
2. Click **Open details** to open the modal on the **Overview** tab, or hover over the item and choose **Overview**, **Users & Permissions** or **Dependencies** in the submenu.

**How it works:** there is no "Open in Power BI" link on this screen.

### Details modal: Overview

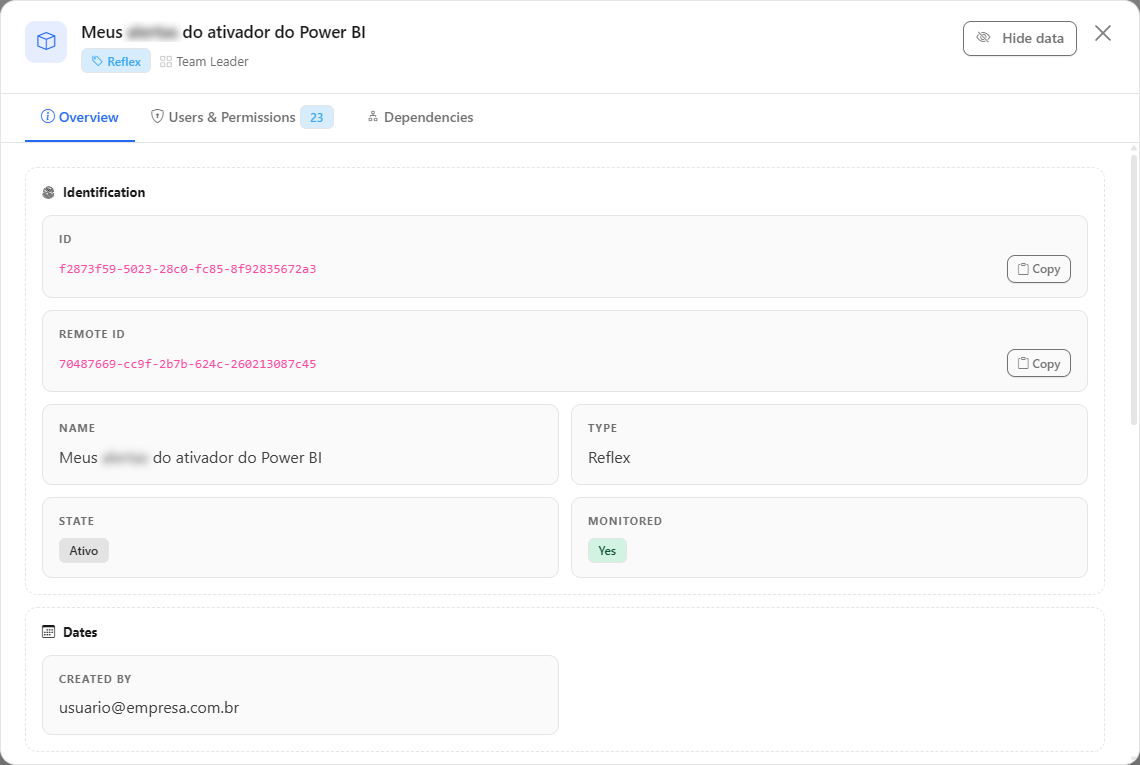
**What it is:** the first tab of the details modal, with the artifact's registration data.

**What it is for:** check the identifier, state and authorship of the item, for example, to locate it in Fabric.

<figure><picture><source srcset="/files/ZODaBPPSvMvSjhBFLlJ5" media="(prefers-color-scheme: dark)"><img src="https://3938213054-files.gitbook.io/~/files/v0/b/gitbook-x-prod.appspot.com/o/spaces%2FH2bFRBmIfyK3kwVKbldl%2Fuploads%2Fgit-blob-2238bf6f887aef412a19d39ca76bbe55f3547b65%2Fpm-governanca-tempo-real-modal-visao-geral-en.png?alt=media" alt="Details modal of a real-time artifact on the Overview tab"></picture><figcaption><p>Overview tab</p></figcaption></figure>

**How to use:**

1. Click the row (or **⋮** › **Open details**).
2. Check **ID**, **Name**, **Type**, **State**, **Workspace**, **Created on**, **Modified on**, **Created by**, **Modified by** and, when available, **Tags** and **Description**.
3. To copy the identifier, click **Copy** next to the **ID**; the button changes to **Copied!**.
4. Close with the **X** or by clicking outside the modal.

### Details modal: Users & Permissions

**What it is:** the tab that lists users, groups and applications with access to the item.

**What it is for:** find out who can change an Activator alert or an event subscription, including external guests, and who can take over an item whose author left the company.

**How to use:**

{% stepper %}
{% step %}

#### Open the tab

Click the row's **⋮** button and choose **Open details** › **Users & Permissions**.
{% endstep %}

{% step %}

#### Search for a principal

Type in the **Search by name, email or identifier...** box to find a user, group or application.
{% endstep %}

{% step %}

#### Assess the access

Check the **User**, **Identifier**, **Principal Type** (**User**, **Group** or **Application**), **Category** (**Member** or **Guest/External**) and **Access Level** columns of each row.
{% endstep %}
{% endstepper %}

**How it works:** the total number of users and applications with access appears at the top of the tab and on the tab label. The **Access Level** badge uses red for administration or owner, yellow for write and blue for read; external guests have the **Category** highlighted in yellow.

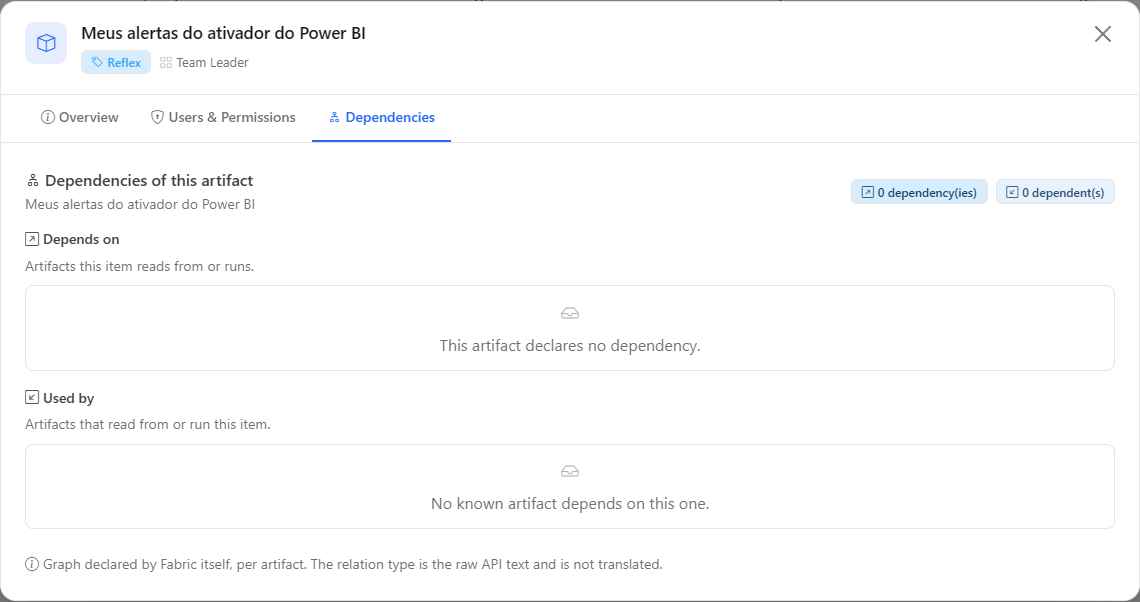
### Details modal: Dependencies

**What it is:** the tab with the dependency graph declared by Fabric itself for the item.

**What it is for:** understand the chain, for example, which Eventstream or KQL database a Reflex reads from, and what stops working if the item is removed.

<figure><picture><source srcset="/files/sJGnfPc5RfaCKN4HERsW" media="(prefers-color-scheme: dark)"><img src="https://3938213054-files.gitbook.io/~/files/v0/b/gitbook-x-prod.appspot.com/o/spaces%2FH2bFRBmIfyK3kwVKbldl%2Fuploads%2Fgit-blob-59499233a2772798130dba151432bb1afedbe12a%2Fpm-governanca-tempo-real-modal-dependencias-en.png?alt=media" alt="Dependencies tab of a Reflex modal, with the Depends on and Used by sections"></picture><figcaption><p>Dependencies tab</p></figcaption></figure>

**How to use:**

1. Click the row's **⋮** button and choose **Open details** › **Dependencies**.
2. At the top, see the totals of dependencies, dependents and items outside the monitored scope.
3. Check the **Depends on** (artifacts the item reads from or runs) and **Used by** (artifacts that read from or run the item) sections, with the **Artifact**, **Type**, **Relation type** and **Identifier** columns.

**How it works:** an **Unidentified artifact** row indicates a real dependency on an artifact outside the monitored scope (unmonitored workspace, type not collected or not yet scanned): only the name is not available. If the item declares no dependencies, the tab displays "There is no dependency graph for this artifact.". See also [The details modal](/en/power-monitor/governanca/relatorios.md#the-details-modal), common to the Governance lists.

## Rules and behavior

* **Data source:** the artifacts are collected by the inventory scans. Changes in Fabric appear after the next run of the [Inventory Scan](/en/power-monitor/mapeamento/inventarios.md).
* **Independent load per type:** if one of the four types fails to load, the others remain in the list.
* **Monitored workspaces only:** there is no option to include unmonitored workspaces; the monitored-workspaces restriction is always applied.
* **Workspace scope:** if your user has visibility restricted to some workspaces, you will see only their artifacts.
* **Items deleted** in Fabric leave this list and start appearing in [Deleted Artifacts](/en/power-monitor/governanca/operacao/artefatos-excluidos.md).
* **Dates** are displayed in your browser's time zone.
* The other [common list rules](/en/power-monitor/governanca/relatorios.md#rules-that-apply-to-all-lists) also apply.

## Step by step

### How to find Activator alerts without an owner

{% stepper %}
{% step %}

#### Filter the type

In *Governance › Data and Engineering › Real Time*, click the **Reflex** card.
{% endstep %}

{% step %}

#### Locate the author

Type the person's name or email in the filter box of the **Created by** (or **Modified by**) column, for example, of an employee who left the company.
{% endstep %}

{% step %}

#### Assess each item

Open **⋮** › **Open details** › **Users & Permissions** to see who else has access to the item and can take it over, and **Dependencies** to find out which data it depends on.
{% endstep %}
{% endstepper %}

### How to list the real-time items of a workspace

1. Type the workspace name or ID in the **Search by workspace** box.
2. See in the cards how many items of each type the workspace has.
3. Click a card to see only that type.

## Frequently asked questions

<details>

<summary>Where are the KQL databases and Eventstreams?</summary>

On the [Storage](/en/power-monitor/governanca/armazenamento.md) screen, **KQL DB** and **Streams** cards.

</details>

<details>

<summary>The Dashboard card shows more real-time items than this screen.</summary>

Check that no filter is applied in the columns and that your user has visibility over all workspaces. This screen shows only items from monitored workspaces that still exist in the tenant, the same criterion as the monitored item count.

</details>

<details>

<summary>I filtered the table and the card numbers changed. Is that normal?</summary>

Yes. On this screen the cards always reflect the column filters applied, so that the card number is equal to what the table shows.

</details>

<details>

<summary>Can I change or delete an artifact through this screen?</summary>

No. The screen is for inventory and consultation; changes must be made in Microsoft Fabric itself.

</details>

## Related pages

* [Storage](/en/power-monitor/governanca/armazenamento.md)
* [KQL Dashboards](/en/power-monitor/governanca/relatorios/kql-dashboards.md)
* [Fabric Mirroring](/en/power-monitor/governanca/dados-e-engenharia/fabric-mirroring.md)
* [Data Engineering](/en/power-monitor/governanca/dados-e-engenharia/engenharia-de-dados.md)
* [Deleted Artifacts](/en/power-monitor/governanca/operacao/artefatos-excluidos.md)
* [Mapping › Inventory](/en/power-monitor/mapeamento/inventarios.md)


---

# Agent Instructions
This documentation is published with GitBook. GitBook is the documentation platform designed so that both humans and AI agents can read, navigate, and reason over technical content effectively. Learn more at gitbook.com.

## Querying This Documentation
If you need additional information that is not directly available in this page, you can query the documentation by asking a question.

Perform an HTTP GET request on the following URL with the `ask` and `goal` query parameters:

```
GET https://docs.powermonitor.com.br/en/power-monitor/governanca/dados-e-engenharia/tempo-real.md?ask=<question>&goal=<user_goal>
```

`ask` is the immediate question: it should be specific, self-contained, and written in natural language.
`goal` is what the user is ultimately trying to achieve, the reason they need the answer. Sharing it helps GitBook give you a better, more relevant answer. A goal is most helpful when it describes the outcome the user wants rather than restating the question. For example, with `ask=how do I create an API token`, a goal like `automate deployments from our CI pipeline` lets GitBook tailor the answer to that use case.

The response will contain a direct answer to the question and relevant excerpts and sources from the documentation.

Use this mechanism when the answer is not explicitly present in the current page, you need clarification or additional context, or you want to retrieve related documentation sections.