> For the complete documentation index, see [llms.txt](https://docs.powermonitor.com.br/llms.txt). Markdown versions of documentation pages are available by appending `.md` to page URLs; this page is available as [Markdown](https://docs.powermonitor.com.br/en/power-monitor/governanca/infraestrutura/azure-quotas.md).
# Azure Quotas
Track the limit and current usage of Fabric Capacity Units (CU) in each Azure subscription and region, so you can plan new capacities and SKU increases before you hit the quota.
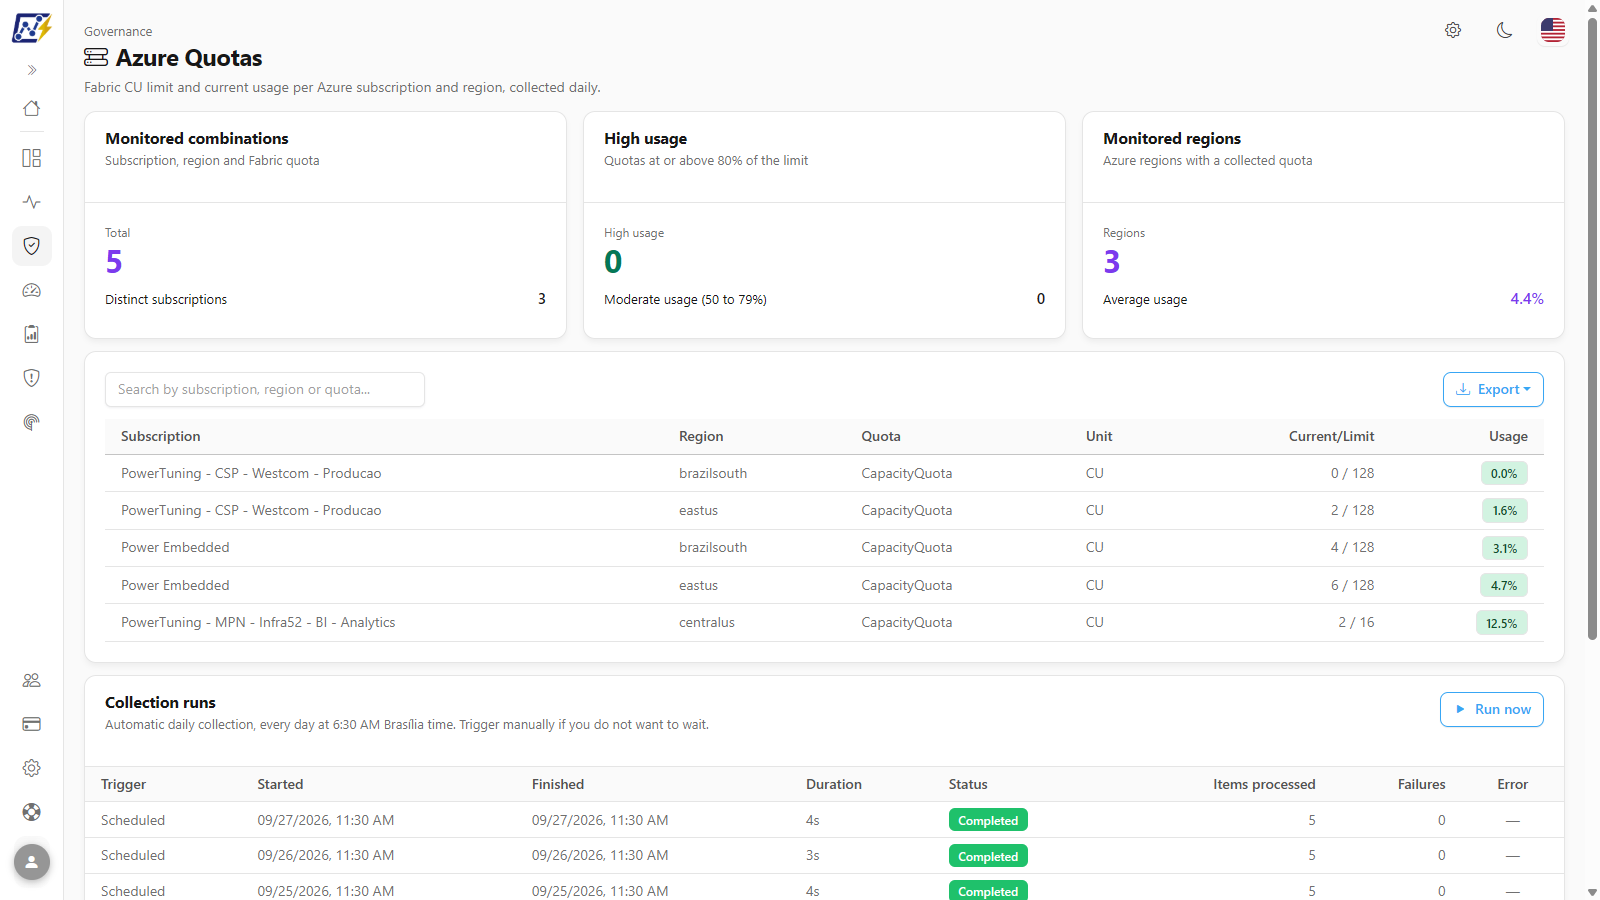
The **Azure Quotas** screen shows, for each combination of **Azure subscription**, **region** and Microsoft Fabric **quota**, how many **Capacity Units (CU)** are already in use and what **limit** Microsoft allows. Fabric capacities (F SKUs) are Azure resources, and each subscription has a CU ceiling per region: when that ceiling is reached, you cannot create a new capacity or increase the SKU of an existing one in that region until the quota is raised.
**How to access:** *Governance › Infrastructure › Azure Quotas*. Viewing is available to all profiles. The screen is read-only; the collection (**Run now**, **Pause** and the run history) is controlled in [Mapping › Azure Quotas](/en/power-monitor/mapeamento/azure-quotas.md), which is exclusive to **Administrators**. An administrator can block this page for specific users in [Users](/en/power-monitor/usuarios.md).
Azure Quotas
## What it is for
* **Planning growth:** knowing, before requesting a new capacity or a larger SKU, whether there is still CU available in the subscription and region.
* **Avoiding scaling failures:** a manual, scheduled or automatic [SKU change](/en/power-monitor/governanca/infraestrutura/capacidades.md) operation fails if the region's quota is exhausted. The screen shows where usage is already close to the limit.
* **Anticipating quota increase requests:** increase requests submitted to Microsoft take time. With usage above 80%, it is worth submitting the request before you need it.
## Features
### Monitored combinations card
**What it is:** the first card (*Subscription, region and Fabric quota*), with the **Total** number of rows in the list and the **Distinct subscriptions** line.
**What it is for:** knowing how many subscriptions and regions are being tracked.
Quota indicators
**How to use it:** check whether the number of **Distinct subscriptions** matches the subscriptions where your organization has Fabric capacities. If any is missing, see [Where the combinations come from](#rules-and-behavior).
**How it works:** each combination of subscription, region and quota name is one row. The cards consider the entire list and **do not change** with the search.
### High usage card
**What it is:** the *Quotas at or above 80% of the limit* card, with the number of quotas in **High usage** and the **Moderate usage (50 to 79%)** line.
**What it is for:** identifying in seconds the regions where there is no more room to grow.
**How to use it:** if the card is **red** (there is at least one quota at 80% or more), find the rows in the list with the red usage badge and consider a quota increase request. With zero quotas in high usage, the card turns green. The **Moderate usage** line turns yellow when there are quotas between 50% and 79%.
### Monitored regions card
**What it is:** the *Azure regions with a collected quota* card, with the number of distinct **Regions** and the **Average usage** line.
**What it is for:** getting an overview of the geographic distribution of capacities and the average quota occupancy level.
**How it works:** **Average usage** is the simple average of the usage percentage of all rows in the list (each combination has the same weight, regardless of the size of the limit).
### Search
**What it is:** the *Search by subscription, region or quota...* field above the list.
**What it is for:** isolating a specific subscription or region.
Search and export
**How to use it:**
1. Type part of the subscription name or ID, the region (for example, `brazilsouth`) or the quota name. The list is filtered as you type.
2. Clear the text to return to the full list.
**How it works:** the search is case-insensitive. When nothing matches, *No quota matches the search.* is displayed. The search also defines what is exported.
### Quota list
**What it is:** the table with one combination of subscription, region and quota per row.
**What it is for:** comparing the usage of each quota with its limit.
CU usage and limit per subscription and region
| Column | Content |
| ----------------- | --------------------------------------------------------------------------------------------------- |
| **Subscription** | Name of the Azure subscription. When the name cannot be retrieved, the subscription ID is displayed |
| **Region** | Azure region, in the format used by Azure (for example, `brazilsouth`, `eastus2`) |
| **Quota** | Quota name reported by Azure for Fabric |
| **Unit** | Quota unit (usually **CU**, Capacity Units) |
| **Current/Limit** | CU in use in the region by the subscription's capacities / quota limit |
| **Usage** | Usage percentage (**Current** ÷ **Limit**), with one decimal place, in a colored badge |
**Usage badge colors:**
| Color | Range |
| ------ | ------------ |
| Green | Below 50% |
| Yellow | 50% to 79.9% |
| Red | 80% or more |
**How to use it:** go through the list looking for yellow and red badges. Before creating a capacity or increasing a SKU, confirm that the **Limit** minus the **Current** value can accommodate the CU of the new SKU (for example, an F64 consumes 64 CU).
**How it works:**
* When the limit reported by Azure is zero, usage is displayed as **0.0%**.
* With no quota collected, *No quota collected yet.* is displayed.
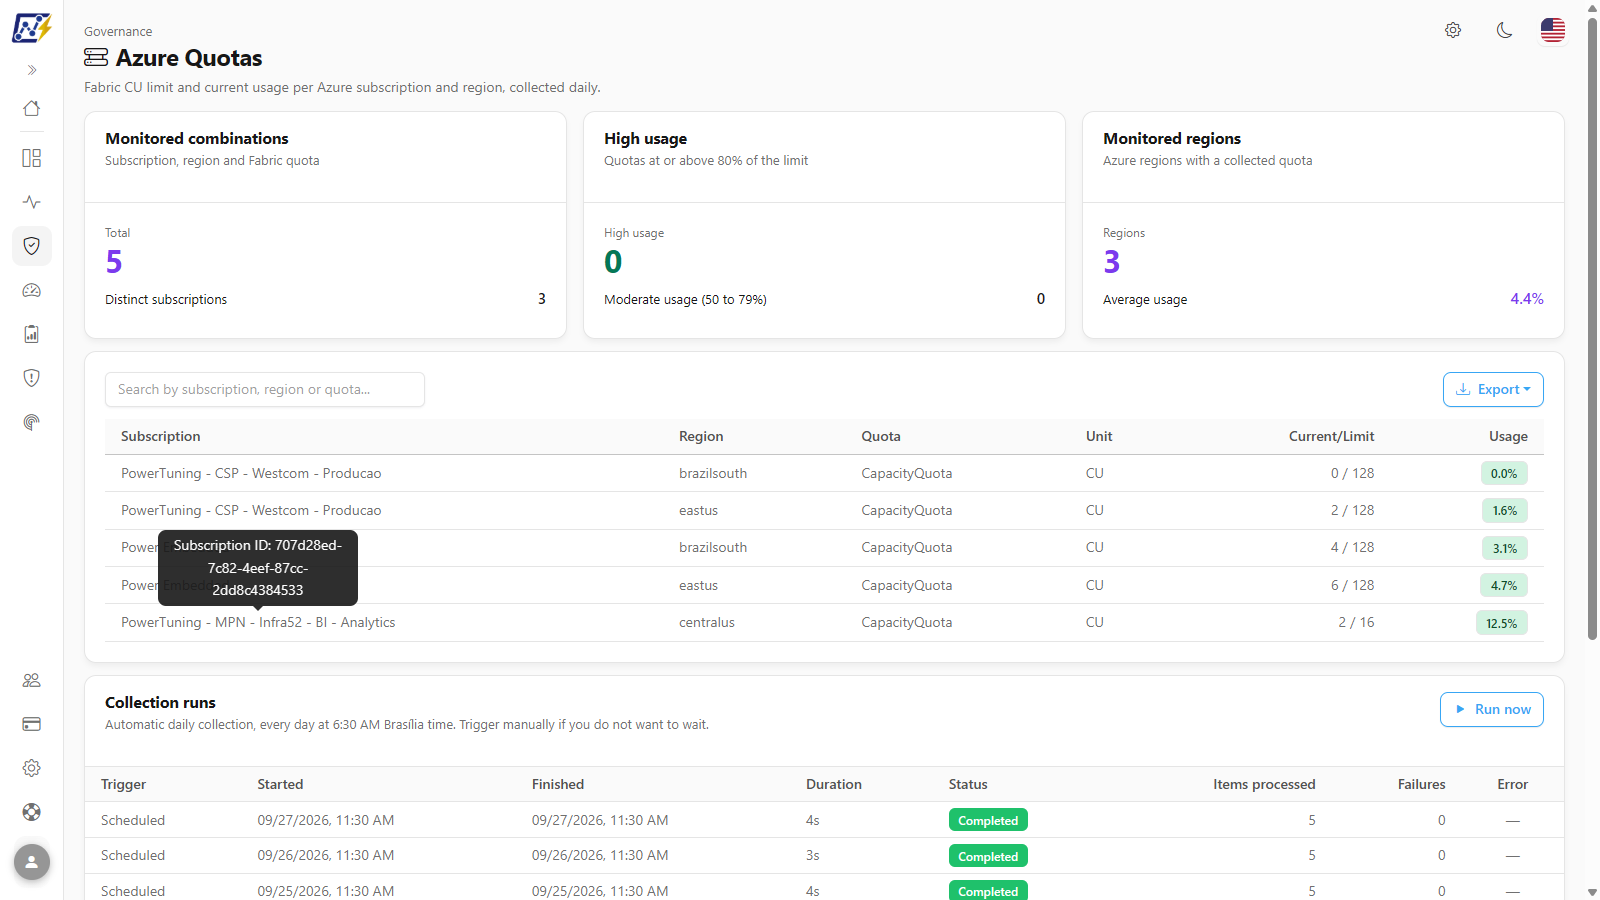
### Subscription ID
**What it is:** the tooltip displayed when you hover over the subscription name, with *Subscription ID: {id}*.
**What it is for:** getting the exact subscription identifier to submit a quota increase request in the Azure portal or to check permissions.
Subscription ID in the name tooltip
**How to use it:** hover over the subscription name in the **Subscription** column. When the column already shows the ID (name not available), there is no tooltip.
**How it works:** the subscription name is queried in Azure and cached for a few hours. If the Service Principal cannot read the name, the screen shows the ID, without affecting the rest of the data.
### Export
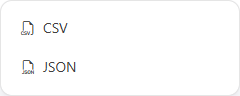
**What it is:** the **Export** button, next to the search, with the **CSV** and **JSON** options.
**What it is for:** taking the numbers to a capacity planning spreadsheet or attaching them to a quota increase request.
Exporting quotas
**How to use it:**
1. If you want, filter the list with the search.
2. Click **Export** and choose **CSV** or **JSON**.
**How it works:** the file contains the rows visible after the search. The CSV includes **Subscription**, **Subscription ID**, **Region**, **Quota**, **Unit**, **Current**, **Limit** and **Usage (%)**. The button is disabled when the list is empty.
### Collection
**What it is:** the **Collection** line, at the top of the screen, which shows the status of the last quota collection run (*last run on \[date]*, *running since \[date]*, *last run on \[date], failed* or *no run recorded*). For Administrators, it includes the **View/manage collection →** link.
**What it is for:** confirming at a glance that the daily collection is running and going straight to the page that controls the collection, for example to refresh the numbers right after creating or resizing a capacity.
**How to use (Administrator):**
1. Click **View/manage collection →** to open [Mapping › Azure Quotas](/en/power-monitor/mapeamento/azure-quotas.md).
2. Click **Run now**. Follow the **Run in progress** badge and, if you need to stop it, use **Pause**.
3. When the run shows as **Completed**, come back to this screen and reload the page to see the updated numbers.
**How it works:** other profiles see only the status, without the link. The collection is daily and automatic, at 06:30 (Brasília time). The run history (**Trigger**, **Started**, **Finished**, **Duration**, **Status**, **Items processed**, **Failures** and **Error**) is on the Mapping page, not on this screen.
### Error state
**What it is:** when the list cannot be loaded, *Could not load quotas* (*An error occurred while querying the data. Try again in a few moments.*) is displayed.
**How to use it:** click **Try again**.
## Rules and behavior
* **Where the data comes from:** the Azure management API (quota usage and limits for the Microsoft Fabric provider), queried by the organization's Service Principal.
* **Where the combinations come from:** the organization's Fabric capacities that already have their **Azure subscription identified** (see [Sync with Azure](/en/power-monitor/governanca/infraestrutura/capacidades.md#sync-with-azure) in *Governance › Infrastructure › Capacities*). For each subscription and region of these capacities, the collection queries the Fabric quotas. Capacities without an identified subscription do not generate rows.
* **Quota usage:** calculated by Azure for the entire subscription and region, adding up all Fabric capacities of that subscription in the region, including those not monitored by Power Monitor.
* **Required permission:** the Service Principal needs at least **Reader** on the capacities' subscriptions (the same permission required by **Sync with Azure**).
* **Frequency:** daily, at **06:30** (Brasília time, UTC-3), for organizations with a Service Principal configured. The collection can be turned off in [Settings › Monitoring](/en/power-monitor/configuracoes/monitoramento.md) › **Scans and Collections**, **Others** group, **Azure Capacity Units Quotas** item. The **Run now** button in [Mapping › Azure Quotas](/en/power-monitor/mapeamento/azure-quotas.md) works even with the switch turned off.
* **Quota increase:** requested from Microsoft through the Azure portal; Power Monitor does not change quotas.
## How to use: common tasks
### How to check whether there is quota for a new capacity or a larger SKU
{% stepper %}
{% step %}
### Find the subscription and region
In *Governance › Infrastructure › Azure Quotas*, type in the search the subscription name or the region where the capacity will be created or scaled up.
{% endstep %}
{% step %}
### Calculate the headroom
In the **Current/Limit** column, subtract the **Current** value from the **Limit**. The result is how many CU can still be allocated.
{% endstep %}
{% step %}
### Compare with the desired SKU
Compare the headroom with the SKU size (an F32 uses 32 CU, an F64 uses 64 CU). For a SKU increase, consider only the difference between the new SKU and the current one.
{% endstep %}
{% step %}
### Request an increase if needed
If the headroom is not enough, request an increase of the Fabric quota in the Azure portal. Use the **Subscription ID** from the name tooltip to identify the subscription.
{% endstep %}
{% endstepper %}
### How to track regions close to the limit
1. Open *Governance › Infrastructure › Azure Quotas* and read the **High usage** card.
2. If there are quotas in high or moderate usage, find the rows in the list with a red or yellow badge.
3. Click **Export** › **CSV** to record the situation and track how it evolves over time.
## Frequently asked questions
A subscription with Fabric capacities does not appear in the list.
The combinations come from capacities that already have their Azure subscription identified. In *Governance › Infrastructure › Capacities*, use **Sync with Azure** (requires Administrator) and check that the Service Principal has the **Reader** role on the subscription. Then trigger **Run now** in [Mapping › Azure Quotas](/en/power-monitor/mapeamento/azure-quotas.md) or wait for the next day's collection.
The Subscription column shows an ID instead of the name.
The name is queried in Azure; when that query is not possible (for example, due to missing read permission on the subscription), the screen shows the ID. The usage and limit values remain correct.
The usage shown is higher than the sum of the capacities I see in Power Monitor.
Quota usage is calculated by Azure for the entire subscription and region, including capacities that are not being monitored by Power Monitor.
I created a capacity and the numbers did not change.
The collection is daily. An Administrator can click **Run now** in [Mapping › Azure Quotas](/en/power-monitor/mapeamento/azure-quotas.md) and, when the run is **Completed**, reload the page.
## Related pages
* [Governance](/en/power-monitor/governanca.md)
* [Capacities](/en/power-monitor/governanca/infraestrutura/capacidades.md)
* [Settings › Monitoring](/en/power-monitor/configuracoes/monitoramento.md)
* [Mapping › Azure Quotas](/en/power-monitor/mapeamento/azure-quotas.md) (manual collection and run history)
---
# Agent Instructions
This documentation is published with GitBook. GitBook is the documentation platform designed so that both humans and AI agents can read, navigate, and reason over technical content effectively. Learn more at gitbook.com.
## Querying This Documentation
If you need additional information that is not directly available in this page, you can query the documentation by asking a question.
Perform an HTTP GET request on the following URL with the `ask` and `goal` query parameters:
```
GET https://docs.powermonitor.com.br/en/power-monitor/governanca/infraestrutura/azure-quotas.md?ask=&goal=
```
`ask` is the immediate question: it should be specific, self-contained, and written in natural language.
`goal` is what the user is ultimately trying to achieve, the reason they need the answer. Sharing it helps GitBook give you a better, more relevant answer. A goal is most helpful when it describes the outcome the user wants rather than restating the question. For example, with `ask=how do I create an API token`, a goal like `automate deployments from our CI pipeline` lets GitBook tailor the answer to that use case.
The response will contain a direct answer to the question and relevant excerpts and sources from the documentation.
Use this mechanism when the answer is not explicitly present in the current page, you need clarification or additional context, or you want to retrieve related documentation sections.