> For the complete documentation index, see [llms.txt](https://docs.powermonitor.com.br/llms.txt). Markdown versions of documentation pages are available by appending `.md` to page URLs; this page is available as [Markdown](https://docs.powermonitor.com.br/en/power-monitor/governanca/infraestrutura/capacidades.md).

# Capacities

Inventory and management of Fabric and Power BI Embedded capacities, pause, resume and change size (SKU) via Azure, schedules, autoscale, schedule alerts and cost.

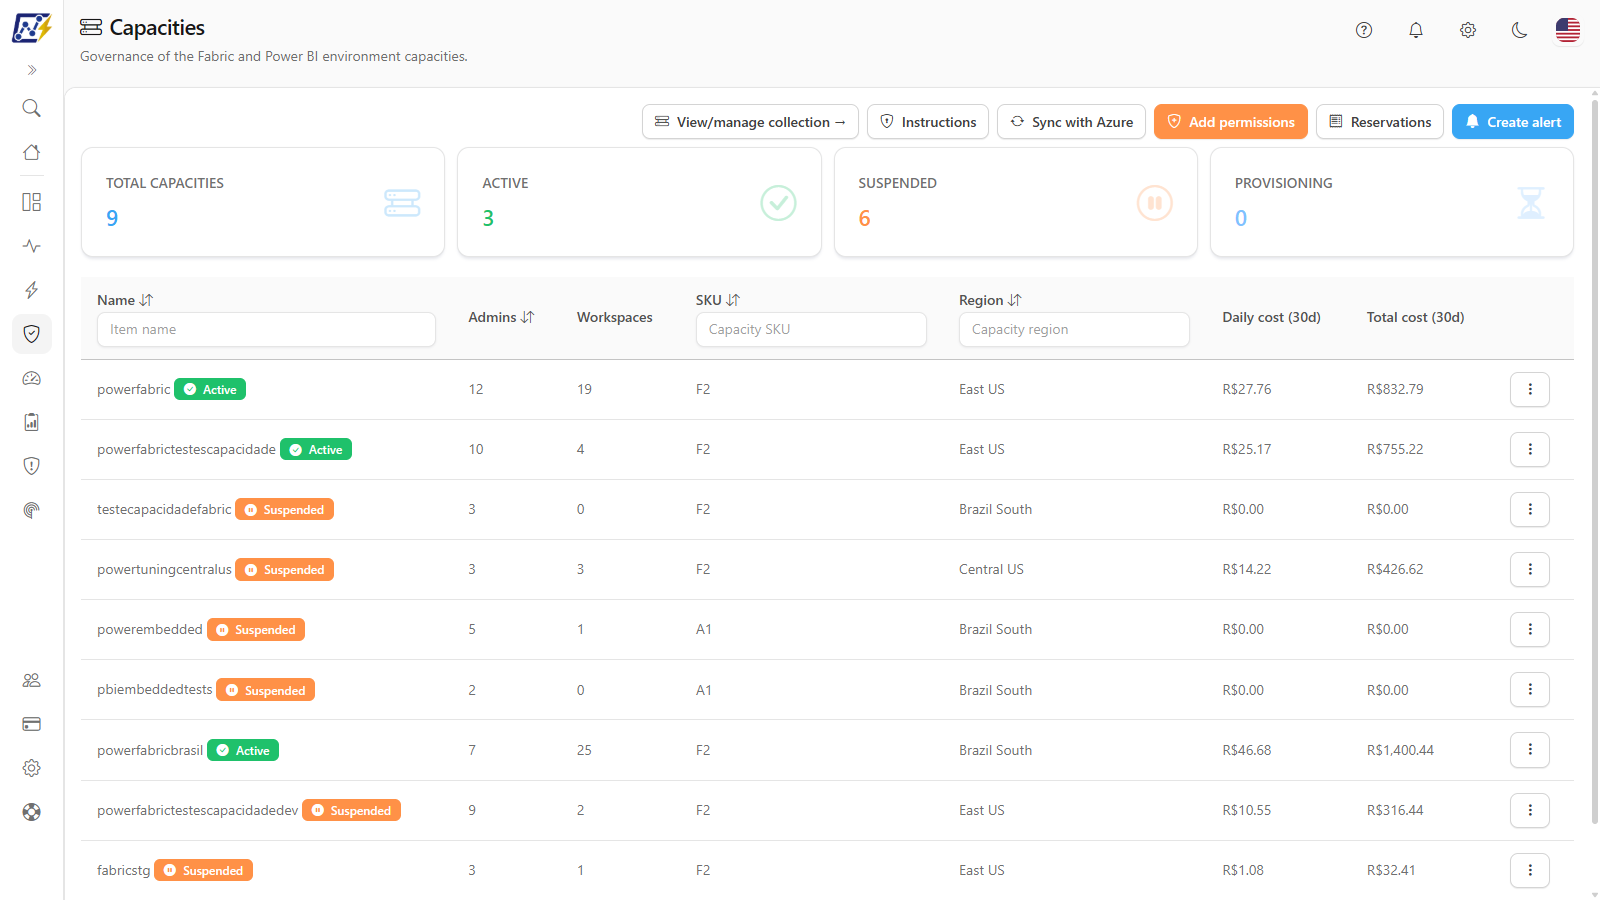
The **Capacities** screen is the central point for governing your tenant's capacities (Microsoft Fabric, Power BI Premium and Power BI Embedded). In addition to the inventory (SKU, region, administrators, state and cost), it lets you **pause, resume and change the size (SKU)** of capacities directly in Azure, **schedule** these actions, configure **autoscale** and be **alerted** when a capacity is running outside its expected hours.

**How to access:** menu *Governance › Infrastructure › Capacities*. The same screen is also available under *Capacities › Capacity Governance*.

**Who can use it:** the screen is visible to all profiles. All **actions** (pause, resume, change size (SKU), create or delete schedules, configure autoscale and alerts, save the Azure location, sync with Azure and grant permissions) are exclusive to **Administrators** and are rejected by the server for other profiles. For those profiles, the administration buttons at the top do not appear (only **Reservations** remains) and, in the details modal, the fields and save buttons appear disabled with the tooltip "This action is restricted to organization administrators.". The **Pause Capacity**/**Turn On Capacity** and **Change size (SKU)** items remain in the row menu, but the action is rejected when executed.

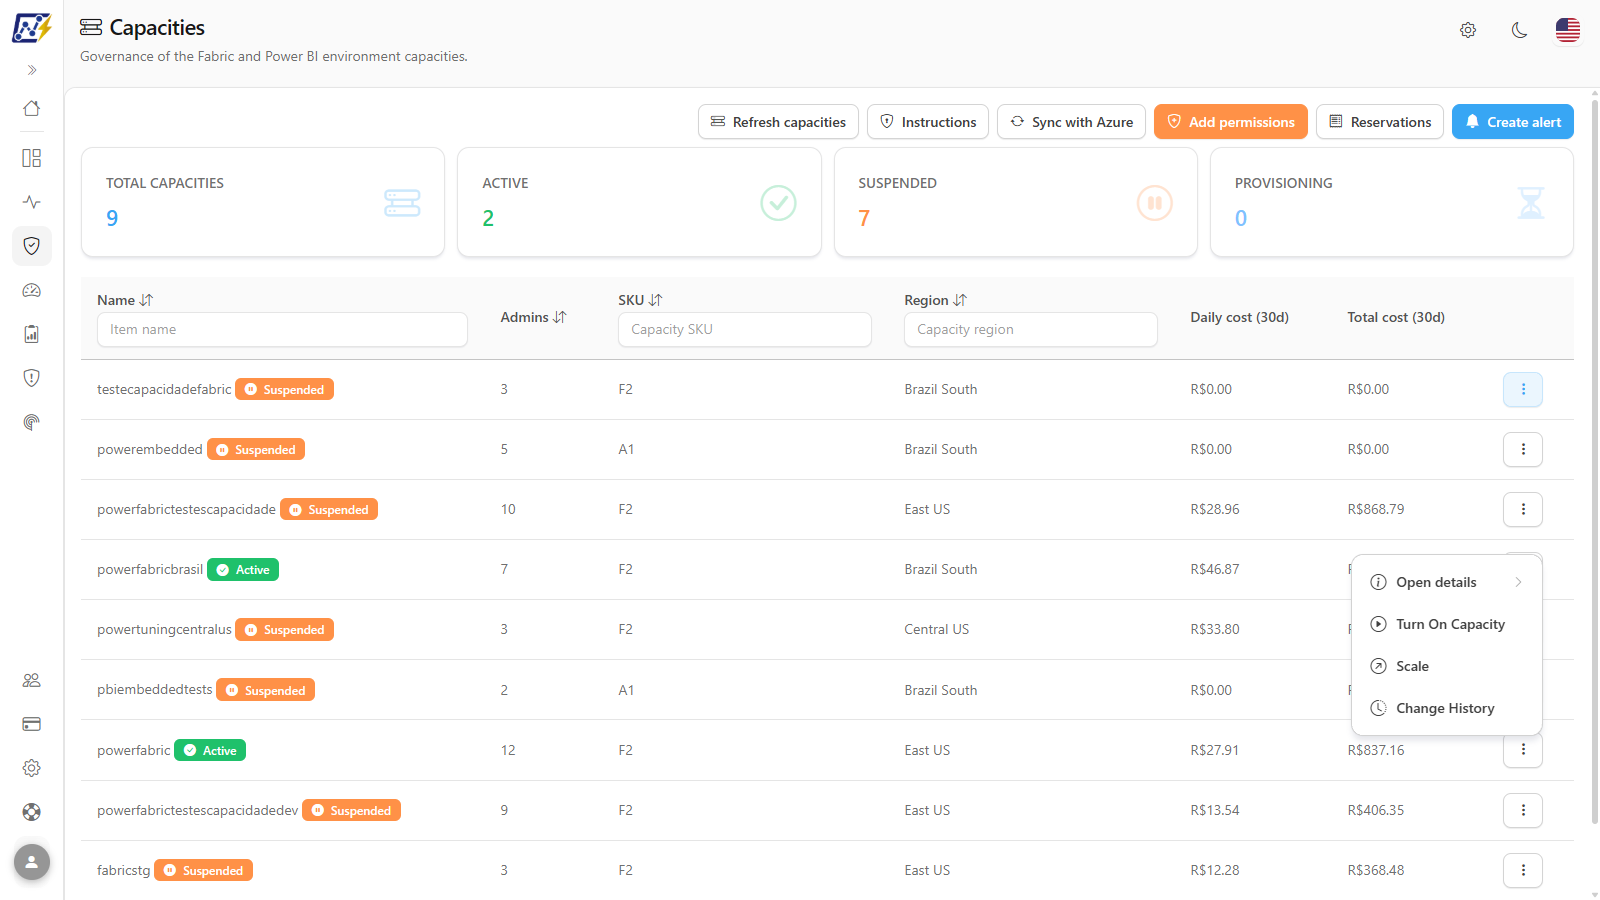
<figure><picture><source srcset="/files/8D5UJNvA3CPLM3xKe8nq" media="(prefers-color-scheme: dark)"><img src="https://3938213054-files.gitbook.io/~/files/v0/b/gitbook-x-prod.appspot.com/o/spaces%2FH2bFRBmIfyK3kwVKbldl%2Fuploads%2Fgit-blob-2a32a092bdbf3bffedd80bbca24aca5ec6077769%2Fpm-governanca-capacidades-en.png?alt=media" alt="Capacities screen with the action bar, the summary cards and the capacities table"></picture><figcaption><p>Governance › Infrastructure › Capacities</p></figcaption></figure>

## What it is for

* **Reduce cost** by pausing capacities outside usage hours (nights, weekends) with recurring schedules.
* **Absorb peaks** by increasing the SKU during known windows (month-end close, overnight loads) and returning to the normal size afterwards.
* **React to sustained load** with autoscale based on Capacity Units (CU) usage.
* **Be notified** when a capacity that should be turned off is still running (and generating cost).
* **Audit** SKU, region, administrators, cost over the last 30 days and the resource's change history in Azure.

## Screen overview

The screen has three blocks, from top to bottom:

1. **Action bar**: administration buttons (link to the list collection, permission instructions, sync with Azure, add permissions, reservations and create a cost alert).
2. **Summary cards**: count of capacities by state.
3. **Capacities table**: one row per capacity, with header filters, sorting, pagination and the **⋮** actions menu on each row, which gives access to the details modal and to operations in Azure.

<figure><picture><source srcset="/files/H60Sbr7exPSvHJgaJ1dW" media="(prefers-color-scheme: dark)"><img src="https://3938213054-files.gitbook.io/~/files/v0/b/gitbook-x-prod.appspot.com/o/spaces%2FH2bFRBmIfyK3kwVKbldl%2Fuploads%2Fgit-blob-91f2065064f15e447d00d22cdcea81bd0ef9654b%2Fpm-governanca-capacidades-barra-acoes-en.png?alt=media" alt="Action bar of the Capacities screen"></picture><figcaption><p>Action bar (Administrator view)</p></figcaption></figure>

## Features

### Summary cards

**What it is:** four cards at the top that count the listed capacities by state: **Total Capacities**, **Active**, **Suspended** and **Provisioning**.

**What it is for:** seeing at a glance how many capacities are running (and generating cost) and how many are paused, for example to check whether the overnight pause schedules are working.

<figure><picture><source srcset="/files/dLua5ZifklYpgAHUnWwk" media="(prefers-color-scheme: dark)"><img src="https://3938213054-files.gitbook.io/~/files/v0/b/gitbook-x-prod.appspot.com/o/spaces%2FH2bFRBmIfyK3kwVKbldl%2Fuploads%2Fgit-blob-172b5c8aabad5ad61dc39e561c49754c9acc3a29%2Fpm-governanca-capacidades-cards-en.png?alt=media" alt="Total Capacities, Active, Suspended and Provisioning cards"></picture><figcaption><p>Summary cards by state</p></figcaption></figure>

| Card                 | Meaning                             |
| -------------------- | ----------------------------------- |
| **Total Capacities** | Number of listed capacities         |
| **Active**           | Running capacities (*Active* state) |
| **Suspended**        | Paused capacities                   |
| **Provisioning**     | Capacities being created in Azure   |

**How it works:**

* The cards follow the table filters: when you filter by name, SKU or region, the counts consider only the filtered capacities.
* **PP3** (Premium Per User) capacities are not included in any card, because they are not listed on this screen.
* The cards are informational only (not clickable). States such as *Updating SKU* or *Provision Failed* are included in **Total Capacities**, but not in any of the other three cards.
* **F0** (on-demand) capacities never count as **Suspended**: they have no provisioned capacity to pause.

### Capacities table

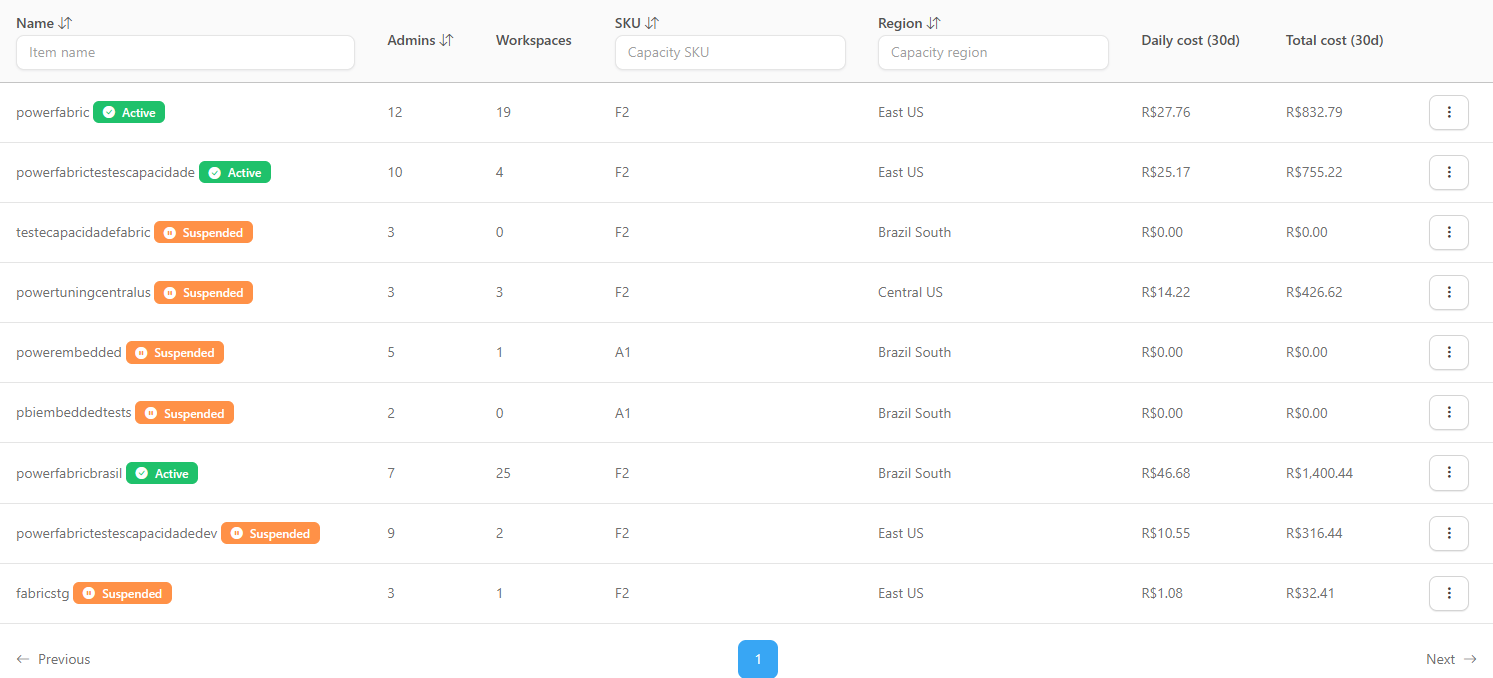
**What it is:** the list of the tenant's capacities, one per row, with state, administrators, number of workspaces, SKU, region and cost over the last 30 days.

**What it is for:** inventorying capacities, quickly identifying those that are paused or have problems and those that are not yet ready to be operated by Power Monitor (**Not configured** badge).

<figure><picture><source srcset="/files/oZ7rb6wQqnwqokVtyz3u" media="(prefers-color-scheme: dark)"><img src="https://3938213054-files.gitbook.io/~/files/v0/b/gitbook-x-prod.appspot.com/o/spaces%2FH2bFRBmIfyK3kwVKbldl%2Fuploads%2Fgit-blob-5214eecd7479ddaed623ed708dde68eabd811a3b%2Fpm-governanca-capacidades-tabela-en.png?alt=media" alt="Capacities table with state badges and the Admins, Workspaces, SKU, Region and cost columns"></picture><figcaption><p>Capacities table</p></figcaption></figure>

| Column               | Description                                                                                                                                                                                            |
| -------------------- | ------------------------------------------------------------------------------------------------------------------------------------------------------------------------------------------------------ |
| **Name**             | Capacity name, with the **state** badge (or the **On-demand (F0)** badge), the yellow **Not configured** badge when the Azure location is missing and, on trial capacities, the trial expiration badge |
| **Admins**           | Number of capacity administrators                                                                                                                                                                      |
| **Workspaces**       | Number of workspaces assigned to the capacity. Counts existing workspaces, monitored or not, excluding personal and deleted workspaces                                                                 |
| **SKU**              | Purchased size (for example, F0, F2, F64, A1, P1)                                                                                                                                                      |
| **Region**           | Azure region where the capacity is provisioned                                                                                                                                                         |
| **Daily cost (30d)** | Average cost per day over the last 30 days (**Variable** for F0)                                                                                                                                       |
| **Total cost (30d)** | Accumulated cost over the last 30 days (**Variable** for F0)                                                                                                                                           |

**State badges (Name column):**

| Badge                | Color  | Meaning                              |
| -------------------- | ------ | ------------------------------------ |
| **Active**           | Green  | Capacity turned on and running       |
| **Suspended**        | Yellow | Capacity paused (no compute charges) |
| **Provisioning**     | Blue   | Capacity being created in Azure      |
| **Updating SKU**     | Blue   | SKU change in progress               |
| **Provision Failed** | Red    | Azure could not create the capacity  |
| **Deleted**          | Red    | Capacity deleted                     |
| **Unknown**          | Gray   | Any other state reported by Azure    |

**Other badges in the Name column:**

| Badge                                                                                                     | Meaning                                                                                                                                                                                                               |
| --------------------------------------------------------------------------------------------------------- | --------------------------------------------------------------------------------------------------------------------------------------------------------------------------------------------------------------------- |
| **On-demand (F0)**                                                                                        | F0 capacity, serverless: no provisioned CUs, billed on actual consumption, and no capacity-off alerts. It is never paused. It appears in place of the state badge.                                                    |
| **Trial: expires in&#x20;*****N*****&#x20;days** / **Trial: expires in 1 day** / **Trial: expires today** | Fabric trial capacity with a known expiration date. Gray with more than 14 days, yellow with 14 days or less and red with 3 days or less. Hover to see the date (UTC) and, when estimated, the estimate notice.       |
| **Trial expired**                                                                                         | Trial capacity that has already expired (red).                                                                                                                                                                        |
| **Overage**                                                                                               | Overage is enabled on the capacity: it can consume beyond its SKU, with the excess billed in CU-hours up to the limit. Hover to see the explanation; the details are in the [Overage](#overage) section of the modal. |

The **Not configured** badge indicates that the capacity does not yet have a known **Subscription** and **Resource Group**. While it is displayed, you cannot pause, resume, change the size (SKU) or view the change history through Power Monitor. See [How to prepare a capacity to be operated by Power Monitor](#how-to-prepare-a-capacity-to-be-operated-by-power-monitor).

{% hint style="info" %}
The cost columns are filled in only for **Fabric (F)** and **Power BI Embedded (A)** capacities, which are billed through Azure. Trial (**FT**) and classic Premium (**P**) capacities display "-". **F0** (on-demand) capacities display **Variable**: billing is per consumption, with no fixed monthly cost. The cost comes from the same Azure Cost Management scan used in [Dashboards › Capacity Cost](/en/power-monitor/dashboards/custo-de-capacidade.md).
{% endhint %}

**How to use:**

1. Click anywhere on the row to open the capacity details modal.
2. Click the **⋮** button at the end of the row (or right-click the row) to open the [actions menu](#row-actions-menu).
3. Use the pagination below the table to navigate; the list shows 10 capacities per page and the **Items per page** selector (10, 25, 50 or 100) lets you change that. Changing the size goes back to the first page.

When no capacity is found, the table shows "No capacities registered".

### Filters and sorting

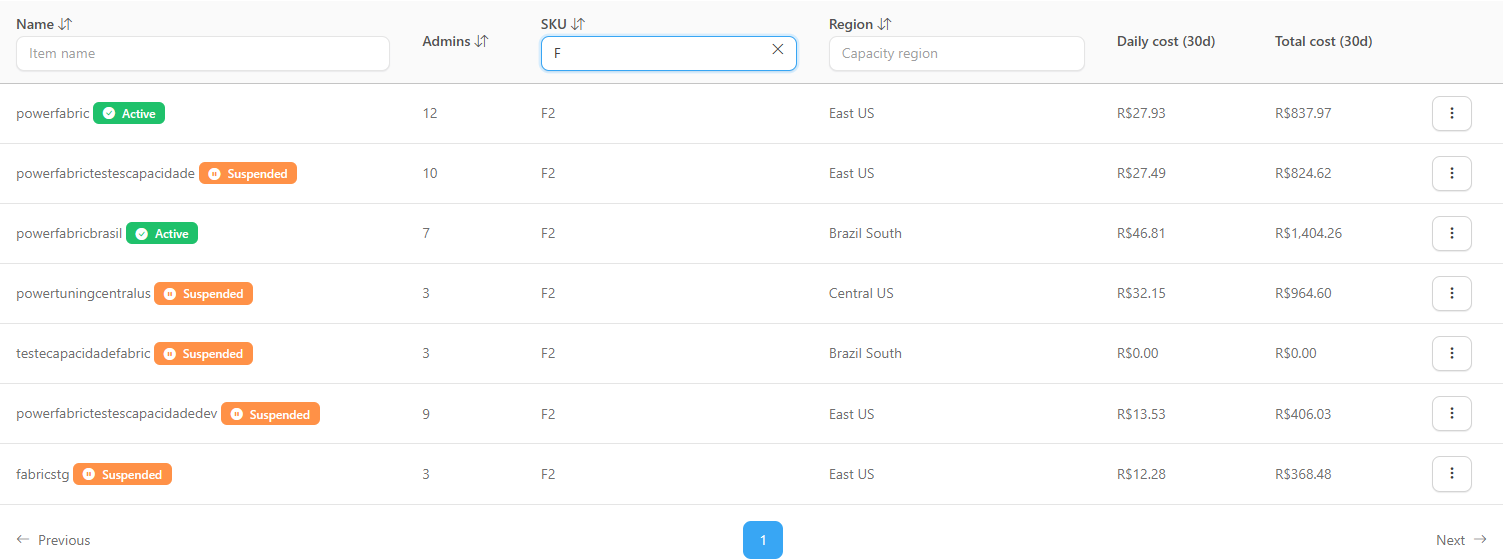
**What it is:** text boxes in the header of the **Name**, **SKU** and **Region** columns and sorting by clicking the column titles.

**What it is for:** quickly finding a capacity by name, or listing all capacities of a given size (for example, all F64) or region.

<figure><picture><source srcset="/files/UHFd8aJ9c9811wtuTJmR" media="(prefers-color-scheme: dark)"><img src="https://3938213054-files.gitbook.io/~/files/v0/b/gitbook-x-prod.appspot.com/o/spaces%2FH2bFRBmIfyK3kwVKbldl%2Fuploads%2Fgit-blob-347fdb143cd2bcb68a7fe8215dd10727e5361fa2%2Fpm-governanca-capacidades-filtro-sku-en.png?alt=media" alt="Capacities table filtered by the SKU column"></picture><figcaption><p>Filter by the SKU column</p></figcaption></figure>

**How to use:**

1. Type the term in the box below the title of the **Name** (*Item name*), **SKU** (*Capacity SKU*) or **Region** (*Capacity region*) column. The table is filtered automatically and returns to the first page.
2. To clear a filter, click the **X** inside the box or delete the text.
3. Click the title of the **Name**, **Admins**, **SKU** or **Region** column to sort. The first click sorts in descending order; click again to reverse it. The arrow next to the title indicates the sorted column and direction.

**Rules:** filters can be combined and are applied shortly after you stop typing. The cost columns are not sortable.

### Refresh capacities

**What it is:** the **View/manage collection →** link on the action bar (Administrators only) opens [*Mapping › Capacities*](/en/power-monitor/mapeamento/capacidades.md), where the [Capacity Scan](/en/power-monitor/mapeamento/capacidades.md) collection lives. The **Refresh capacities** button, which triggers the scan immediately, remains available in the **Instructions** modal.

**What it is for:** bringing a newly created capacity, a new SKU or a new administrator into the list without waiting for the scheduled scan.

{% hint style="info" %}
Requires the **Administrator** profile.
{% endhint %}

**How to use:**

1. Click **Refresh capacities** in the **Instructions** modal (or, on the action bar, **View/manage collection →** and use **Run now** on the Mapping screen).
2. The message "Capacity scan started successfully." confirms the start. When the scan finishes, reload the screen to see the updated data; progress is shown in [Mapping › Capacities](/en/power-monitor/mapeamento/capacidades.md).

### Permission instructions

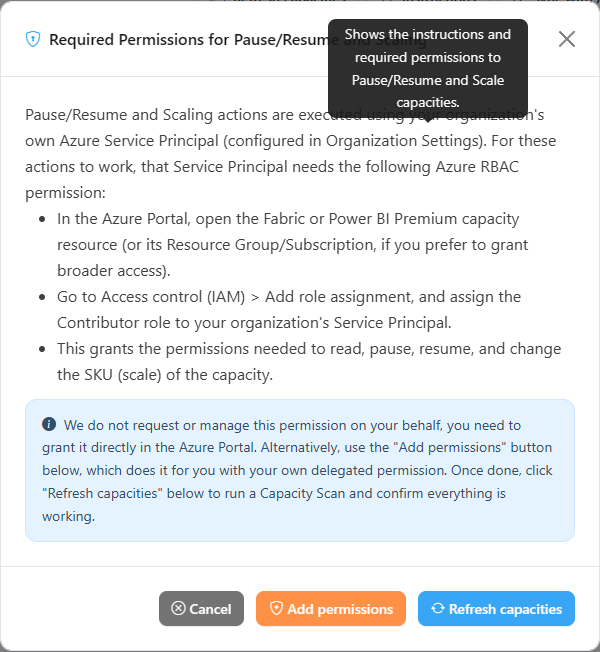
**What it is:** the **Instructions** button opens the **Required Permissions for Pause/Resume and Size Change** modal, which explains how to grant the **Contributor** role to the organization's Service Principal directly in the Azure Portal.

**What it is for:** guiding those who prefer (or need to, due to internal policy) to grant the permission manually in Azure, instead of using the **Add permissions** button.

<figure><picture><source srcset="/files/FwNVvDO2XVof6UAOFJEa" media="(prefers-color-scheme: dark)"><img src="https://3938213054-files.gitbook.io/~/files/v0/b/gitbook-x-prod.appspot.com/o/spaces%2FH2bFRBmIfyK3kwVKbldl%2Fuploads%2Fgit-blob-78c89ba9a0a335d7616183746f2a83e3dfe0c3fd%2Fpm-governanca-capacidades-modal-instrucoes-en.png?alt=media" alt="Required Permissions for Pause/Resume and Size Change modal"></picture><figcaption><p>Permission instructions modal</p></figcaption></figure>

{% hint style="info" %}
Requires the **Administrator** profile.
{% endhint %}

**How to use:**

1. Click **Instructions** on the action bar.
2. In the Azure Portal, open the capacity resource (or the Resource Group/Subscription, if you prefer to grant it at a broader scope).
3. Go to **Access control (IAM) › Add role assignment** and assign the **Contributor** role to your organization's Service Principal. This allows it to read, pause, resume and change the SKU of the capacity.
4. Back in the modal, use **Add permissions** or **Refresh capacities** if needed, and close it.

### Sync with Azure

**What it is:** the **Sync with Azure** button queries Azure Resource Graph and fills in the **Subscription** and **Resource Group** of each capacity.

**What it is for:** it is a prerequisite for pausing, resuming and changing the size (SKU), for the change history and for capturing the capacity cost in Azure Cost Management. It removes the **Not configured** badge from the capacities found.

{% hint style="info" %}
Requires the **Administrator** profile. The Service Principal needs at least **Reader** on the capacities' subscriptions.
{% endhint %}

**How to use:**

1. Click **Sync with Azure**.
2. Read the result in the message, for example "*X* of *Y* matched capacity(ies) updated with Azure data." or "*Y* matched capacity(ies) were already up to date. Nothing to change.". If none is found, the message suggests checking the Service Principal's **Reader** permission.
3. If the **Capacities not synced** warning appears, it lists the capacities that were not located. Click **Request permission** to grant the **Reader** role to the Service Principal on the subscriptions where this is possible (using **your** permission in Azure); Power Monitor then syncs again.
4. If capacities still remain, wait a few minutes (for the permission to propagate in Azure) and click **Sync with Azure** again, or [enter the location manually](#details-tab-and-azure-location).

### Add permissions

**What it is:** the **Add permissions** button uses **your** delegated permission in Azure to add the organization's Service Principal as an **Administrator** of the capacity and grant it the **Contributor** role scoped to the capacity.

**What it is for:** getting capacities ready to be operated by Power Monitor in a single click, without having to open the Azure Portal.

{% hint style="info" %}
Requires the **Administrator** profile in Power Monitor and, in Azure, a role with sufficient permission on the capacity's subscription (Owner, Contributor, User Access Administrator or RBAC Administrator, depending on the action). Capacities in subscriptions where you do not have that role are skipped. Entra ID Global Administrators without these roles can use *Elevate access* in the Azure Portal.
{% endhint %}

**How to use:**

1. Run **Sync with Azure** first: capacities without a Subscription and Resource Group are not eligible.
2. Click **Add permissions**. The **Add permissions to the Service Principal?** confirmation lists the capacities grouped by subscription.
3. Click **Grant permissions** (complete the Azure consent, if prompted).
4. Read the result: **Permissions added successfully** (with the count of capacities on which each permission was granted) or **Permissions not granted on every capacity**, with details per capacity. Subscriptions where you do not have a sufficient role are reported under **Some subscriptions were skipped**.

### Reservations

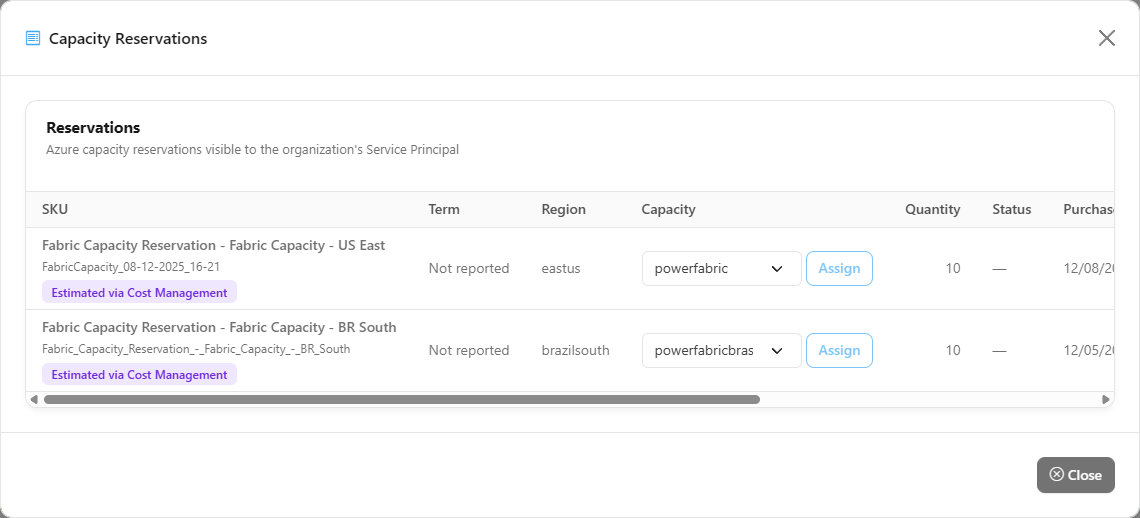
**What it is:** the **Reservations** button opens the **Capacity Reservations** modal with the Azure reservations visible to the organization's Service Principal.

**What it is for:** checking which reservations the organization has, when they expire and how much they cost, and indicating which capacity a reservation belongs to when Power Monitor could not identify it on its own.

<figure><picture><source srcset="/files/qHcbnJBGFwaAlztrhArw" media="(prefers-color-scheme: dark)"><img src="https://3938213054-files.gitbook.io/~/files/v0/b/gitbook-x-prod.appspot.com/o/spaces%2FH2bFRBmIfyK3kwVKbldl%2Fuploads%2Fgit-blob-d3b0d1de910ef0b1ba7bcf614678c9b0795c135f%2Fpm-governanca-capacidades-modal-reservas-en.png?alt=media" alt="Capacity Reservations modal with the list of reservations"></picture><figcaption><p>Capacity Reservations modal</p></figcaption></figure>

| Column                                                  | Description                                                                                                                                  |
| ------------------------------------------------------- | -------------------------------------------------------------------------------------------------------------------------------------------- |
| **SKU**                                                 | Reserved SKU and reservation name. The **Via billing details** or **Estimated via Cost Management** badge indicates where the data came from |
| **Term**                                                | **1 year** or **3 years**                                                                                                                    |
| **Region**                                              | Reservation region                                                                                                                           |
| **Capacity**                                            | Capacity associated with the reservation (or the selector to associate it)                                                                   |
| **Quantity**                                            | Number of reserved units                                                                                                                     |
| **Status**                                              | Reservation status in Azure                                                                                                                  |
| **Purchase Date** / **Expiry Date**                     | Reservation dates. The expiry date gets the **Expired**, **Expiring soon** (less than 30 days) or **Warning** (less than 90 days) badge      |
| **Total Price** / **Monthly Amount** / **Billing Plan** | Amounts and payment method of the reservation                                                                                                |

**How to use:**

1. Click **Reservations** on the action bar (available to all profiles).
2. For reservations with the **Estimated via Cost Management** badge, the **Capacity** column shows a selector. Choose the capacity in **Select a capacity** and click **Assign**. Only capacities from the same subscription and region appear ("No capacity in the same subscription/region" when there are no candidates). The button stays disabled while the choice is the same as the current association.
3. Click **Close**.

### Create cost alert

**What it is:** the **Create alert** button takes you to create a cost alert in [Dashboards › Capacity Cost](/en/power-monitor/dashboards/custo-de-capacidade.md).

**What it is for:** being notified when the cost of a capacity (or of all capacities) exceeds a defined amount.

1. Click **Create alert** on the action bar (Administrator only).
2. You are taken to the alerts screen of [Dashboards › Capacity Cost](/en/power-monitor/dashboards/custo-de-capacidade.md), where you create the alert for a specific capacity or for all of them.

### Row actions menu

**What it is:** the menu opened by the **⋮** button on each row (or by right-clicking the row), with the operations available for that capacity.

**What it is for:** reaching, from the capacity, any tab of the details modal and the immediate operations in Azure.

<figure><picture><source srcset="/files/1WrEvMIRGHDnq5YhF5MG" media="(prefers-color-scheme: dark)"><img src="https://3938213054-files.gitbook.io/~/files/v0/b/gitbook-x-prod.appspot.com/o/spaces%2FH2bFRBmIfyK3kwVKbldl%2Fuploads%2Fgit-blob-2df5ca569cd55aa9d682df9476e18d36c1616d34%2Fpm-governanca-capacidades-menu-acoes-en.png?alt=media" alt="Actions menu of a capacity with the Open details submenu"></picture><figcaption><p>Actions menu with the Open details submenu</p></figcaption></figure>

| Item                                      | What it does                                                                                                                                           |
| ----------------------------------------- | ------------------------------------------------------------------------------------------------------------------------------------------------------ |
| **Open details**                          | Opens the details modal. The submenu goes directly to each tab: *Details*, *Schedule On/Off*, *Schedule SKU Change*, *Autoscale* and *Schedule Alerts* |
| **Pause Capacity** / **Turn On Capacity** | The label changes according to the current state. Asks for confirmation and runs the action immediately in Azure                                       |
| **Change size (SKU)**                     | Opens the *Change capacity size (SKU)* modal to change the SKU now, with a cost preview                                                                |
| **Change History**                        | Opens the resource's activity log in Azure (only appears when the capacity has a Subscription and Resource Group configured)                           |

**How to use:**

1. Click **⋮** on the capacity row.
2. Click the desired item or, to go directly to a tab of the modal, hover over **Open details** and choose the tab in the submenu.

{% hint style="warning" %}
For trial capacities (**FT1**, **FT64**, etc.), the Fabric API does not allow pausing, resuming or changing the size (SKU). For them, the menu shows only **Open details** (only the *Details* tab) and, when applicable, **Change History**. **PP3** (Premium Per User) capacities are not listed on this screen.
{% endhint %}

{% hint style="info" %}
On **F0** (on-demand) capacities, **Pause Capacity** and **Change size (SKU)** appear disabled, with the hint "Unavailable for F0: an on-demand capacity cannot be paused, resumed, resized or scheduled.".
{% endhint %}

### Pause and turn on the capacity

**What it is:** the **Pause Capacity** and **Turn On Capacity** items in the **⋮** menu suspend or turn the capacity back on in Azure immediately.

**What it is for:** stopping the charges for an idle capacity (for example, a development environment at the end of the day) or turning a paused capacity back on without going into the Azure Portal.

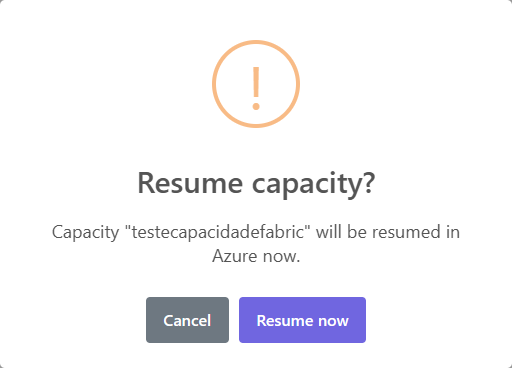
<figure><picture><source srcset="/files/Zpjn1iahg5049V1AZTXJ" media="(prefers-color-scheme: dark)"><img src="https://3938213054-files.gitbook.io/~/files/v0/b/gitbook-x-prod.appspot.com/o/spaces%2FH2bFRBmIfyK3kwVKbldl%2Fuploads%2Fgit-blob-d70403502740943d7ee3c77e69dee779e1982cb9%2Fpm-governanca-capacidades-confirmar-pausar-en.png?alt=media" alt="Confirmation before pausing or resuming the capacity"></picture><figcaption><p>Pause/resume confirmation</p></figcaption></figure>

{% hint style="info" %}
Requires the **Administrator** profile and a prepared capacity (see [How to prepare a capacity](#how-to-prepare-a-capacity-to-be-operated-by-power-monitor)). Not available for **FT** capacities.
{% endhint %}

**How to use:**

1. In the capacity's **⋮** menu, click **Pause Capacity** (if it is active) or **Turn On Capacity** (if it is paused).
2. In the **Pause capacity?** or **Resume capacity?** confirmation, click **Pause now** or **Resume now** (or **Cancel**).
3. The message "Capacity paused successfully." or "Capacity resumed successfully." confirms the execution and the list is reloaded with the new state.

**Rules:**

* When you pause, **the associated workspaces become unavailable until it resumes**.
* If the capacity was already in the requested state, the screen shows "The capacity was already in the requested state.". In case of error, the **Could not complete the action** warning explains the reason.
* Every execution is recorded in [Audit › Capacity Actions](/en/power-monitor/auditoria/acoes-de-capacidade.md).

### Change size now (immediate SKU change)

**What it is:** the **Change size (SKU)** item in the **⋮** menu opens the **Change capacity size (SKU)** modal, which changes the capacity's SKU immediately and shows the cost impact beforehand.

**What it is for:** absorbing an unexpected load (increasing the SKU) or reducing cost after a peak (decreasing the SKU), knowing how much the change costs per hour and per month.

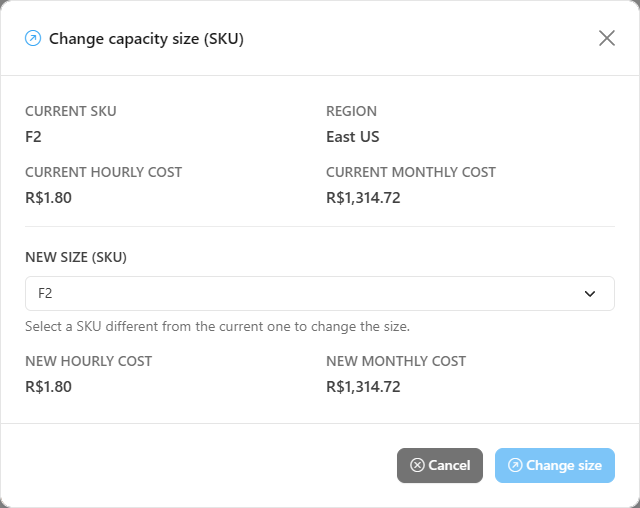
<figure><picture><source srcset="/files/cQZnRaUmWzVr1Q0xuZl7" media="(prefers-color-scheme: dark)"><img src="https://3938213054-files.gitbook.io/~/files/v0/b/gitbook-x-prod.appspot.com/o/spaces%2FH2bFRBmIfyK3kwVKbldl%2Fuploads%2Fgit-blob-8f3288dcf3ac4558c03cd3064c1251495094cbb4%2Fpm-governanca-capacidades-modal-alterar-tamanho-en.png?alt=media" alt="Change capacity size (SKU) modal with the current SKU and the current cost"></picture><figcaption><p>Change capacity size (SKU) modal</p></figcaption></figure>

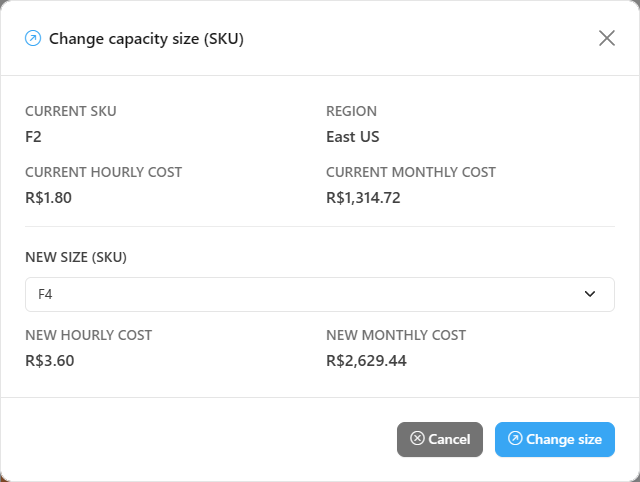
<figure><picture><source srcset="/files/SFCGkAOgi5b22eq02CqI" media="(prefers-color-scheme: dark)"><img src="https://3938213054-files.gitbook.io/~/files/v0/b/gitbook-x-prod.appspot.com/o/spaces%2FH2bFRBmIfyK3kwVKbldl%2Fuploads%2Fgit-blob-202062baa77a198d28fbd01fa325e0dba5cebb89%2Fpm-governanca-capacidades-modal-alterar-tamanho-previa-en.png?alt=media" alt="Change capacity size (SKU) modal with a new SKU selected and the new cost preview"></picture><figcaption><p>Cost preview of the new SKU</p></figcaption></figure>

{% hint style="info" %}
Requires the **Administrator** profile and a prepared capacity. Not available for **FT** capacities.
{% endhint %}

**How to use:**

{% stepper %}
{% step %}

#### Open the modal

In the capacity's **⋮** menu, click **Change size (SKU)**. The modal shows the **Current SKU**, the **Region** and the current cost per hour and per month.
{% endstep %}

{% step %}

#### Choose the new SKU

Select the **New size (SKU)**. The modal calculates the **New hourly cost** and the **New monthly cost**. While the selected SKU is the same as the current one, the **Change size** button stays disabled.
{% endstep %}

{% step %}

#### Confirm

Click **Change size**. The **Confirm size change** confirmation shows the from/to and the estimated costs; click **Confirm change**.
{% endstep %}

{% step %}

#### Check the result

The message "Capacity size changed to *SKU* successfully." confirms the change. If the capacity was already on the selected SKU, **No change needed** appears.
{% endstep %}
{% endstepper %}

**How it works:**

* Available SKUs: **F2 to F2048** for Fabric capacities and **A1 to A8** for Power BI Embedded.
* Prices are Microsoft's list prices (Azure Retail Prices) for the region, converted to the organization's currency. The monthly cost considers 730 hours. When the conversion is not available, the amount appears in USD.
* The amount is an estimate without reservation discounts or commercial agreements.

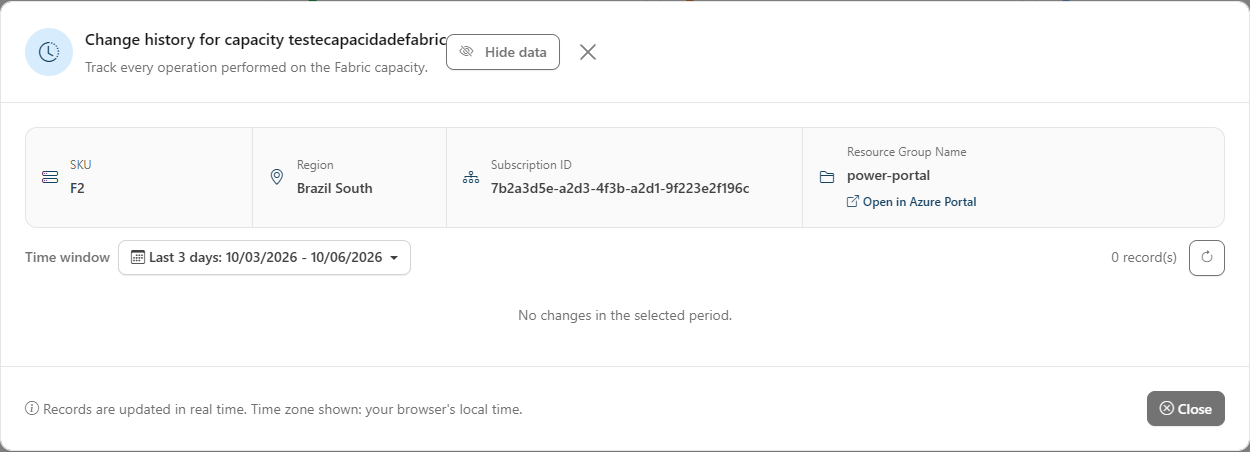
### Change History

**What it is:** the **Change History** item in the **⋮** menu opens the administrative operations recorded in the **Azure Activity Log** of the capacity resource.

**What it is for:** finding out who paused, resumed, changed the size (SKU) of or modified the capacity in Azure (through Power Monitor, the Azure Portal or automations) and when.

<figure><picture><source srcset="/files/j22yhzORzxLBDyaaVEVz" media="(prefers-color-scheme: dark)"><img src="https://3938213054-files.gitbook.io/~/files/v0/b/gitbook-x-prod.appspot.com/o/spaces%2FH2bFRBmIfyK3kwVKbldl%2Fuploads%2Fgit-blob-1afb4677eebc898e17086aa5f6fe08422883b985%2Fpm-governanca-capacidades-modal-historico-alteracoes-en.png?alt=media" alt="Capacity Change History modal"></picture><figcaption><p>Change history from the Azure Activity Log</p></figcaption></figure>

<figure><picture><source srcset="/files/pneSbkljQrTAxNcEot3D" media="(prefers-color-scheme: dark)"><img src="https://3938213054-files.gitbook.io/~/files/v0/b/gitbook-x-prod.appspot.com/o/spaces%2FH2bFRBmIfyK3kwVKbldl%2Fuploads%2Fgit-blob-b0caeb0e27568b904a239643e6b88394e612a137%2Fpm-governanca-capacidades-historico-periodo-en.png?alt=media" alt="Time window selector open in the change history"></picture><figcaption><p>Time window selector</p></figcaption></figure>

{% hint style="info" %}
Available to all profiles, only for capacities with a Subscription and Resource Group configured.
{% endhint %}

**How to use:**

1. In the capacity's **⋮** menu, click **Change History**.
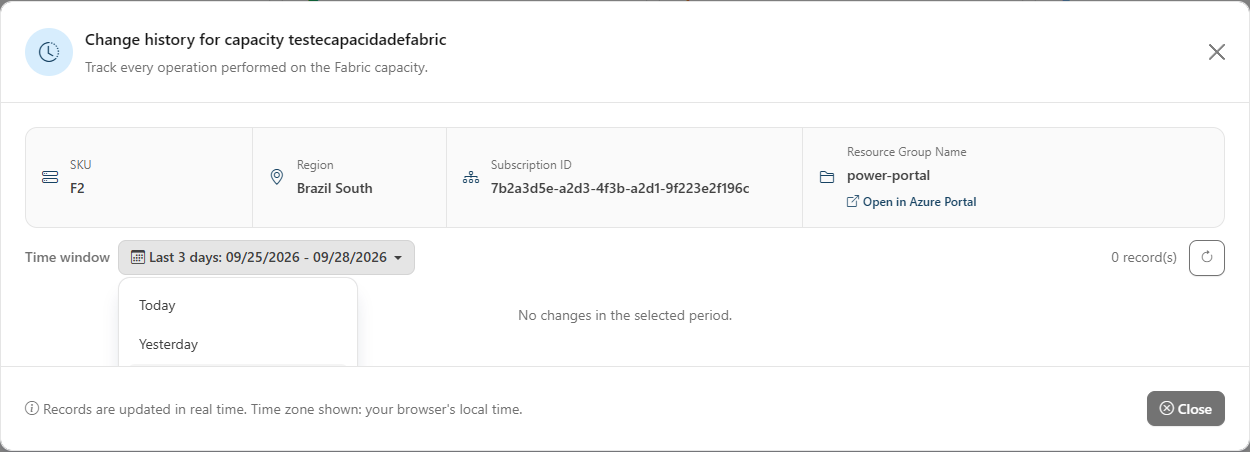
2. In **Time window**, choose the range: **Today**, **Yesterday**, **Last 3 days** (default), 7, 14, 30, 60 or 90 days. The record count appears next to it; use the refresh button to reload the list. The **Hide data** button at the top of the modal masks the names and e-mails in the **Caller** column.
3. Check the **Date/Time**, **Operation**, **Status**, **Message** and **Caller** columns.
4. To view the resource in Azure, click **Open in Azure Portal** on the card with SKU, region, subscription and resource group.

**Rules:** times are in your browser's time zone. If the Service Principal does not have access to the resource, the modal says so and offers the **Grant permission** button.

### Details tab and Azure location

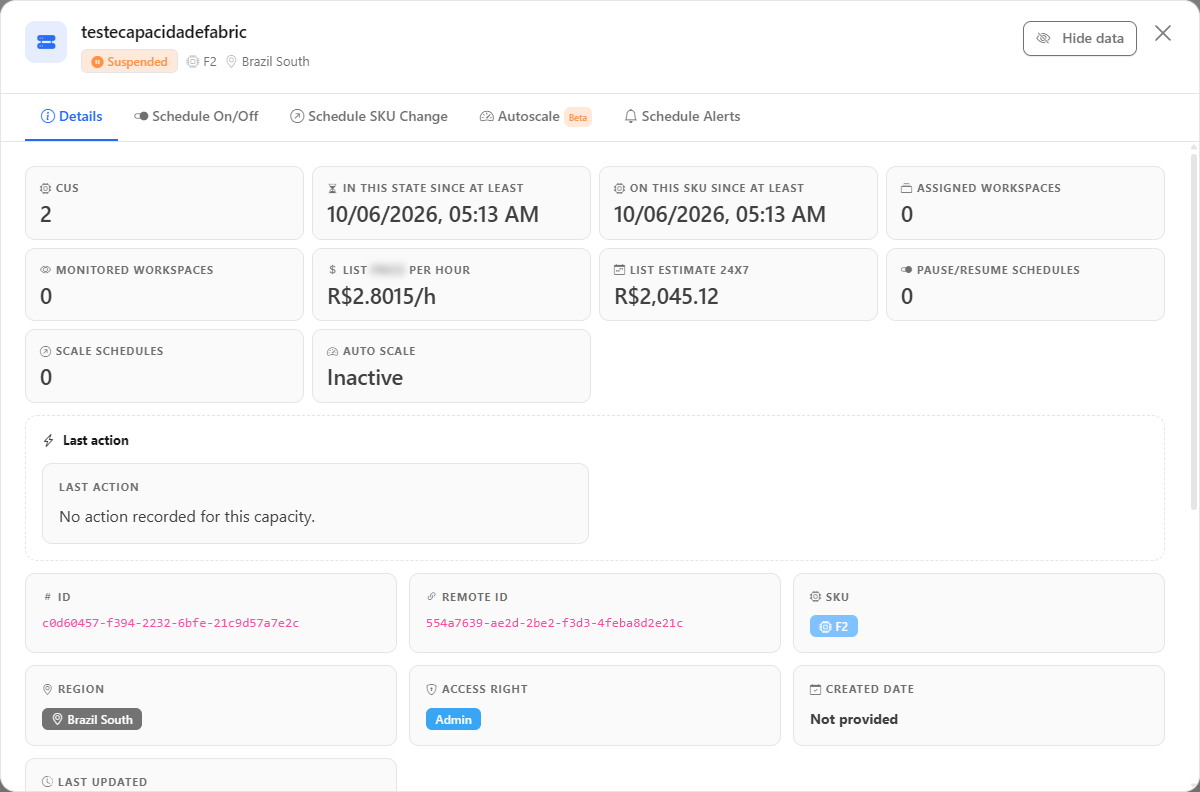
**What it is:** the first tab of the **Capacity Details** modal, opened by clicking the row or through **⋮ › Open details**. At the top are the indicators and the **Last action** block; below them, ID, Remote ID, SKU, Region, Access Right, Created Date, Last Updated, **Trial expiration** (on trial capacities) and the list of **Administrators** (users and applications, the latter identified as *Application:* followed by the abbreviated ID). The modal header repeats the state, SKU and region and has the **Hide data** button, which masks the administrators' names (useful for sharing screenshots).

**What it is for:** viewing the complete record of the capacity, knowing how long it has been in its current state and SKU, how much it costs at list price and what the last action run on it was and, when necessary, manually entering where it is located in Azure.

<figure><picture><source srcset="/files/H4yq6HzqZHEwqnmzNW8a" media="(prefers-color-scheme: dark)"><img src="https://3938213054-files.gitbook.io/~/files/v0/b/gitbook-x-prod.appspot.com/o/spaces%2FH2bFRBmIfyK3kwVKbldl%2Fuploads%2Fgit-blob-64fda7c9a2ef687baca4ed6571afa0ca237da855%2Fpm-governanca-capacidades-modal-detalhes-en.png?alt=media" alt="Details tab of the capacity modal with the indicators, the Last action block and the capacity record"></picture><figcaption><p>Details tab</p></figcaption></figure>

The indicators follow the [common Overview structure](/en/power-monitor/governanca/relatorios.md#the-overview-tab); each one only appears when there is data:

| Indicator                                                         | What it shows                                                                                                                                                                                                                                         |
| ----------------------------------------------------------------- | ----------------------------------------------------------------------------------------------------------------------------------------------------------------------------------------------------------------------------------------------------- |
| **CUs**                                                           | Capacity units of the F SKU (e.g. F64 = 64 CUs). For A, EM and P SKUs, it appears as a reference, for example *CUs (reference: A4 ≈ F64)*: it is the equivalence published by Microsoft, not the exact capacity. Does not apply to PP3, trial and F0. |
| **In this state since** / **On this SKU since**                   | Since when the capacity has been in its current state and SKU. When the label says *since at least*, Power Monitor only observed the capacity from that date on and it may have been like this for longer.                                            |
| **Assigned workspaces** / **Monitored workspaces**                | How many workspaces that you can see are on the capacity, and how many of them are monitored.                                                                                                                                                         |
| **List price per hour** / **List estimate 24x7**                  | List price per hour for the SKU and region, in the organization's currency, and that price times 730 hours, as if the capacity ran all month. They ignore pauses, discounts and the actual bill. They do not appear for F0.                           |
| **Pause/resume schedules** / **Scale schedules** / **Auto scale** | How many schedules exist and whether automatic scaling is **Active** or **Inactive**.                                                                                                                                                                 |

* **Last action:** the last action recorded for the capacity (pause, resume, SKU change), with **Outcome**, **Executed at**, **Responsible**, **Source**, **Transition** and **Message**, or "No action recorded for this capacity.". The full history is in [Capacity Actions](/en/power-monitor/auditoria/acoes-de-capacidade.md).
* **Trial expiration:** on trial capacities, the expiration badge and the date (UTC); when the date is estimated from the creation date, the field says so.
* **F0 capacity:** a block at the top explains the **Billing model** (*Per consumption (on-demand)*), that the price multiplier is defined by Microsoft and that there is no utilization %, because F0 has no provisioned CU limit.
* **Removed capacity:** when the capacity no longer exists, the banner "Removed from Fabric/Power BI since *date*." appears at the top.

The **Azure Resource Location** block lets you enter the **Subscription ID**, the **Resource Group Name** and the **Resource Provider** (*Microsoft Fabric capacity* or *Power BI Premium/Embedded capacity (legacy)*). Use it when the Service Principal has permission only on the capacity resource (and not on the entire subscription), a situation in which **Sync with Azure** cannot locate it. The block does not appear for **FT** capacities.

**How to enter the location manually** (**Administrator** only):

1. Open the capacity details on the **Details** tab.
2. In the **Azure Resource Location** block, fill in **Subscription ID** and **Resource Group Name** and choose the **Resource Provider**.
3. Click **Save**. The message "Subscription ID / Resource Group Name saved successfully." confirms the save and the table row no longer displays the **Not configured** badge.

#### Overage

**What it is:** the read-only **Overage** section of the **Details** tab, which shows whether the capacity can consume beyond its purchased SKU. With overage enabled, the excess is billed in CU-hours up to the limit set by the capacity administrator in Fabric.

**What it is for:** knowing, without opening the Fabric portal, which capacities can generate extra charges for consumption above the SKU and what the ceiling of those charges is.

<figure><picture><source srcset="/files/a6v0kNCJtEd7VmVcS2U3" media="(prefers-color-scheme: dark)"><img src="https://3938213054-files.gitbook.io/~/files/v0/b/gitbook-x-prod.appspot.com/o/spaces%2FH2bFRBmIfyK3kwVKbldl%2Fuploads%2Fgit-blob-775245f2af18617c68d45896e0c7c76b971f6891%2Fpm-governanca-capacidades-modal-overage-en.png?alt=media" alt="Overage section of the Details tab of an F capacity"></picture><figcaption><p>Overage section</p></figcaption></figure>

**How it works:**

| Field          | What it shows                                                             |
| -------------- | ------------------------------------------------------------------------- |
| **State**      | **Enabled**, **Disabled** or **Unknown** (a new state reported by Fabric) |
| **Limit**      | The ceiling of the excess, in *N CU-hours* (only when overage is enabled) |
| **Checked at** | Date and time of the last read                                            |

* **Who reads it:** the [capacity scan](/en/power-monitor/mapeamento/capacidades.md) reads the overage configuration of **F** capacities with provisioned CUs (F2, F64, etc.). On trial, F0, Premium Per User, Power BI Embedded (A and EM) and Premium (P) capacities, the section shows **Not applicable to this SKU.**
* **Not read yet:** on an F capacity that the scan has not read yet, **Not checked yet. Run the capacity scan.** is shown.
* **Permission:** the Service Principal must be a **capacity administrator** to read the overage. Without it, **The Service Principal must be a capacity admin to read the overage.** is shown.
* **Other messages:** **Fabric does not offer the overage configuration for this capacity.** and, when the read fails, **The overage configuration could not be read in the last check. The next capacity scan will try again.** (the last value read remains in effect).
* **Read-only:** Power Monitor does not turn overage on or off or change its limit; that is done in the Fabric portal. The overage configuration is a Microsoft preview feature.
* With overage enabled, the table row gets the **Overage** badge and the **Workspace management** card of the workspaces on that capacity shows the [Capacity overage](/en/power-monitor/governanca/workspaces.md#workspace-management) row.

### Schedule On/Off tab

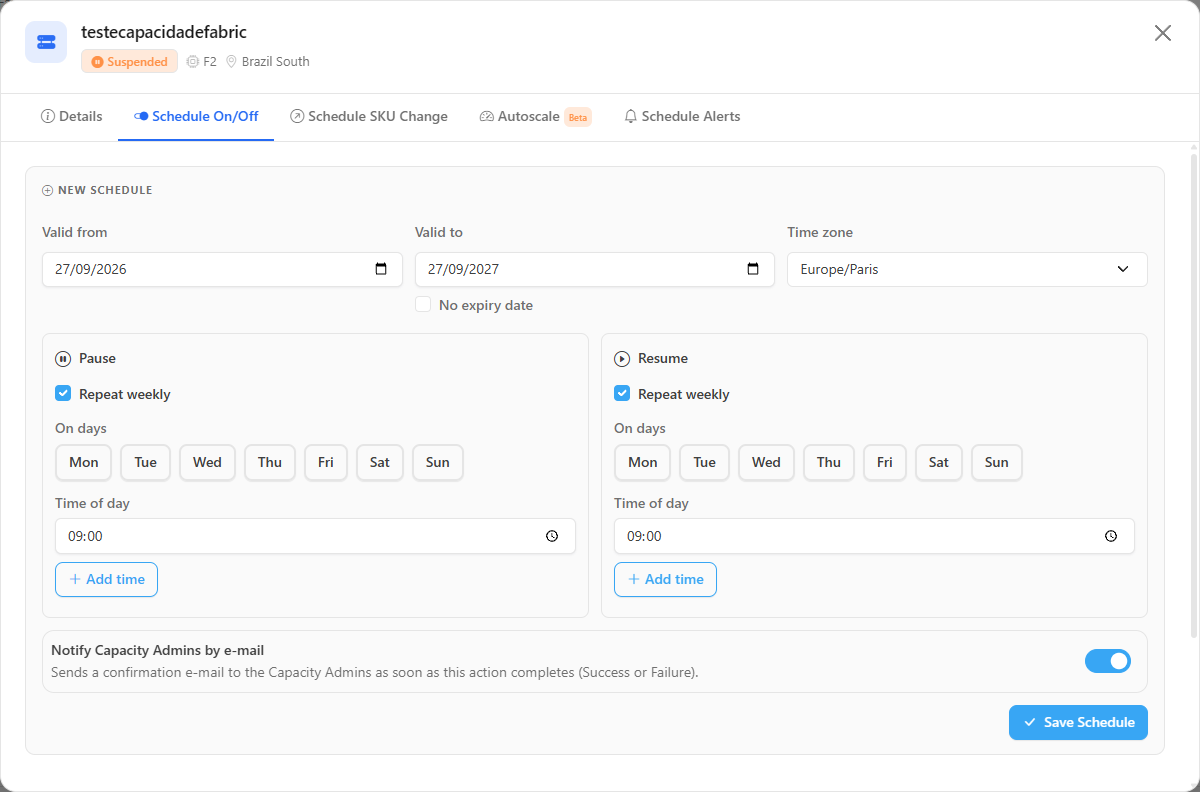
**What it is:** a tab of the details modal that creates recurring (or one-time) rules to **Pause** and **Resume** the capacity, and lists the existing schedules. The number of schedules appears next to the tab name.

**What it is for:** reducing cost by turning the capacity off automatically at night and on weekends, without relying on someone remembering to pause it.

<figure><picture><source srcset="/files/XjodHUUmluUxyi8tIdD7" media="(prefers-color-scheme: dark)"><img src="https://3938213054-files.gitbook.io/~/files/v0/b/gitbook-x-prod.appspot.com/o/spaces%2FH2bFRBmIfyK3kwVKbldl%2Fuploads%2Fgit-blob-377ef79c2e75ef7e27dd00730254475f846a1856%2Fpm-governanca-capacidades-modal-agendar-ligar-desligar-en.png?alt=media" alt="Schedule On/Off tab"></picture><figcaption><p>Pause and resume schedule</p></figcaption></figure>

{% hint style="info" %}
Requires the **Administrator** profile and a prepared capacity. Not available for **FT** capacities.
{% endhint %}

**How to use:**

{% stepper %}
{% step %}

#### Open the schedule tab

In the capacity's **⋮** menu, choose **Open details › Schedule On/Off**.
{% endstep %}

{% step %}

#### Set the validity and time zone

In **New Schedule**, check **Valid from** and enter **Valid to**, or select **No expiry date**. Check the **Time zone** (default: your browser's).
{% endstep %}

{% step %}

#### Configure the pause

In **Pause**, click the days in **On days** (for example, Mon to Fri) and enter the **Time of day** (for example, 20:00). Use **Add time** for more than one time on the same day. Keep **Repeat weekly** selected for a recurring rule; when cleared, the rule runs only once.
{% endstep %}

{% step %}

#### Configure the resume

In **Resume**, select the days (for example, Mon to Fri) and the time (for example, 07:00).
{% endstep %}

{% step %}

#### Save

Keep or clear **Notify Capacity Admins by e-mail** (selected by default; sends an e-mail to the capacity administrators when the action completes, whether successfully or not) and click **Save Schedule**. The message "Schedule created successfully." confirms the save and the schedule appears in the list below the form.
{% endstep %}
{% endstepper %}

**Rules:**

* **Valid from / Valid to** is the window in which the rule is active, not the moment of execution.
* You must configure at least **Pause** or **Resume**; each side is individually optional.
* Validations that prevent saving: no day selected in either Pause or Resume ("Configure at least Pause or Resume."), incomplete validity ("Enter the validity start and end dates.") and Pause and Resume on the same day and time ("Pause and Resume cannot be scheduled for the exact same day and time.").
* For each schedule, the list shows the Pause and Resume summary, the last execution of each action, the validity window and who created it.
* Schedules cannot be edited. To change one, delete it and create another: click the schedule's trash button. Deletion is immediate, without confirmation, and is confirmed by "Schedule removed.".
* To be notified if the capacity is turned back on outside its hours, also configure the [schedule alert](#schedule-alerts-tab).

### Schedule SKU Change tab

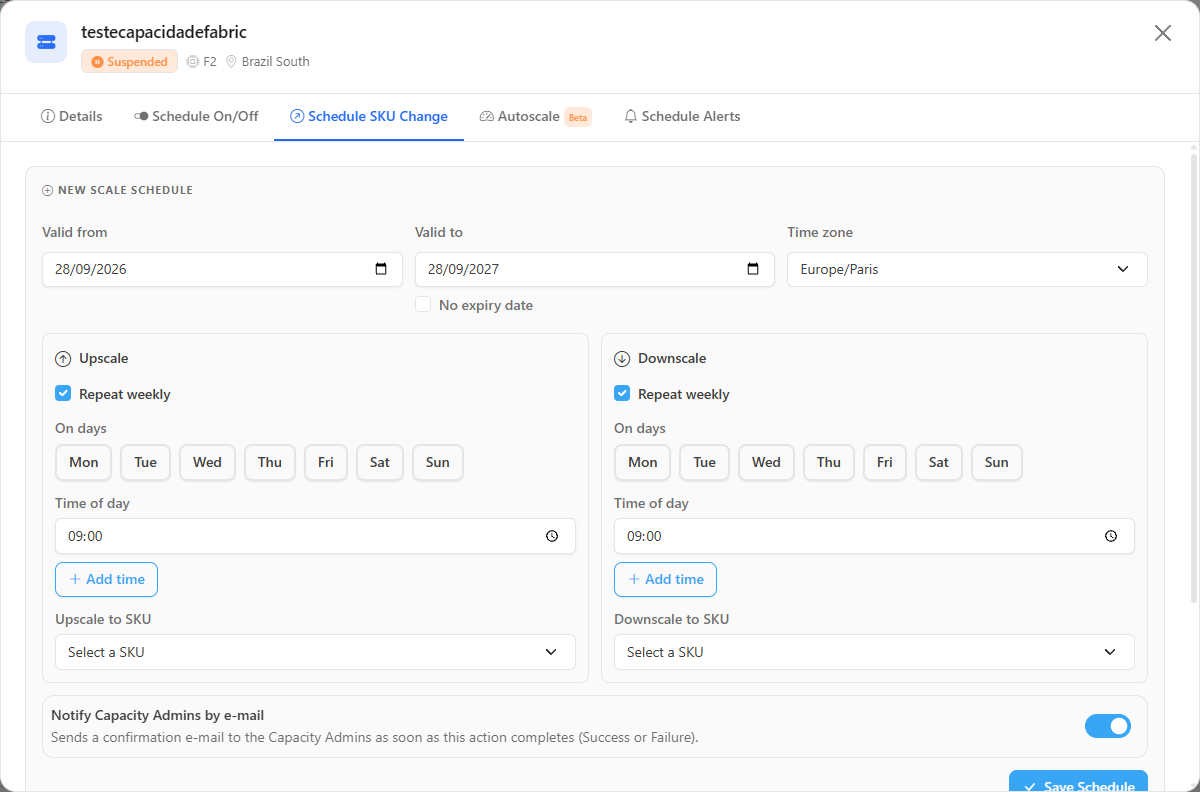
**What it is:** a tab of the details modal that schedules a recurring **Upscale** (SKU increase) and **Downscale** (SKU reduction), and lists the existing scale schedules.

**What it is for:** increasing the capacity before known load windows (month-end close, overnight loads) and reducing it afterwards, paying for the larger SKU only when it is needed.

<figure><picture><source srcset="/files/vGLUpfGPKvl0ip9PlGk1" media="(prefers-color-scheme: dark)"><img src="https://3938213054-files.gitbook.io/~/files/v0/b/gitbook-x-prod.appspot.com/o/spaces%2FH2bFRBmIfyK3kwVKbldl%2Fuploads%2Fgit-blob-a46688a866dfe68362def6b36af25295390c5094%2Fpm-governanca-capacidades-modal-agendar-sku-en.png?alt=media" alt="Schedule SKU Change tab with the Upscale and Downscale blocks"></picture><figcaption><p>SKU change schedule</p></figcaption></figure>

{% hint style="info" %}
Requires the **Administrator** profile and a prepared capacity. Not available for **FT** capacities.
{% endhint %}

**How to use:**

{% stepper %}
{% step %}

#### Open the tab

In the capacity's **⋮** menu, choose **Open details › Schedule SKU Change**.
{% endstep %}

{% step %}

#### Set the validity and time zone

In **New Scale Schedule**, enter **Valid from**, **Valid to** (or **No expiry date**) and the **Time zone**.
{% endstep %}

{% step %}

#### Configure the Upscale

In **Upscale**, select the days and the time, and choose the SKU in **Upscale to SKU**.
{% endstep %}

{% step %}

#### Configure the Downscale

In **Downscale**, select the days and the time, and choose the SKU in **Downscale to SKU**.
{% endstep %}

{% step %}

#### Save

Keep or clear **Notify Capacity Admins by e-mail** and click **Save Schedule**. The message "Scale schedule created successfully." confirms the save.
{% endstep %}
{% endstepper %}

**Rules:**

* Unlike the pause schedule, **both sides are required**: each scale schedule has an Upscale and a Downscale, with days of the week and a target SKU.
* Validations that prevent saving: incomplete validity, no days selected on one of the sides ("Select at least one day of the week."), target SKU not chosen ("Provide the Upscale target SKU." / "Provide the Downscale target SKU.") and Upscale and Downscale on the same day and time.
* Deletion works as in the previous tab (trash button, no confirmation, message "Scale schedule removed.").

{% hint style="danger" %}
**Downscale impact warning** (displayed at the top of the tab): reducing the capacity can cause severe slowness or query rejection (*throttling*) if there is accumulated consumption pending smoothing (*carryforward*). Large loads running under a smaller SKU may fail due to lack of memory.
{% endhint %}

### Autoscale tab

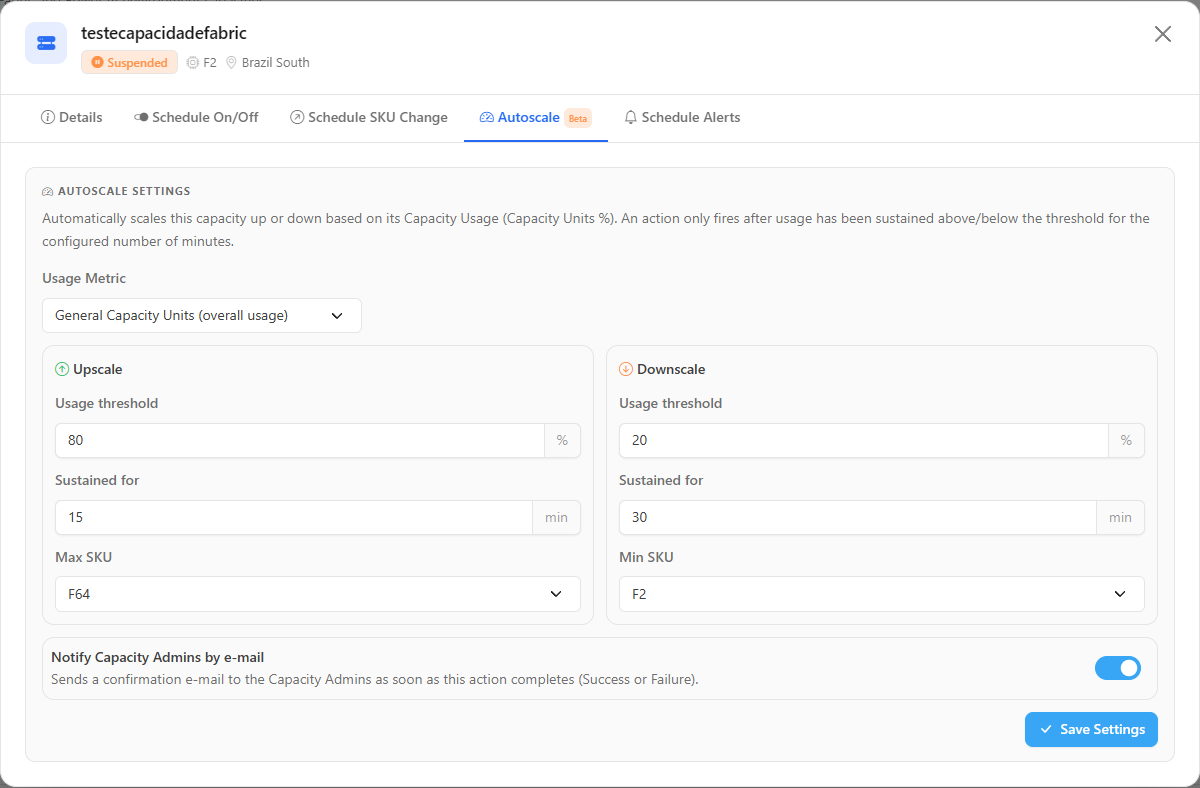
**What it is:** a tab of the details modal (marked as **Beta**) that automatically increases or reduces the SKU based on Capacity Units usage.

**What it is for:** reacting on its own to sustained overloads, raising the SKU when usage stays high for a while and returning to the smaller size when usage drops, within a ceiling and a floor defined by you.

<figure><picture><source srcset="/files/MXigva800EQA8cELC3cC" media="(prefers-color-scheme: dark)"><img src="https://3938213054-files.gitbook.io/~/files/v0/b/gitbook-x-prod.appspot.com/o/spaces%2FH2bFRBmIfyK3kwVKbldl%2Fuploads%2Fgit-blob-92a2000bdc8c7a2ffee14063970dfb795b5dab69%2Fpm-governanca-capacidades-modal-escala-automatica-en.png?alt=media" alt="Autoscale tab with the Upscale and Downscale thresholds"></picture><figcaption><p>Autoscale configuration</p></figcaption></figure>

| Field                                | Default                      | Description                                                                             |
| ------------------------------------ | ---------------------------- | --------------------------------------------------------------------------------------- |
| **Usage Metric**                     | General Capacity Units       | *General Capacity Units (overall usage)* or *Background Capacity Usage*                 |
| **Upscale › Usage threshold**        | 80%                          | Usage percentage that triggers the increase                                             |
| **Upscale › Sustained for**          | 15 min                       | Time usage must remain above the threshold                                              |
| **Max SKU**                          | F64 (Fabric) / A6 (Embedded) | Ceiling for scaling up                                                                  |
| **Downscale › Usage threshold**      | 20%                          | Usage percentage that triggers the reduction (must be lower than the upscale threshold) |
| **Downscale › Sustained for**        | 30 min                       | Time usage must remain below the threshold                                              |
| **Min SKU**                          | F2 (Fabric) / A1 (Embedded)  | Floor for scaling down (cannot be greater than the Max SKU)                             |
| **Notify Capacity Admins by e-mail** | Selected                     | Sends an e-mail to the capacity administrators when a scale action completes            |

{% hint style="info" %}
Requires the **Administrator** profile, a prepared capacity and active [capacity consumption monitoring](/en/power-monitor/monitoramento/capacidades/ativar-monitoramento-de-capacidade.md). Not available for **FT** capacities.
{% endhint %}

**How to use:**

{% stepper %}
{% step %}

#### Open the tab

In the capacity's **⋮** menu, choose **Open details › Autoscale**.
{% endstep %}

{% step %}

#### Choose the metric

In **Usage Metric**, choose **General Capacity Units (overall usage)** or **Background Capacity Usage**.
{% endstep %}

{% step %}

#### Configure the thresholds

In **Upscale**, enter the **Usage threshold** (%), the **Sustained for** time (min) and the **Max SKU**. In **Downscale**, enter the threshold, the time and the **Min SKU**. The Downscale threshold must be lower than the Upscale threshold, and the Min SKU cannot be greater than the Max SKU.
{% endstep %}

{% step %}

#### Save

Keep or clear **Notify Capacity Admins by e-mail** and click **Save Settings**. The message "Autoscale settings saved successfully." confirms the save and the operation and impact notice is displayed at the top of the tab.
{% endstep %}
{% endstepper %}

**Rules:**

* Each capacity has at most one autoscale rule; saving again updates the existing rule. The tab shows the date of the **last scale action** and who created the rule.
* To turn it off, click **Remove Autoscale**. Removal is immediate and confirmed by the message "Autoscale removed for this capacity.".

{% hint style="warning" %}
**Before enabling, consider:** usage metrics arrive with a delay of 5 to 15 minutes or more, so autoscale reacts to **sustained** overloads, not to instantaneous peaks. Always configure a **Max SKU** to avoid unexpected costs and keep a good margin between the scale-up and scale-down thresholds to avoid oscillation (*flapping*).
{% endhint %}

### Schedule Alerts tab

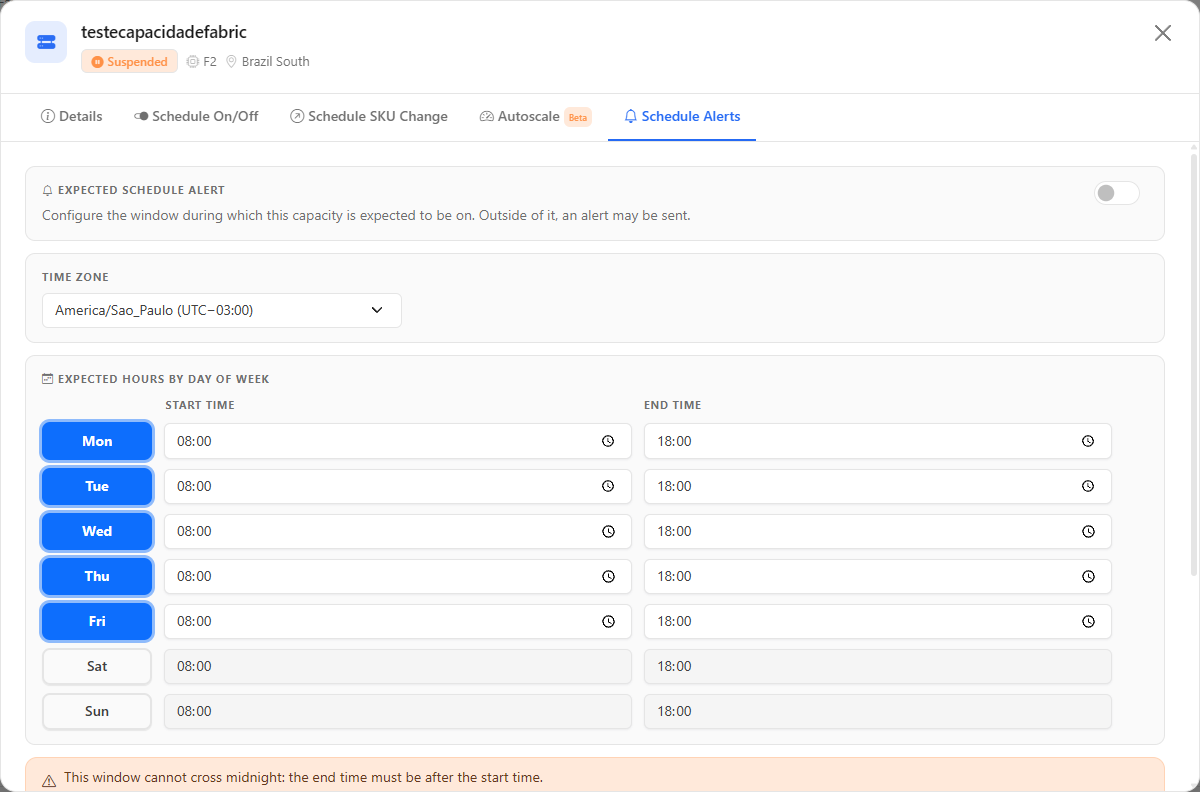
**What it is:** a tab of the details modal that defines the window in which the capacity **should** be running. Outside it, if the capacity is running, an alert is opened and sent by e-mail.

**What it is for:** being notified when a capacity is running (and generating cost) outside the hours in which it should operate, for example when someone turned it back on manually at night or a pause schedule failed.

<figure><picture><source srcset="/files/H8VEBJByQzlrT4l8eZ9h" media="(prefers-color-scheme: dark)"><img src="https://3938213054-files.gitbook.io/~/files/v0/b/gitbook-x-prod.appspot.com/o/spaces%2FH2bFRBmIfyK3kwVKbldl%2Fuploads%2Fgit-blob-0c353e7081f3e0b600295141ce7e418c2fdce57d%2Fpm-governanca-capacidades-modal-alertas-horarios-en.png?alt=media" alt="Schedule Alerts tab of the capacity modal"></picture><figcaption><p>Alert for a capacity running outside its expected hours</p></figcaption></figure>

{% hint style="info" %}
Requires the **Administrator** profile and active [capacity consumption monitoring](/en/power-monitor/monitoramento/capacidades/ativar-monitoramento-de-capacidade.md). Not available for **FT** capacities.
{% endhint %}

**How to use:**

{% stepper %}
{% step %}

#### Open the tab

In the capacity's **⋮** menu, choose **Open details › Schedule Alerts**.
{% endstep %}

{% step %}

#### Turn on the alert

On the **Expected Schedule Alert** card, turn on the switch (off by default) and check the **Time zone**.
{% endstep %}

{% step %}

#### Set the window for each day

In **Expected hours by day of week**, click the days on which the capacity should operate and adjust the **Start time** and **End time** (default 08:00–18:00). An unselected day means that the capacity should not be running on that day.
{% endstep %}

{% step %}

#### Set the re-notification and the recipients

Enter the **Re-notification frequency (minutes)**, between 30 and 240. Select **Send e-mails to system administrators** and/or **Notify other users**; in the latter case, type each address in **Additional e-mails** and press **Enter**.
{% endstep %}

{% step %}

#### Save

Click **Save Alert**. The message "Schedule alert saved successfully." confirms the save.
{% endstep %}
{% endstepper %}

**How it works:**

* The window cannot cross midnight: the end time must be after the start time on each selected day.
* While the situation persists, the e-mail is resent at the configured interval, without opening a new alert.
* When the capacity is turned off or returns to within the window, the alert is resolved and a "\[RESOLVIDO]" (resolved) e-mail is sent. Capacities in this situation also appear in the **Capacities Outside Expected Schedule** panel of the Monitoring Dashboard (TV mode).
* Validations that prevent saving: no day selected, an invalid window on some day, re-notification frequency outside the range and **Notify other users** selected without any e-mail.

## How to prepare a capacity to be operated by Power Monitor

To pause, resume, change the size (SKU) (manually, by schedule or by autoscale) or view the change history, the capacity must have a known Azure location and the organization's Service Principal needs the **Contributor** role on it. This flow combines several of the features above.

{% hint style="info" %}
Requires the **Administrator** profile in Power Monitor. Permission grants use **your** identity in Azure: you need a role such as Owner, User Access Administrator or RBAC Administrator on the capacity's subscription.
{% endhint %}

{% stepper %}
{% step %}

#### Locate the resource in Azure

Click **Sync with Azure** and handle the **Capacities not synced** warning, if it appears (see [Sync with Azure](#sync-with-azure)). Alternatively, [enter the location manually](#details-tab-and-azure-location).
{% endstep %}

{% step %}

#### Grant the operation permission

Click **Add permissions** and confirm with **Grant permissions** (see [Add permissions](#add-permissions)). If you prefer the Azure Portal, follow the **Instructions** modal.
{% endstep %}

{% step %}

#### Confirm

Click **Refresh capacities** in the **Instructions** modal, or use **Run now** in *Mapping › Capacities*. The **Not configured** badge should disappear from the capacity row, and the **Pause Capacity**/**Turn On Capacity** and **Change size (SKU)** items start working.
{% endstep %}
{% endstepper %}

## Rules and behavior

* **Inventory source:** the list of capacities comes from the [Capacity Scan](/en/power-monitor/mapeamento/capacidades.md). The **Refresh capacities** button in the **Instructions** modal and **Run now** in *Mapping › Capacities* force a new run.
* **How actions reach Azure:** pause, resume and size change (SKU) (manual, scheduled or automatic) are executed by the **organization's Service Principal** via Azure Resource Manager. That is why it needs the **Contributor** role on the capacity resource (or on the resource group/subscription), and the capacity must have a known **Subscription** and **Resource Group** (via **Sync with Azure** or manual entry on the *Details* tab).
* **Permissions with your identity:** **Add permissions** and **Request/Grant permission** use **your** delegated permission in Azure. Capacities in subscriptions where you do not have a sufficient role are skipped.
* **Execution frequency:** pause/resume and SKU schedules are checked **every minute**; autoscale and schedule alerts are evaluated **every 5 minutes**.
* **Schedule alerts** are only evaluated for capacities with active consumption monitoring. If the capacity monitoring is turned off, the e-mails are no longer sent.
* **Audit:** every action attempt (manual, scheduled or automatic, successful or failed) is recorded in [Audit › Capacity Actions](/en/power-monitor/auditoria/acoes-de-capacidade.md), with who executed it or configured the rule and the capacity consumption at that moment.
* **Hidden or restricted capacities:** **PP3** capacities do not appear on the screen or in the cards; **FT** (trial) capacities do not allow actions.
* **Overage:** read by the capacity scan on F capacities with provisioned CUs, with the Service Principal as capacity administrator, and shown for reference only. See [Overage](#overage).
* **F0 (on-demand) capacities:** they have no provisioned CUs and no fixed cost; billing is based on actual consumption. That is why they cannot be paused, resumed, resized or scheduled, show **Variable** in the cost columns, do not display a list price and never count as turned off.
* **Trial about to expire:** Fabric trial capacities expire 60 days after creation and take with them access to the content of the assigned workspaces. When one of them has workspaces and 14 days or less remain, besides the badge on the row a notice appears at the top of every page (see [Notices at the top of the pages](/en/power-monitor/interface-e-navegacao.md#notices-at-the-top-of-the-pages)), with the **View capacities** link to this screen.

{% hint style="info" %}
This screen covers the **registration and operation** of capacities. For Capacity Units consumption, *throttling* and real-time health, use [Monitoring › Capacities](/en/power-monitor/monitoramento/capacidades.md).
{% endhint %}

## Frequently asked questions

<details>

<summary>I clicked "Pause Capacity" and got a permission error.</summary>

Check three points: (1) your user is an **Administrator** in Power Monitor; (2) the capacity has a Subscription and Resource Group configured (no **Not configured** badge); (3) the organization's Service Principal has the **Contributor** role on the resource. Use **Instructions** or **Add permissions** to resolve item 3.

</details>

<details>

<summary>Why doesn't my trial capacity have the pause and size change options?</summary>

Trial capacities (**FT** SKU) cannot be paused or resized through the Fabric API. For them, only viewing the details is available.

</details>

<details>

<summary>Why doesn't my F0 capacity have cost, usage % or the pause options?</summary>

F0 is the on-demand (serverless) Fabric capacity: there is no provisioned capacity to pause, resume or resize, and billing is based on actual consumption, with the multiplier defined by Microsoft. The cost appears as **Variable** and there is no utilization %, because there is no provisioned CU limit. Review the spend limit in Azure so that consumption does not exceed what you expect.

</details>

<details>

<summary>What should I do when the "Trial: expires in N days" badge appears?</summary>

The trial capacity is going to expire and, with it, access to the content of the assigned workspaces. Before the date, move those workspaces to a paid capacity (for example, through the [bulk capacity change](/en/power-monitor/governanca/workspaces.md#change-capacity-in-bulk) in *Governance › Workspaces*). When the date appears as estimated, it was calculated from the capacity's creation date.

</details>

<details>

<summary>Why does a capacity's status appear as "Suspended"?</summary>

It was paused, whether through the Azure Portal, by a schedule, by autoscale or manually on this screen. Check the capacity's **Change History** or [Capacity Actions](/en/power-monitor/auditoria/acoes-de-capacidade.md) to find out who paused it and when.

</details>

<details>

<summary>Is the cost shown in the "Change capacity size (SKU)" modal the amount on my invoice?</summary>

Not necessarily. It is an estimate based on Microsoft's list price for the region, without reservation discounts or commercial agreements. The actual cost over the last 30 days appears in the **Daily cost (30d)** and **Total cost (30d)** columns.

</details>

<details>

<summary>Can I edit an existing schedule?</summary>

No. Delete the schedule and create a new one with the desired configuration.

</details>

<details>

<summary>Why can't I associate a reservation with a capacity?</summary>

The capacity selector only appears for reservations marked as **Estimated via Cost Management**, and it lists only capacities from the same subscription and region as the reservation. For other reservations, the **Capacity** column shows the capacity identified automatically by Power Monitor (or "-", when there is no association).

</details>

## Related pages

* [Monitoring › Capacities](/en/power-monitor/monitoramento/capacidades.md)
* [Enable capacity monitoring](/en/power-monitor/monitoramento/capacidades/ativar-monitoramento-de-capacidade.md)
* [Audit › Capacity Actions](/en/power-monitor/auditoria/acoes-de-capacidade.md)
* [Mapping › Capacities](/en/power-monitor/mapeamento/capacidades.md)
* [Dashboards › Capacity Cost](/en/power-monitor/dashboards/custo-de-capacidade.md)
* [Capacity Dashboard](/en/power-monitor/dashboards/dashboard-de-capacidade.md)


---

# Agent Instructions
This documentation is published with GitBook. GitBook is the documentation platform designed so that both humans and AI agents can read, navigate, and reason over technical content effectively. Learn more at gitbook.com.

## Querying This Documentation
If you need additional information that is not directly available in this page, you can query the documentation by asking a question.

Perform an HTTP GET request on the following URL with the `ask` and `goal` query parameters:

```
GET https://docs.powermonitor.com.br/en/power-monitor/governanca/infraestrutura/capacidades.md?ask=<question>&goal=<user_goal>
```

`ask` is the immediate question: it should be specific, self-contained, and written in natural language.
`goal` is what the user is ultimately trying to achieve, the reason they need the answer. Sharing it helps GitBook give you a better, more relevant answer. A goal is most helpful when it describes the outcome the user wants rather than restating the question. For example, with `ask=how do I create an API token`, a goal like `automate deployments from our CI pipeline` lets GitBook tailor the answer to that use case.

The response will contain a direct answer to the question and relevant excerpts and sources from the documentation.

Use this mechanism when the answer is not explicitly present in the current page, you need clarification or additional context, or you want to retrieve related documentation sections.