> For the complete documentation index, see [llms.txt](https://docs.powermonitor.com.br/llms.txt). Markdown versions of documentation pages are available by appending `.md` to page URLs; this page is available as [Markdown](https://docs.powermonitor.com.br/en/power-monitor/governanca/infraestrutura/conexoes.md).

# Connections

Single inventory of the tenant's connections and data sources, configured in Fabric and observed in use by models, with gateway, privacy, credentials, permissions and reverse lineage.

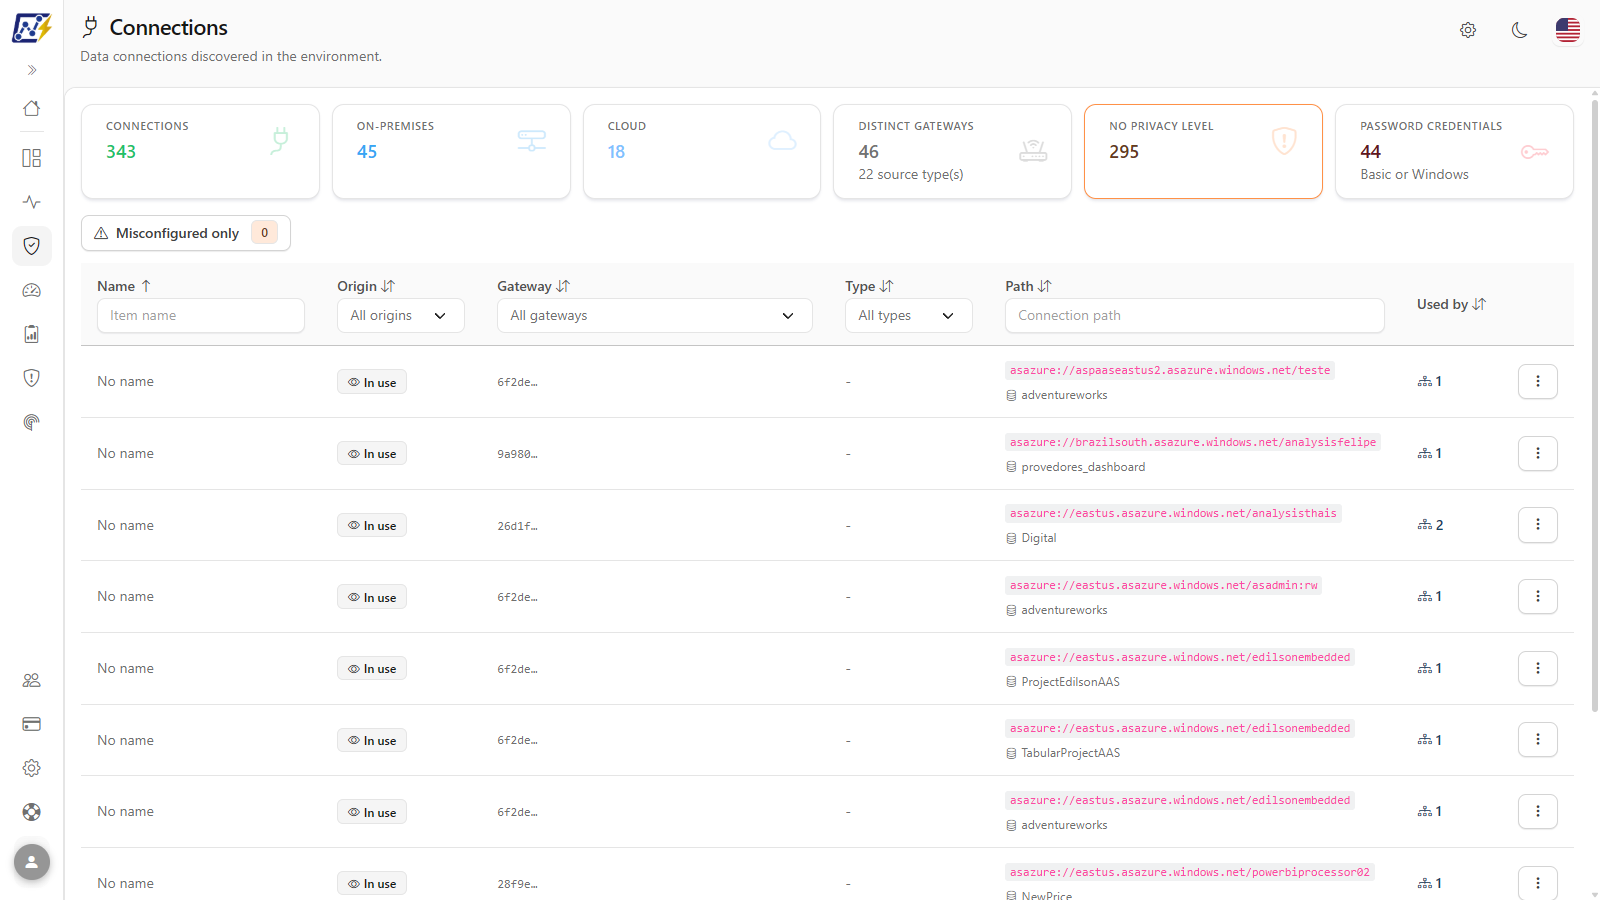
The **Connections** screen is the single inventory of your tenant's data connections. It brings together, in one list, the **configured connections** in Fabric/Power BI (gateway, virtual network and cloud connections) and the **data sources observed in use** by semantic models, even when there is no configured connection behind them. For each row you see the gateway, the type, the server/database, how many artifacts read through it and, in the details, privacy, credentials, permissions and lineage.

**How to access:** menu *Governance › Infrastructure › Connections*. You can also arrive already filtered by a gateway, through the **View** button on the *Connections* card of the [Gateways](/en/power-monitor/governanca/infraestrutura/gateways.md) screen.

**Who can use it:** the screen is visible to **all profiles** (User and Administrator). Granting access to the Service Principal (the **Grant permissions** button on the *Permissions* tab) is only executed for **Administrators**. The page can be hidden for specific users by the administrator, on the **Page access** tab of the [Users](/en/power-monitor/usuarios.md) record.

<figure><picture><source srcset="/files/GRnF1pVKgafpACQ0aDtc" media="(prefers-color-scheme: dark)"><img src="https://3938213054-files.gitbook.io/~/files/v0/b/gitbook-x-prod.appspot.com/o/spaces%2FH2bFRBmIfyK3kwVKbldl%2Fuploads%2Fgit-blob-39f27c019505b1abeca033b67fb9c1c346896b87%2Fpm-governanca-conexoes-en.png?alt=media" alt="Connections screen with the KPIs, the Misconfigured only button and the unified table"></picture><figcaption><p>Governance › Infrastructure › Connections</p></figcaption></figure>

{% hint style="warning" %}
**Sensitive data:** the screen shows the credential **type** and the **privacy level** for auditing purposes. Passwords, keys and secrets are never collected or displayed by Power Monitor. Even so, server and database names are sensitive information: be careful when copying or sharing screenshots of this screen, especially with customer data.
{% endhint %}

## What it is for

* **Audit source security**: find connections **without a privacy level** or with **password credentials** (Basic or Windows).
* **Find broken sources**: isolate the data sources that Power BI could not resolve (**misconfigured**).
* **Assess the impact** of a change to a server or database: know which semantic models, pipelines, dataflows and mirrored databases read through that source.
* **Clean up the environment**: locate configured connections that **nobody uses**.
* **Review who can use** each connection (roles on the connection).

## Screen overview

From top to bottom, the screen has:

1. **Header** with the title **Connections** and the subtitle *"Data connections discovered in the environment."*
2. **Gateway filter banner** (yellow), only when a gateway is selected.
3. **Six KPIs**: **Connections** (or **Filtered connections**), **On-premises**, **Cloud**, **Distinct gateways**, **No privacy level** and **Password credentials**.
4. **Misconfigured only** button, with the count, and the indication of rows detected as deleted.
5. **Connections table** with filters and sorting in the header, a clickable **Used by** count, a **⋮** menu per row and pagination of 10 rows at a time.
6. **Connection modal**, with the **Information**, **Permissions** (when applicable), **Item Lineage** and **Table Lineage** tabs.

## Features

### KPIs

**What it is:** six cards that summarize the table rows.

**What it is for:** measuring at a glance the environment's exposure (how many sources without privacy or with a password) and the dependency on on-premises gateways.

<figure><picture><source srcset="/files/lZM4W1gU9360Ugl7LZDh" media="(prefers-color-scheme: dark)"><img src="https://3938213054-files.gitbook.io/~/files/v0/b/gitbook-x-prod.appspot.com/o/spaces%2FH2bFRBmIfyK3kwVKbldl%2Fuploads%2Fgit-blob-671f2e8ea10f3c91ea19c8c6e71fc31db39e52fc%2Fpm-governanca-conexoes-kpis-en.png?alt=media" alt="Connections, On-premises, Cloud, Distinct gateways, No privacy level and Password credentials cards"></picture><figcaption><p>KPIs of the Connections screen</p></figcaption></figure>

| Card                     | How it is calculated                                                                                                                                                           |
| ------------------------ | ------------------------------------------------------------------------------------------------------------------------------------------------------------------------------ |
| **Connections**          | Number of rows (connections and data sources). With any filter active, the card is renamed **Filtered connections**                                                            |
| **On-premises**          | Rows with connectivity through an on-premises gateway. When there are any, the supporting line shows **+N VNet** (connections through a virtual network gateway)               |
| **Cloud**                | Rows with cloud connectivity (no gateway)                                                                                                                                      |
| **Distinct gateways**    | Number of different gateways present in the rows. The supporting line shows **N source type(s)**: how many distinct connector types (SQL, Web, SharePoint, OData, etc.) appear |
| **No privacy level**     | Rows without a defined privacy level (empty or *None*). The card gets a yellow border when it is greater than zero                                                             |
| **Password credentials** | Rows with **Basic** or **Windows** credentials (supporting line *Basic or Windows*)                                                                                            |

**How to use:**

1. Open *Governance › Infrastructure › Connections* and read the six numbers.
2. To narrow it down, apply the table filters: the KPIs then reflect only the filtered rows.

**How it works:** the KPIs **follow all filters** (columns, gateway banner and **Misconfigured only**). The list is loaded at once and filters are applied immediately, without a new query.

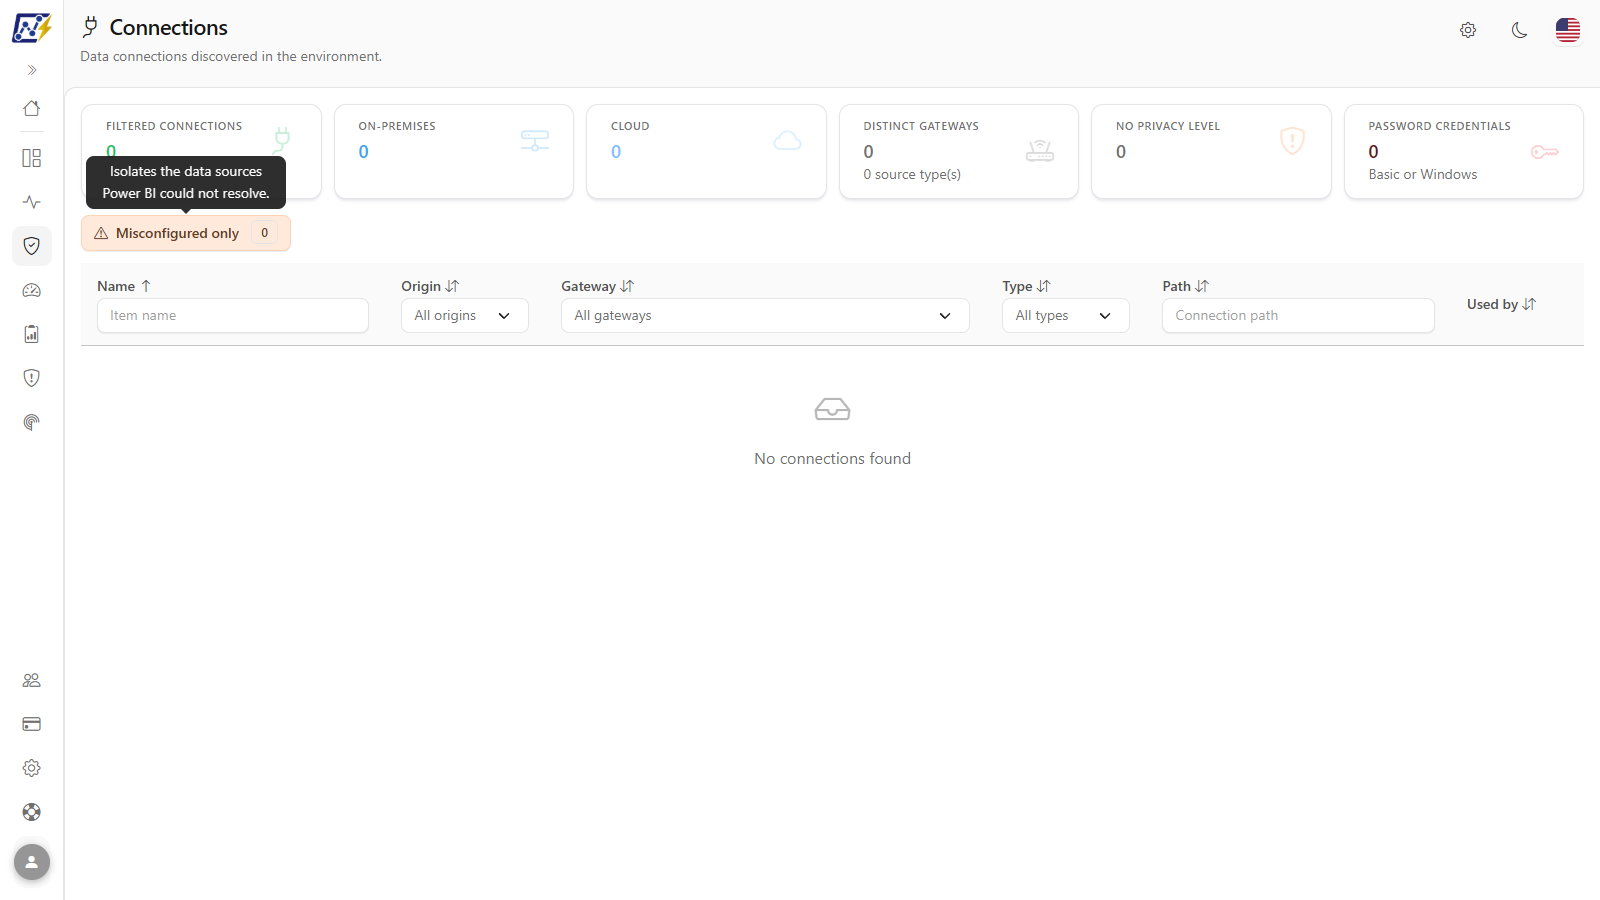
### Misconfigured only

**What it is:** a button above the table that isolates the data sources that Power BI **could not resolve** (*"Isolates the data sources Power BI could not resolve."*). The number next to it is the total of misconfigured sources in the inventory. When there are any, the screen shows next to it how many rows were **detected as deleted** ("*N* detected as deleted").

**What it is for:** finding broken sources, usually due to missing gateway mapping or invalid credentials, before they cause refresh failures.

<figure><picture><source srcset="/files/P3zfZPRfYt8v3jGNM60N" media="(prefers-color-scheme: dark)"><img src="https://3938213054-files.gitbook.io/~/files/v0/b/gitbook-x-prod.appspot.com/o/spaces%2FH2bFRBmIfyK3kwVKbldl%2Fuploads%2Fgit-blob-4291d2b123affaf408f15b9f51529084e9f24e82%2Fpm-governanca-conexoes-somente-mal-configuradas-en.png?alt=media" alt="Misconfigured only button active, with the tooltip explaining the filter; in this example no connection is misconfigured and the table shows No connections found"></picture><figcaption><p>Misconfigured only filter active (no misconfigured connections in this environment)</p></figcaption></figure>

**How to use:**

1. In *Governance › Infrastructure › Connections*, click **Misconfigured only**. The button is highlighted.
2. The table shows only the rows with the **Misconfigured** badge (*"Power BI could not resolve this data source."*), and the KPIs adjust to this filter.
3. Open each row to see the gateway, the server/database and the lineage.
4. Click the button again to turn off the filter.

**How it works:** the number on the button always refers to the entire inventory, even with the filter on. The "misconfigured" information comes from the [Inventory Scan](/en/power-monitor/mapeamento/inventarios.md). The filter combines with the column filters.

### Text filters (Name and Path)

**What it is:** text boxes below the **Name** (*Item name*) and **Path** (*Connection path*) titles.

**What it is for:** locating a connection by name or all sources of a server or database (for example, before shutting down a server).

**How to use:**

1. Type the term in the column's filter box.
2. The table is filtered as you type and returns to the first page.
3. Delete the text to remove the filter.

**How it works:** the search looks for the text anywhere in the value, without distinguishing uppercase from lowercase. The **Path** filter searches the registered path of the configured connection (server and database). Rows that are only **In use**, whose displayed path comes from the data source itself, may not be found by this filter: in that case, locate them by **Name** or by sorting the **Path** column.

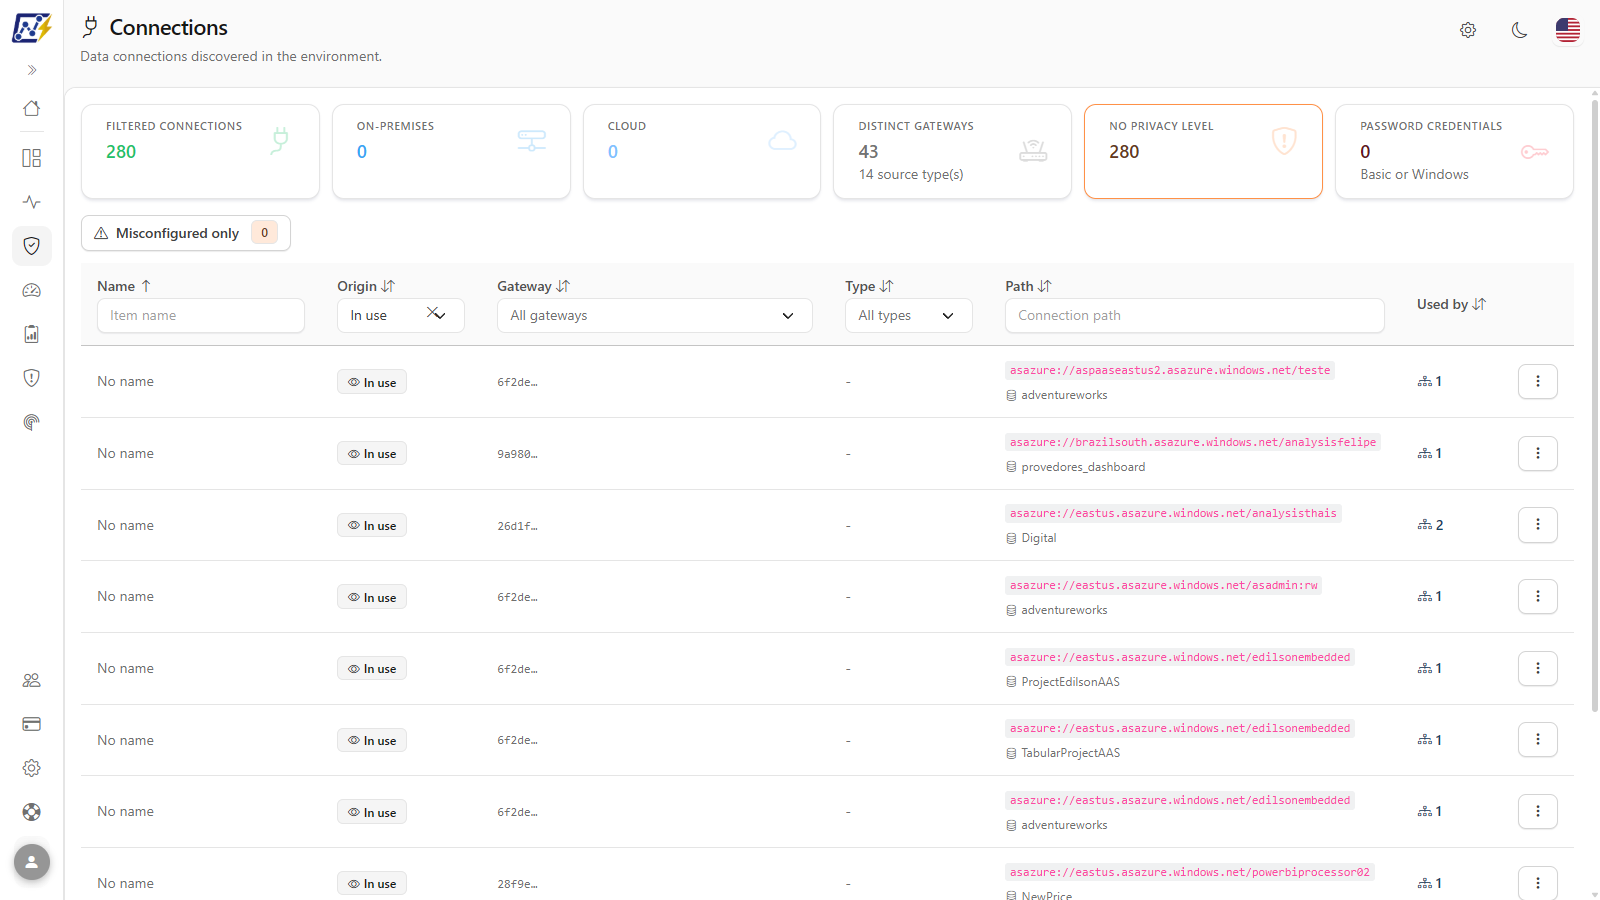
### List filters (Origin, Gateway and Type)

**What it is:** selection lists below the **Origin** (*All origins*), **Gateway** (*All gateways*) and **Type** (*All types*) titles.

**What it is for:** separating configured connections from sources that are only in use, or focusing on a gateway or a connectivity type (for example, only on-premises gateway connections).

<figure><picture><source srcset="/files/8yeP2Y2HNlYnq3U6H1xv" media="(prefers-color-scheme: dark)"><img src="https://3938213054-files.gitbook.io/~/files/v0/b/gitbook-x-prod.appspot.com/o/spaces%2FH2bFRBmIfyK3kwVKbldl%2Fuploads%2Fgit-blob-3d93a54728d57db34cbed048ef35b3923a39f695%2Fpm-governanca-conexoes-filtro-origem-en.png?alt=media" alt="Connections table filtered by an origin, with the Filtered connections KPI"></picture><figcaption><p>List filtered by the Origin column</p></figcaption></figure>

**How to use:**

1. Click the column's list and choose a value.
2. The table and the KPIs show only the matching rows; the first card becomes **Filtered connections**.
3. To remove it, click the **X** next to the list or go back to the *All* option.

**How it works:** the lists show only the values that exist in the loaded connections. In **Gateway**, the **No Gateway** option isolates the connections that do not go through any gateway. Choosing a gateway (or **No Gateway**) displays the filter banner described below. All filters are combined (all of them must be met). If no row matches, the table shows "No connections found".

### Gateway filter banner and Clear filter

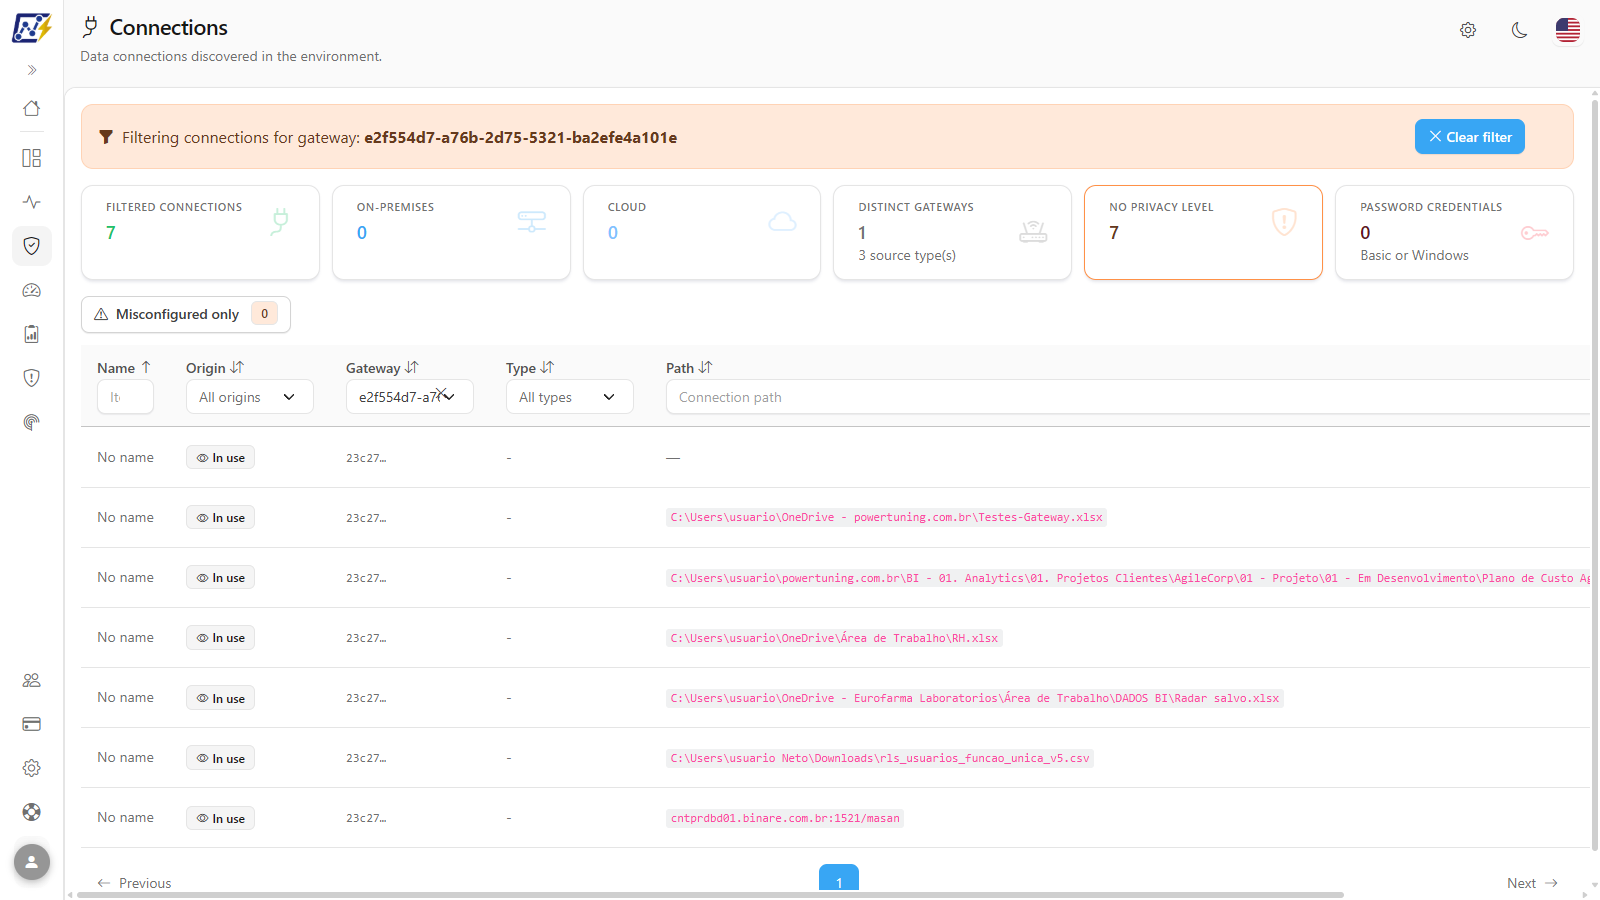
**What it is:** a yellow banner at the top that reads "Filtering connections for gateway: *name*" (or "Filtering connections without gateway"), with the **Clear filter** button.

**What it is for:** making it clear that the list is restricted to one gateway, especially when you arrive from the [Gateways](/en/power-monitor/governanca/infraestrutura/gateways.md) screen, and returning to the full list with one click.

<figure><picture><source srcset="/files/7PzYZn3TYfe2ZuizFvm3" media="(prefers-color-scheme: dark)"><img src="https://3938213054-files.gitbook.io/~/files/v0/b/gitbook-x-prod.appspot.com/o/spaces%2FH2bFRBmIfyK3kwVKbldl%2Fuploads%2Fgit-blob-6d2753ef2c311f528d19dbf49d168033244008b5%2Fpm-governanca-conexoes-filtro-gateway-en.png?alt=media" alt="Yellow Filtering connections for gateway banner with the Clear filter button and the filtered list"></picture><figcaption><p>List filtered by gateway</p></figcaption></figure>

**How to use:**

{% stepper %}
{% step %}

### Select the gateway

In the **Gateway** column, choose the gateway from the list. Alternatively, on the [Gateways](/en/power-monitor/governanca/infraestrutura/gateways.md) screen, open the gateway and click **View** on the **Connections** card: you arrive at this screen already filtered.
{% endstep %}

{% step %}

### Check the banner

The yellow banner shows the gateway name. The table and the KPIs display only the connections of that gateway.
{% endstep %}

{% step %}

### Return to the full list

Click **Clear filter**. The message "Filters cleared." is displayed.
{% endstep %}
{% endstepper %}

**How it works:** **Clear filter** clears **all** table filters (including **Misconfigured only**) and resets the sorting to **Name**, in ascending order.

### Origin column

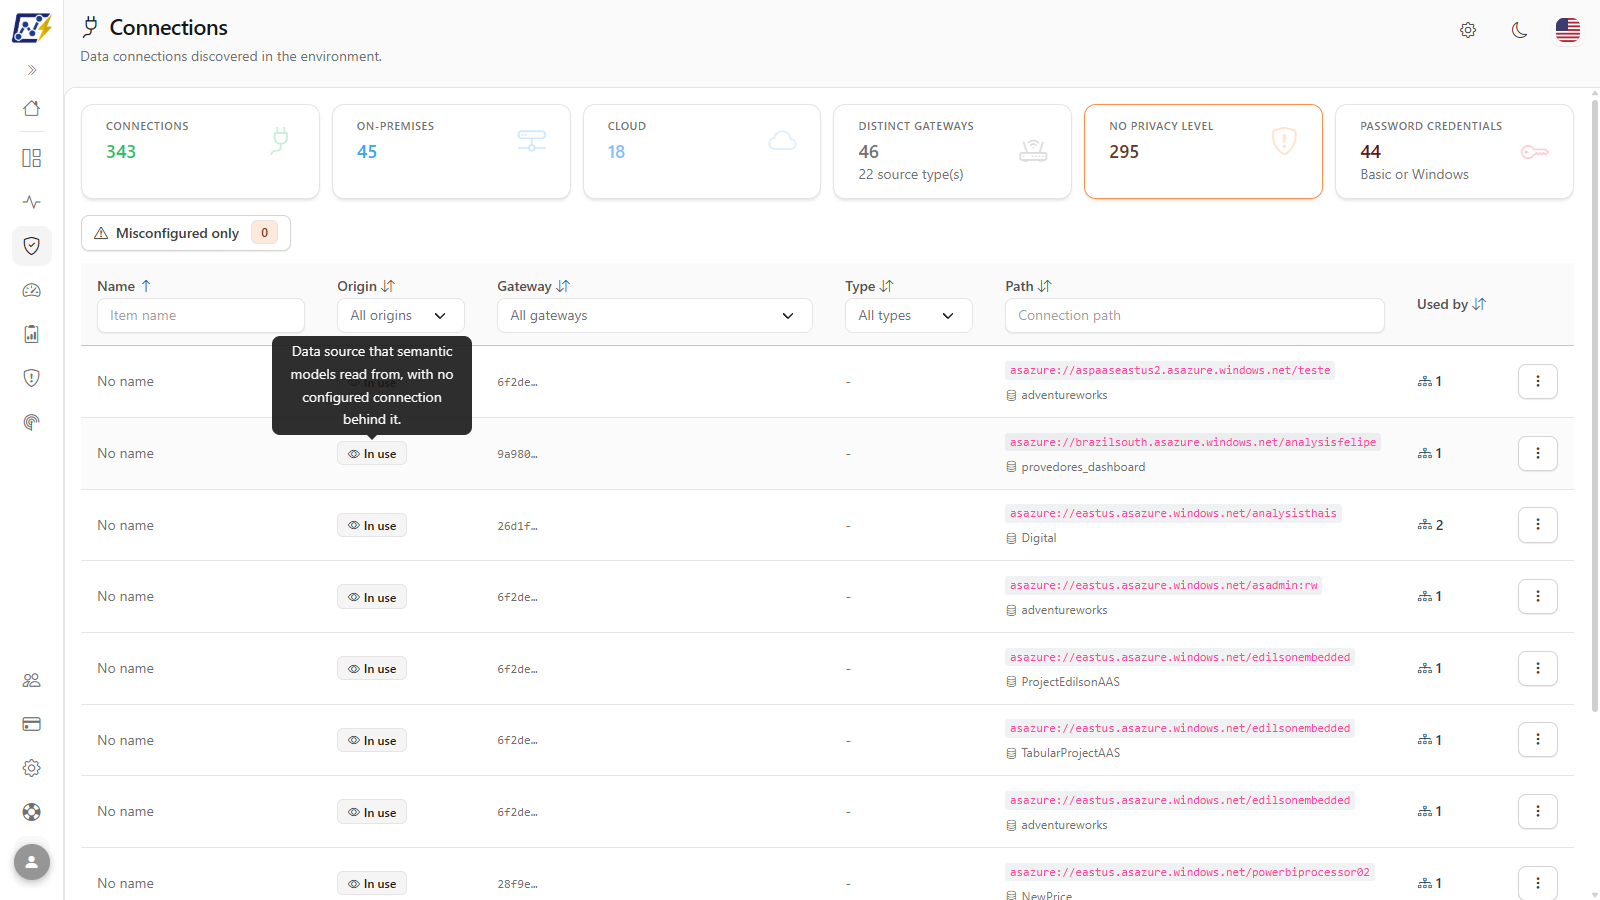
**What it is:** a badge that indicates where the row comes from: **Configured**, **In use** or **Configured and in use**. Hover over it to read the explanation.

**What it is for:** distinguishing registered connections with no usage (cleanup candidates) from sources that models read without a configured connection (common with cloud sources).

<figure><picture><source srcset="/files/G9dBKckP8IHprXnuSAMI" media="(prefers-color-scheme: dark)"><img src="https://3938213054-files.gitbook.io/~/files/v0/b/gitbook-x-prod.appspot.com/o/spaces%2FH2bFRBmIfyK3kwVKbldl%2Fuploads%2Fgit-blob-ec0988d185a2531ef2ee9033e84deaad3e441e58%2Fpm-governanca-conexoes-origem-tooltip-en.png?alt=media" alt="Tooltip of the Origin column badge with the explanation of the origin"></picture><figcaption><p>Origin column tooltip</p></figcaption></figure>

| Badge                     | Meaning                                                                                |
| ------------------------- | -------------------------------------------------------------------------------------- |
| **Configured**            | Connection configured in the environment. No known semantic model reads through it yet |
| **In use**                | Data source that semantic models read from, with no configured connection behind it    |
| **Configured and in use** | Connection configured in the environment and read by semantic models                   |

**How to use:** read the badge in the **Origin** column or filter by the column's list to isolate an origin.

**How it works:** configured connections come from the Fabric API; sources in use come from the [Inventory Scan](/en/power-monitor/mapeamento/inventarios.md). When the two match, the row appears as **Configured and in use**. **In use** rows do not have a *Permissions* tab.

### Name, Gateway, Type and Path columns

**What it is:** the descriptive columns of each row.

**What it is for:** identifying the connection, what it goes through and where it points.

| Column      | Description                                                                                                                                                           |
| ----------- | --------------------------------------------------------------------------------------------------------------------------------------------------------------------- |
| **Name**    | Connection name. It may show the **Misconfigured** badge and, if the row was detected as deleted, a trash icon (hover over it to see "Detected as deleted on *date*") |
| **Gateway** | Gateway name. When the name is not known, it shows the abbreviated ID (the full ID appears on hover); "—" when there is no gateway                                    |
| **Type**    | Connectivity type (for example, OnPremisesGateway, VirtualNetworkGateway, ShareableCloud)                                                                             |
| **Path**    | Server/address of the source and, below it, the database when there is one                                                                                            |

**How to use:** read the columns or use the corresponding filters. The **Privacy** and **Credential** fields do not appear in the table: check them on the **Information** tab of the modal.

**How it works:** rows detected as deleted remain listed, with a discreet mark, so you can audit them. They also appear in [Deleted Artifacts](/en/power-monitor/governanca/operacao/artefatos-excluidos.md).

### Used by column

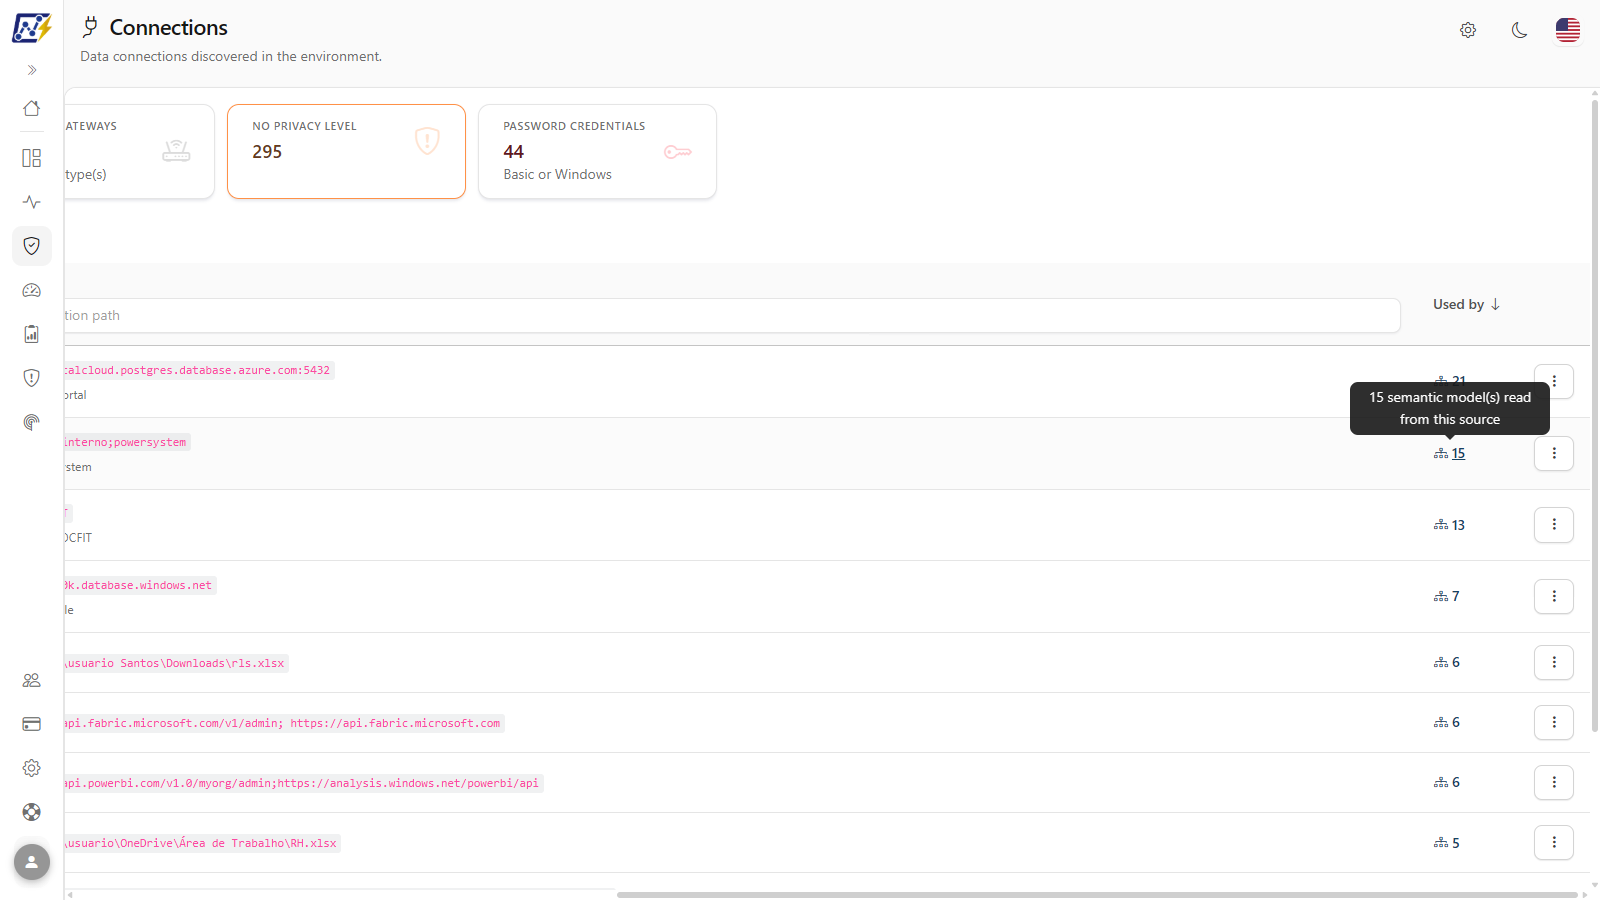
**What it is:** the **total number of consumers** that read through this source (semantic models, Data Pipelines, Dataflows and Mirrored Databases). The number is clickable and opens the item lineage.

**What it is for:** knowing, without opening anything, whether a connection is critical (many consumers) or unused (zero).

<figure><picture><source srcset="/files/mYbTbkaHqCn9bA8cJZ8D" media="(prefers-color-scheme: dark)"><img src="https://3938213054-files.gitbook.io/~/files/v0/b/gitbook-x-prod.appspot.com/o/spaces%2FH2bFRBmIfyK3kwVKbldl%2Fuploads%2Fgit-blob-794459386ccf3d715d27539ce156f8a34d9a43a8%2Fpm-governanca-conexoes-usado-por-tooltip-en.png?alt=media" alt="Tooltip of the Used by column with the breakdown of consumers"></picture><figcaption><p>Used by column tooltip</p></figcaption></figure>

**How to use:**

1. Hover over the number to see the breakdown, for example "5 consumer(s) read through this source, 3 of them semantic model(s)" or "3 semantic model(s) read from this source".
2. Click the number to open the modal directly on the **Item Lineage** tab.
3. To sort by usage, click the **Used by** title.

**How it works / rules:**

* **0** (in gray) is informative: the connection exists, but no known consumer reads through it ("No known consumer reads through this source.").
* **—** means unknown usage ("Usage unknown"), not zero.
* A gray number without a link indicates that the source has no lineage key ("No lineage key for this source."), so there is no lineage to open.
* When sorting, rows with unknown usage are placed at the end of the ascending order.

### Sorting and pagination

**What it is:** click the title of any column (**Name**, **Origin**, **Gateway**, **Type**, **Path** or **Used by**) to sort; the table is paginated with **10 rows per page**.

**What it is for:** bringing the most used connections to the top, grouping by gateway or type and browsing large inventories.

**How to use:**

1. Click the column title. The first click sorts in ascending order (up arrow); click again to reverse it.
2. Use the page controls below the table.

**How it works:** by default, the list is sorted by **Name**. **Used by** is sorted numerically. Changing a filter returns to the first page.

### Row actions menu (⋮)

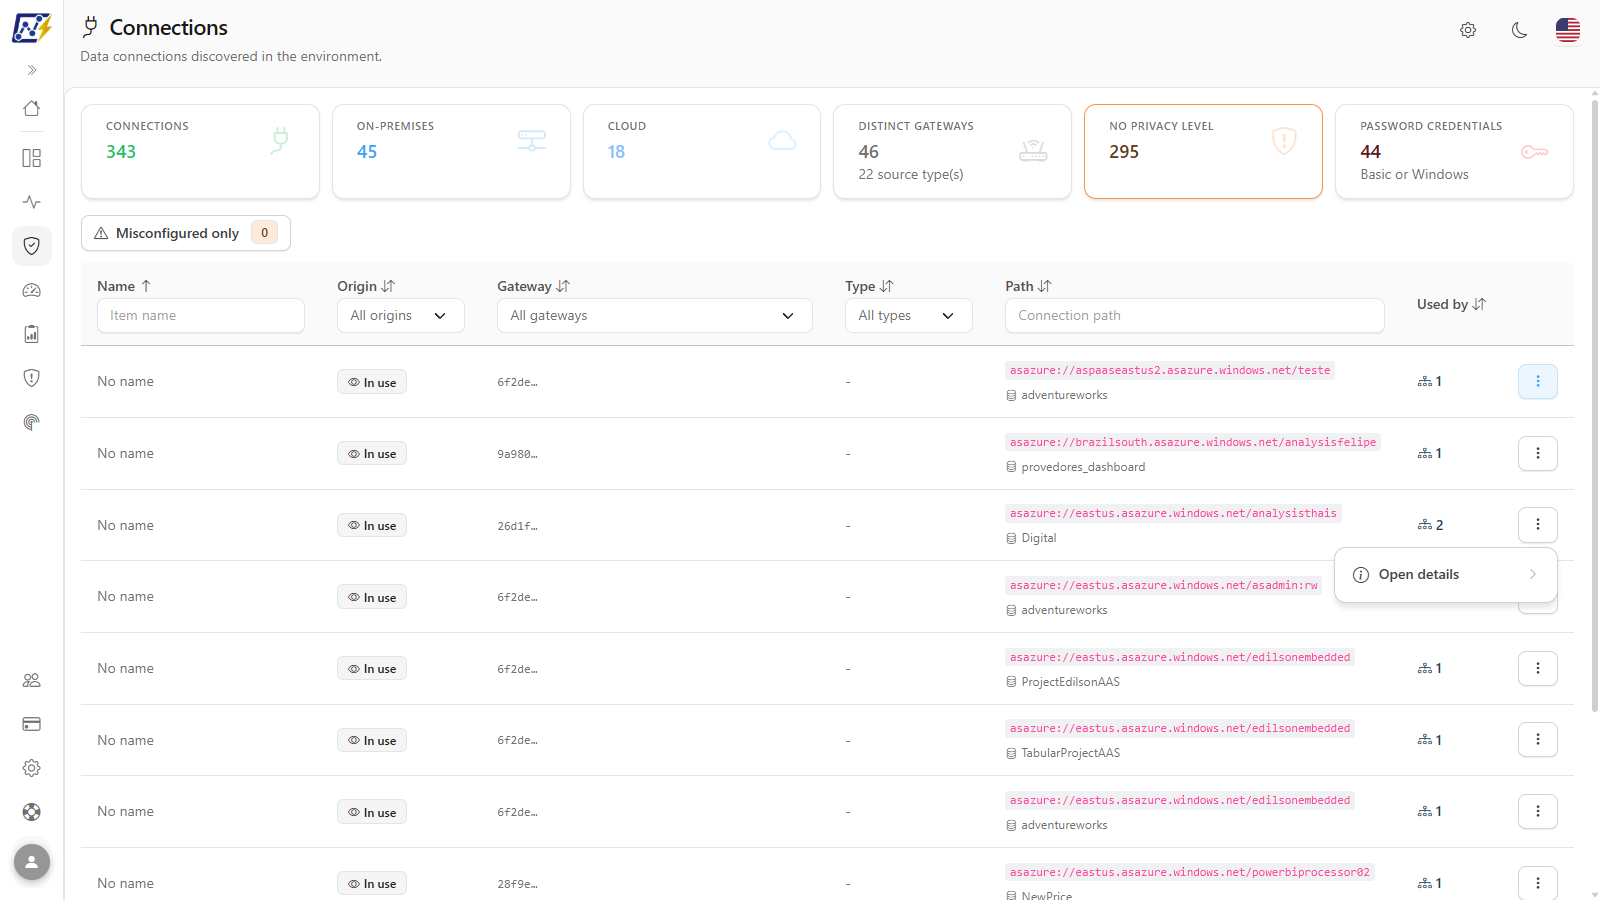
**What it is:** the **⋮** button at the end of the row (or right-clicking the row) opens the menu with **Open details**. When you hover over it, a submenu goes directly to **Information**, **Permissions** or **Lineage**.

**What it is for:** opening the modal directly on the desired tab.

<figure><picture><source srcset="/files/GRnF1pVKgafpACQ0aDtc" media="(prefers-color-scheme: dark)"><img src="https://3938213054-files.gitbook.io/~/files/v0/b/gitbook-x-prod.appspot.com/o/spaces%2FH2bFRBmIfyK3kwVKbldl%2Fuploads%2Fgit-blob-7a6adfc4a7eb9aa75ae422097dd1ae1fa9db6041%2Fpm-governanca-conexoes-menu-acoes-en.png?alt=media" alt="Row actions menu with the Open details submenu open"></picture><figcaption><p>⋮ menu with the Open details submenu</p></figcaption></figure>

**How to use:**

1. Click **⋮** on the row (or right-click it).
2. Click **Open details** to open the **Information** tab, or hover and choose **Information**, **Permissions** or **Lineage** (opens the **Item Lineage** tab).

**How it works:** **Permissions** only appears in the submenu for rows with a configured connection (**Configured** or **Configured and in use** origin). Clicking anywhere on the row opens the modal on the **Information** tab.

### Connection modal: Information tab

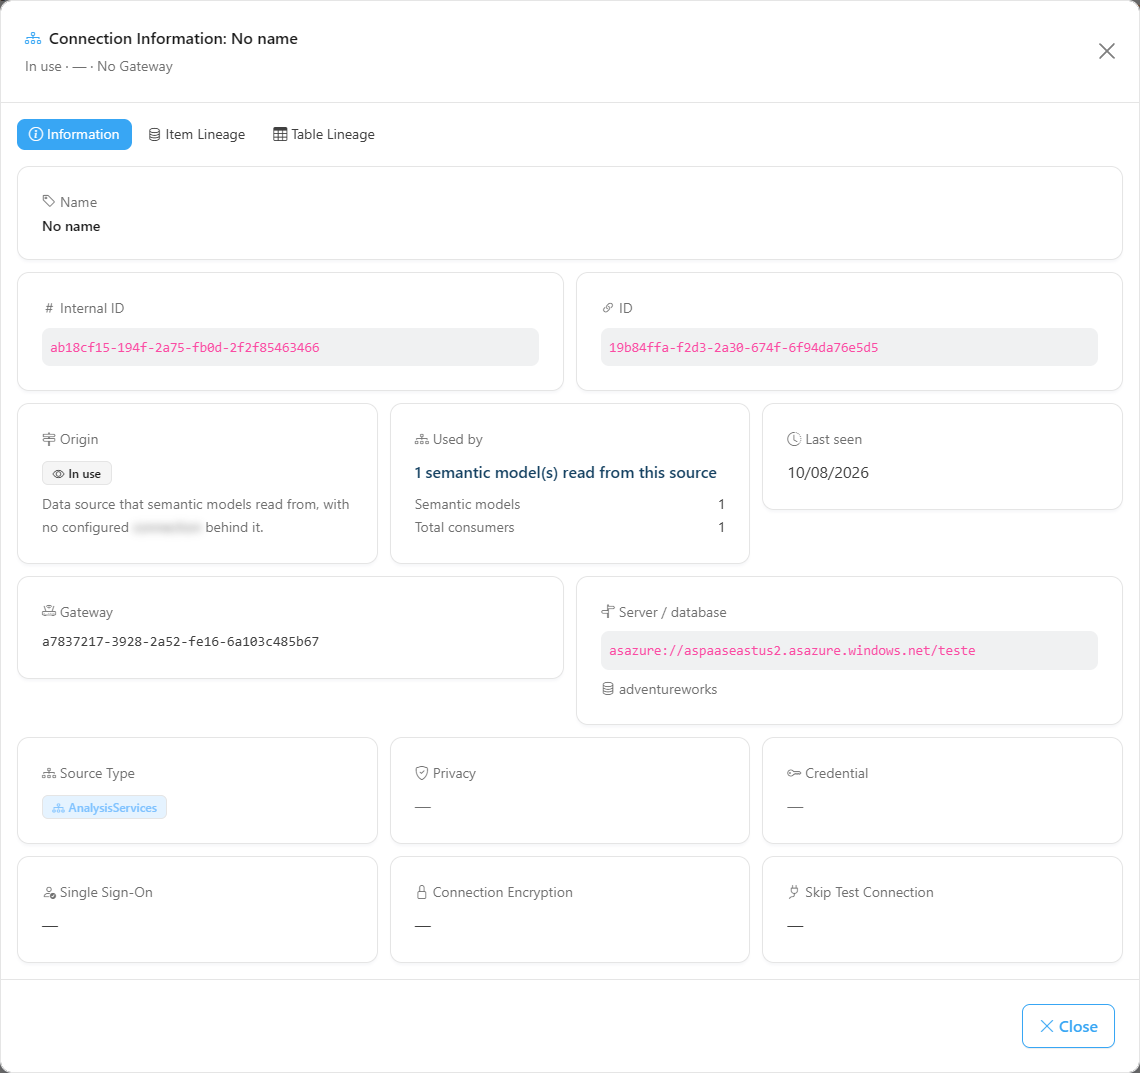
**What it is:** the first tab of the **Connection Information:&#x20;*****name*** modal. The modal subtitle summarizes the origin, connectivity type and gateway.

**What it is for:** seeing everything Power Monitor knows about the connection, including fields that do not appear in the table (privacy, credential, Single Sign-On, encryption).

<figure><picture><source srcset="/files/bv5bvXNUFbH5x2Vgw5GA" media="(prefers-color-scheme: dark)"><img src="https://3938213054-files.gitbook.io/~/files/v0/b/gitbook-x-prod.appspot.com/o/spaces%2FH2bFRBmIfyK3kwVKbldl%2Fuploads%2Fgit-blob-5bb1f38c15fd26cce1f709aad25c8bfcb50332e7%2Fpm-governanca-conexoes-modal-informacoes-en.png?alt=media" alt="Connection Information modal"></picture><figcaption><p>Information tab</p></figcaption></figure>

**How to use:**

1. Click the connection row (or use **⋮ › Open details**).
2. Read the cards: **Name** and connectivity type; **Internal ID** and **ID** (identifier in Fabric); **Origin**, with the explanation; **Used by**, with the usage sentence and, below it, the two numbers behind it: **Semantic models** and **Total consumers**; **Last seen** (with **Updated at**, when available, and the deletion detection date, if any); **Gateway** (or *No Gateway*); **Server / database**; **Source Type** (connector); **Privacy**; **Credential**; **Single Sign-On**; **Connection Encryption**; **Skip Test Connection**.
3. Click **Close** to exit.

**How it works:** the data comes from the list itself, without a new query. Fields without a value appear as "—"; in **Semantic models** and **Total consumers**, "—" means the number is unknown, not zero. **Updated at** only appears when the connection was edited manually in Power Monitor: the scan does not change this date.

### Connection modal: Permissions tab

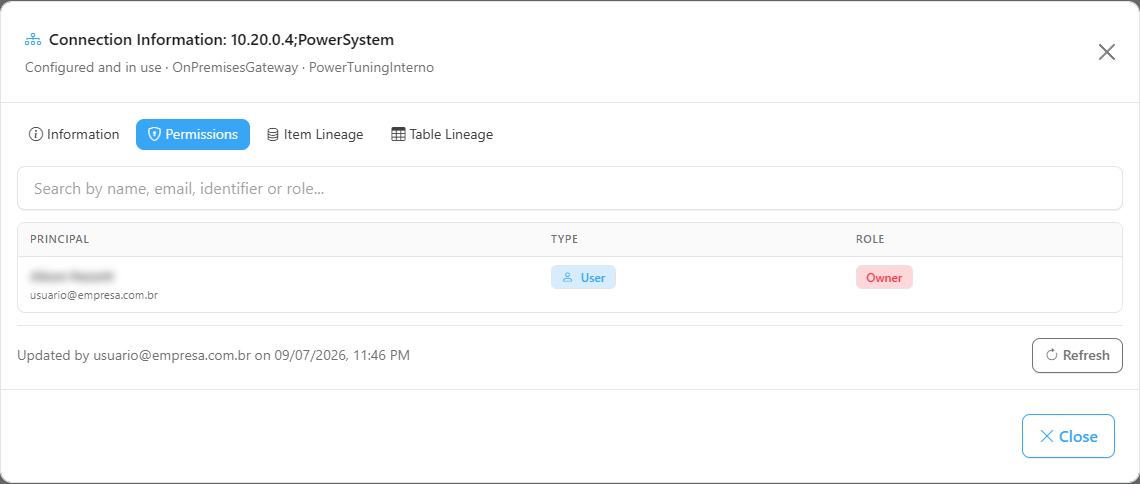
**What it is:** the list of users, groups and service principals with a role on the connection in Fabric (for example, Owner, User, User With Reshare).

**What it is for:** reviewing who can use, share or administer the connection.

<figure><picture><source srcset="/files/Nv3P2WawUb91T9BvXvHt" media="(prefers-color-scheme: dark)"><img src="https://3938213054-files.gitbook.io/~/files/v0/b/gitbook-x-prod.appspot.com/o/spaces%2FH2bFRBmIfyK3kwVKbldl%2Fuploads%2Fgit-blob-e3d48a85f0e34a95857daa67c72f2cf914d76cc0%2Fpm-governanca-conexoes-modal-permissoes-en.png?alt=media" alt="Permissions tab of the connection modal with the search and the Principal, Type and Role table"></picture><figcaption><p>Connection Permissions tab</p></figcaption></figure>

**How to use:**

{% stepper %}
{% step %}

### Open the tab

In the connection's **⋮** menu, choose **Open details › Permissions**, or open the modal and click the **Permissions** tab. The screen displays "Loading permissions..." while it fetches the last recorded result.
{% endstep %}

{% step %}

### Search

Use the *Search by name, email, identifier or role...* box. The table shows **Principal**, **Type** (**User**, **Group** or **Service Principal**) and **Role**.
{% endstep %}

{% step %}

### Refresh the query

The footer shows "Updated by *name* on *date*". To query Fabric again, click **Refresh**.
{% endstep %}

{% step %}

### If "No access granted" appears

The organization's Service Principal does not yet have permission on the connection. An **Administrator** can click **Grant permissions**. At the end, the "Service Principal access grant completed" panel summarizes how many gateways and connections were granted, already had access, failed or were rate-limited, and the tab is queried again.
{% endstep %}
{% endstepper %}

**How it works / rules:**

* Available only for rows with a configured connection. Sources that are only **In use** do not have this tab, because there is no connection object in Fabric to query.
* The tab shows the last queried result and only queries Fabric again when you click **Refresh** (available to all profiles).
* **Grant permissions** is the same grant as the **Grant Service Principal Access to Gateways** button on the [Gateways](/en/power-monitor/governanca/infraestrutura/gateways.md) screen: it grants the Service Principal access to the gateways visible to your account and to connections without a gateway. It is only executed for **Administrators**.
* Other states: "This connection does not have a remote scan ID yet. Try again after the next scan.", "No permissions found." and "Failed to fetch permissions" (with **Retry**).
* Roles are displayed in color: **Owner** in red, **User With Reshare** in yellow and **User** in blue.

### Connection modal: Item Lineage tab

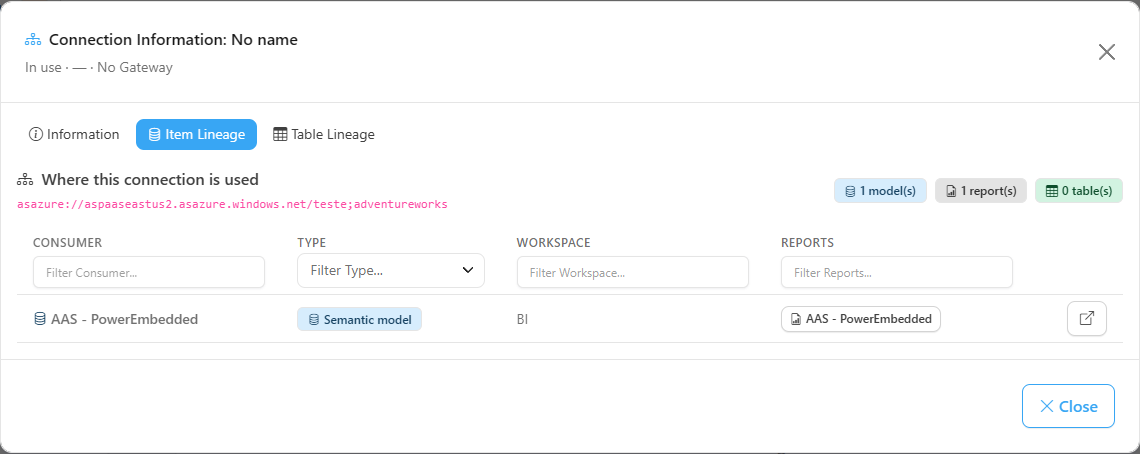
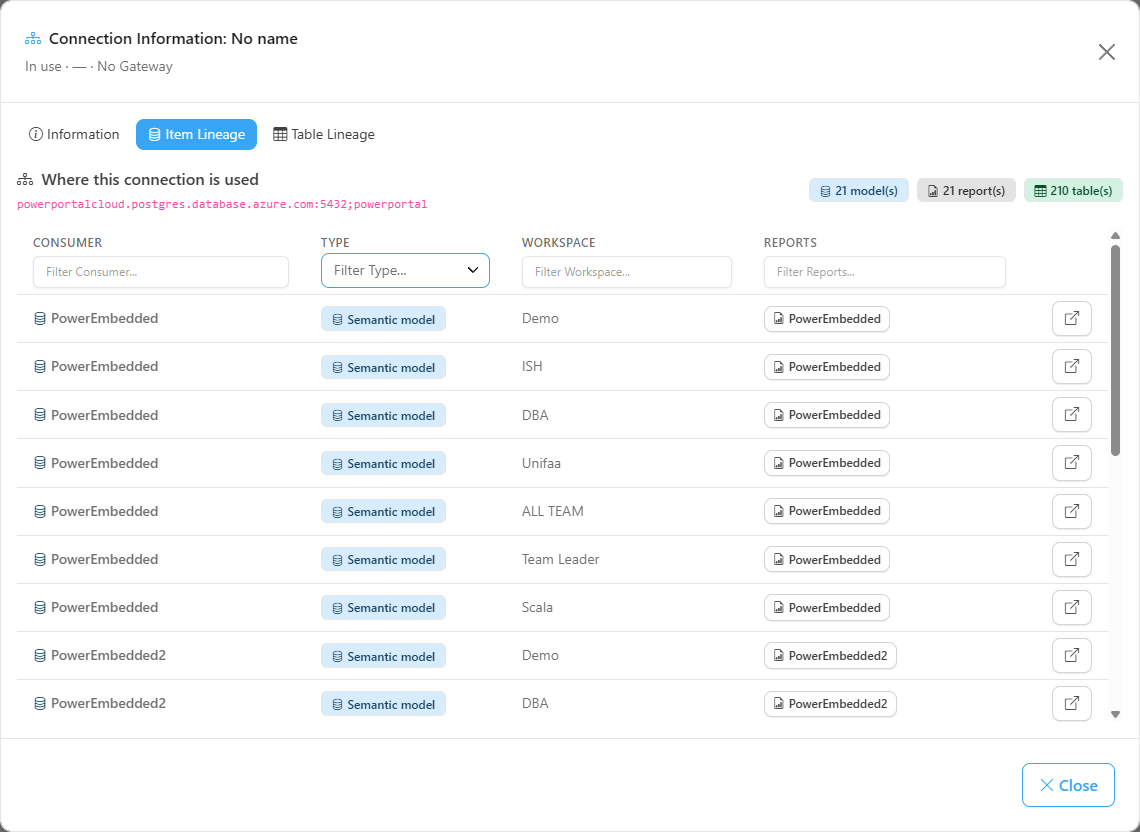
**What it is:** the consumers that read through this source, with the **Consumer**, **Type**, **Workspace** and **Reports** columns, under the title "Where this connection is used" and the counters of consumers, reports and tables.

**What it is for:** knowing who will be affected by a change to the source and opening the items directly in Power BI.

<figure><picture><source srcset="/files/e4b8MstNO5oDapbuTpoO" media="(prefers-color-scheme: dark)"><img src="https://3938213054-files.gitbook.io/~/files/v0/b/gitbook-x-prod.appspot.com/o/spaces%2FH2bFRBmIfyK3kwVKbldl%2Fuploads%2Fgit-blob-27683536038703dbc7a6b3c46cfd681c95c40076%2Fpm-governanca-conexoes-modal-linhagem-itens-en.png?alt=media" alt="Item Lineage tab of the connection modal"></picture><figcaption><p>Item Lineage tab: where this connection is used</p></figcaption></figure>

<figure><picture><source srcset="/files/iAu1vBUZ8MeidKbHUVpi" media="(prefers-color-scheme: dark)"><img src="https://3938213054-files.gitbook.io/~/files/v0/b/gitbook-x-prod.appspot.com/o/spaces%2FH2bFRBmIfyK3kwVKbldl%2Fuploads%2Fgit-blob-cb2963080704178439552694da56afef4e81c6d0%2Fpm-governanca-conexoes-modal-linhagem-itens-filtro-tipo-en.png?alt=media" alt="Item Lineage Type filter open, with the consumer types and Clear selection"></picture><figcaption><p>Filter by consumer type</p></figcaption></figure>

**How to use:**

{% stepper %}
{% step %}

### Open the lineage

Click the number in the **Used by** column, or use **⋮ › Open details › Lineage**. The modal opens on the **Item Lineage** tab.
{% endstep %}

{% step %}

### Filter the consumers

Use the boxes below the **Consumer**, **Workspace** and **Reports** titles. In the **Type** column, select one or more types (**Semantic model**, **Data Pipeline**, **Dataflow**, **Mirrored Database**); **Clear selection** removes the choice.
{% endstep %}

{% step %}

### Open in Power BI

Use the row's shortcut button (**Open model in Power BI**) or click the name of a report (**Open report in Power BI**).
{% endstep %}
{% endstepper %}

**How it works:** only semantic models have linked reports; for the other types the **Reports** column shows "Not applicable". Without consumers, the tab shows "No known consumer uses this source.". If the lineage cannot be loaded, "Could not load the lineage." appears with **Retry**.

### Connection modal: Table Lineage tab

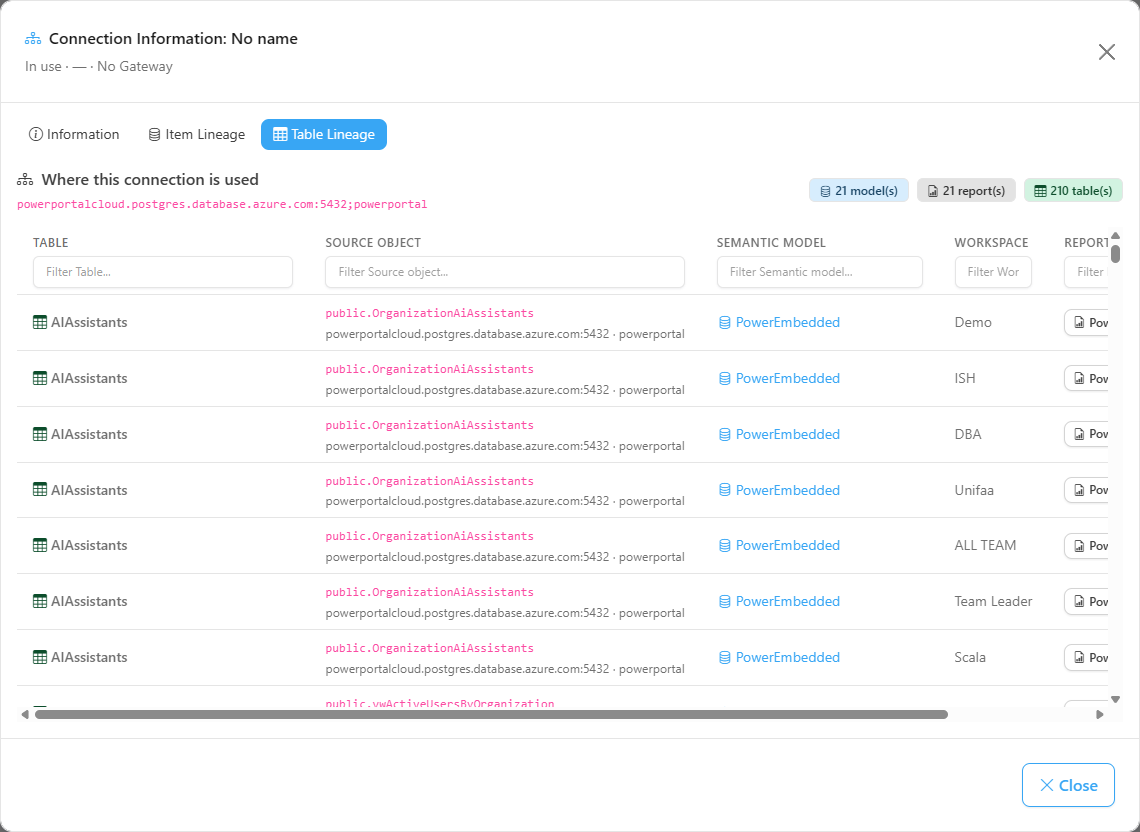
**What it is:** the semantic model tables attributed to this source, with the **Table**, **Source object**, **Semantic model**, **Workspace** and **Reports** columns.

**What it is for:** going down to the table level before changing or shutting down a source: knowing exactly which tables of which models read from it.

<figure><picture><source srcset="/files/NDjA5qmI4WgsAy9fskDl" media="(prefers-color-scheme: dark)"><img src="https://3938213054-files.gitbook.io/~/files/v0/b/gitbook-x-prod.appspot.com/o/spaces%2FH2bFRBmIfyK3kwVKbldl%2Fuploads%2Fgit-blob-b86f7f73b83028ef2fd0396b79c407910f02a33e%2Fpm-governanca-conexoes-modal-linhagem-tabelas-en.png?alt=media" alt="Table Lineage tab of the connection modal"></picture><figcaption><p>Table Lineage tab</p></figcaption></figure>

**How to use:**

1. Open the connection modal and click the **Table Lineage** tab.
2. Filter using the boxes of each column.
3. Click the semantic model name to open it in Power BI, or a report to open the report.

**How it works:** the mapping is **conservative**: it only attributes tables whose M query explicitly points to the source's server/database (SQL, PostgreSQL, MySQL, Db2, Redshift and Analysis Services connectors). Tables with merges or from other connectors are not attributed. Without attributable tables, the tab shows "No table could be attributed to this source.".

## How to use: common tasks

### How to audit connections without privacy and with a password

{% stepper %}
{% step %}

### See the totals

In *Governance › Infrastructure › Connections*, check the **No privacy level** and **Password credentials** cards.
{% endstep %}

{% step %}

### Refine the list

Use the **Type** (for example, only gateway connections) and **Gateway** filters. The cards adjust to the filter.
{% endstep %}

{% step %}

### Check each connection

Open the connection and check **Privacy** and **Credential** on the **Information** tab. On the **Permissions** tab, see who can use it. Adjustments are made in Fabric/Power BI itself (*Manage connections and gateways*).
{% endstep %}
{% endstepper %}

### How to find out the impact of shutting down a server

{% stepper %}
{% step %}

### Locate the source

Filter the **Path** column by the server name.
{% endstep %}

{% step %}

### Open the consumers

Click the number in the **Used by** column to open the **Item Lineage** and note the affected models, pipelines, dataflows and mirrored databases.
{% endstep %}

{% step %}

### Drill down by table

On the **Table Lineage** tab, see which model tables read from that source and notify the workspace owners.
{% endstep %}
{% endstepper %}

### How to find unused connections

{% stepper %}
{% step %}

### Filter by origin

In the **Origin** column, choose **Configured** (registered connections that no known semantic model reads).
{% endstep %}

{% step %}

### Sort by usage

Click the **Used by** title to bring the rows with **0** to the top.
{% endstep %}

{% step %}

### Confirm before removing

Open the connection, check the **Item Lineage** tab (pipelines and dataflows also count) and, if there are no consumers, evaluate the removal in Fabric with the owner.
{% endstep %}
{% endstepper %}

## Rules and behavior

* **Two sources, one list:** **configured** connections come from the Fabric API (collected by the connections and gateways scan); sources **in use** come from the [Inventory Scan](/en/power-monitor/mapeamento/inventarios.md), which reports which sources each semantic model reads and which ones Power BI could not resolve (misconfigured). When the two match, the row appears as **Configured and in use**.
* **Filters in the browser:** the entire list is loaded when the screen opens; filters, sorting, pagination and KPIs are calculated immediately, without a new query.
* **Reverse gateway ↔ connection lineage:** the relationship between connections, gateways and consumers is the same one used on the [Gateways](/en/power-monitor/governanca/infraestrutura/gateways.md) screen and in the Gateway and Connection filters of the Refresh Execution Timeline (in [Schedules](/en/power-monitor/governanca/operacao/agendamentos.md)).
* **Deleted rows remain listed**, with a discreet mark and the detection date, so you can audit them. They also appear in [Deleted Artifacts](/en/power-monitor/governanca/operacao/artefatos-excluidos.md).
* **Permissions:** the *Permissions* tab shows the last result queried in Fabric and only queries again when you click **Refresh**. **Grant permissions** is only executed for **Administrators**.
* **Read-only with respect to connections:** the screen does not create, change or delete connections; that is done in Fabric/Power BI.

## Frequently asked questions

<details>

<summary>What is the difference between "Configured", "In use" and "Configured and in use"?</summary>

**Configured** is a connection registered in the environment that no known semantic model uses. **In use** is a data source that models read, but without a configured connection behind it (common with cloud sources). **Configured and in use** combines both cases.

</details>

<details>

<summary>What does the "Misconfigured" badge mean?</summary>

Power BI reported that it could not resolve that data source. It usually indicates a source without correct mapping in the gateway or with invalid credentials. Use the **Misconfigured only** button to list all of them.

</details>

<details>

<summary>Why do some rows not have the Permissions tab?</summary>

Rows with the **In use** origin do not have a configured connection in Fabric behind them, so there are no permissions to query.

</details>

<details>

<summary>How do I grant permission to use a connection to another user?</summary>

Granting roles to users is done in Fabric/Power BI itself (*Manage connections and gateways*). Power Monitor's **Grant permissions** button grants access only to the **organization's Service Principal**, so that the product can read the permissions and metadata.

</details>

<details>

<summary>The gateway name appears as a code.</summary>

When the gateway name is not known, the screen shows the abbreviated ID (the full ID appears on hover). Check whether the gateway still exists and whether the Service Principal has access to it on the [Gateways](/en/power-monitor/governanca/infraestrutura/gateways.md) screen.

</details>

<details>

<summary>The "Used by" column shows "—". Is it the same as zero?</summary>

No. **—** means that usage is unknown (the data is not available). **0** means that no known consumer reads through the source.

</details>

## Related pages

* [Gateways](/en/power-monitor/governanca/infraestrutura/gateways.md)
* [Semantic Models](/en/power-monitor/governanca/modelos-semanticos.md)
* [Schedules](/en/power-monitor/governanca/operacao/agendamentos.md)
* [Deleted Artifacts](/en/power-monitor/governanca/operacao/artefatos-excluidos.md)
* [Mapping › Gateways](/en/power-monitor/mapeamento/gateways.md)
* [Mapping › Inventory](/en/power-monitor/mapeamento/inventarios.md)
* [Users](/en/power-monitor/usuarios.md)


---

# Agent Instructions
This documentation is published with GitBook. GitBook is the documentation platform designed so that both humans and AI agents can read, navigate, and reason over technical content effectively. Learn more at gitbook.com.

## Querying This Documentation
If you need additional information that is not directly available in this page, you can query the documentation by asking a question.

Perform an HTTP GET request on the following URL with the `ask` and `goal` query parameters:

```
GET https://docs.powermonitor.com.br/en/power-monitor/governanca/infraestrutura/conexoes.md?ask=<question>&goal=<user_goal>
```

`ask` is the immediate question: it should be specific, self-contained, and written in natural language.
`goal` is what the user is ultimately trying to achieve, the reason they need the answer. Sharing it helps GitBook give you a better, more relevant answer. A goal is most helpful when it describes the outcome the user wants rather than restating the question. For example, with `ask=how do I create an API token`, a goal like `automate deployments from our CI pipeline` lets GitBook tailor the answer to that use case.

The response will contain a direct answer to the question and relevant excerpts and sources from the documentation.

Use this mechanism when the answer is not explicitly present in the current page, you need clarification or additional context, or you want to retrieve related documentation sections.