> For the complete documentation index, see [llms.txt](https://docs.powermonitor.com.br/llms.txt). Markdown versions of documentation pages are available by appending `.md` to page URLs; this page is available as [Markdown](https://docs.powermonitor.com.br/en/power-monitor/governanca/infraestrutura/gateways.md).

# Gateways

Inventory of the tenant's data gateways, with version status against the Microsoft release catalog, permissions and reverse lineage (connections, models and tables).

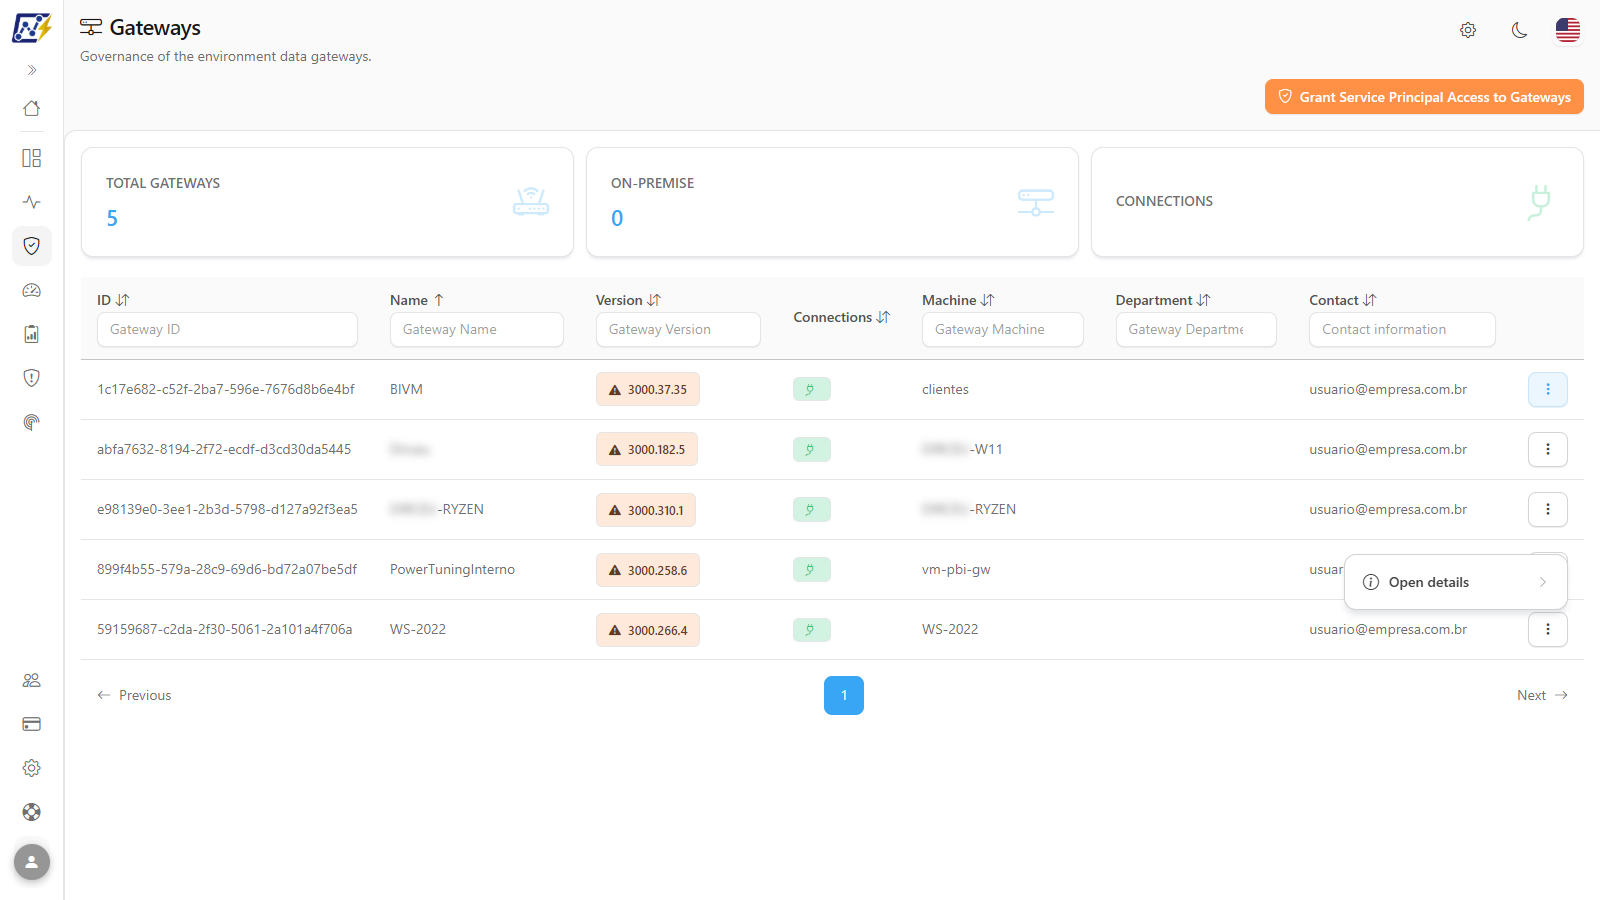
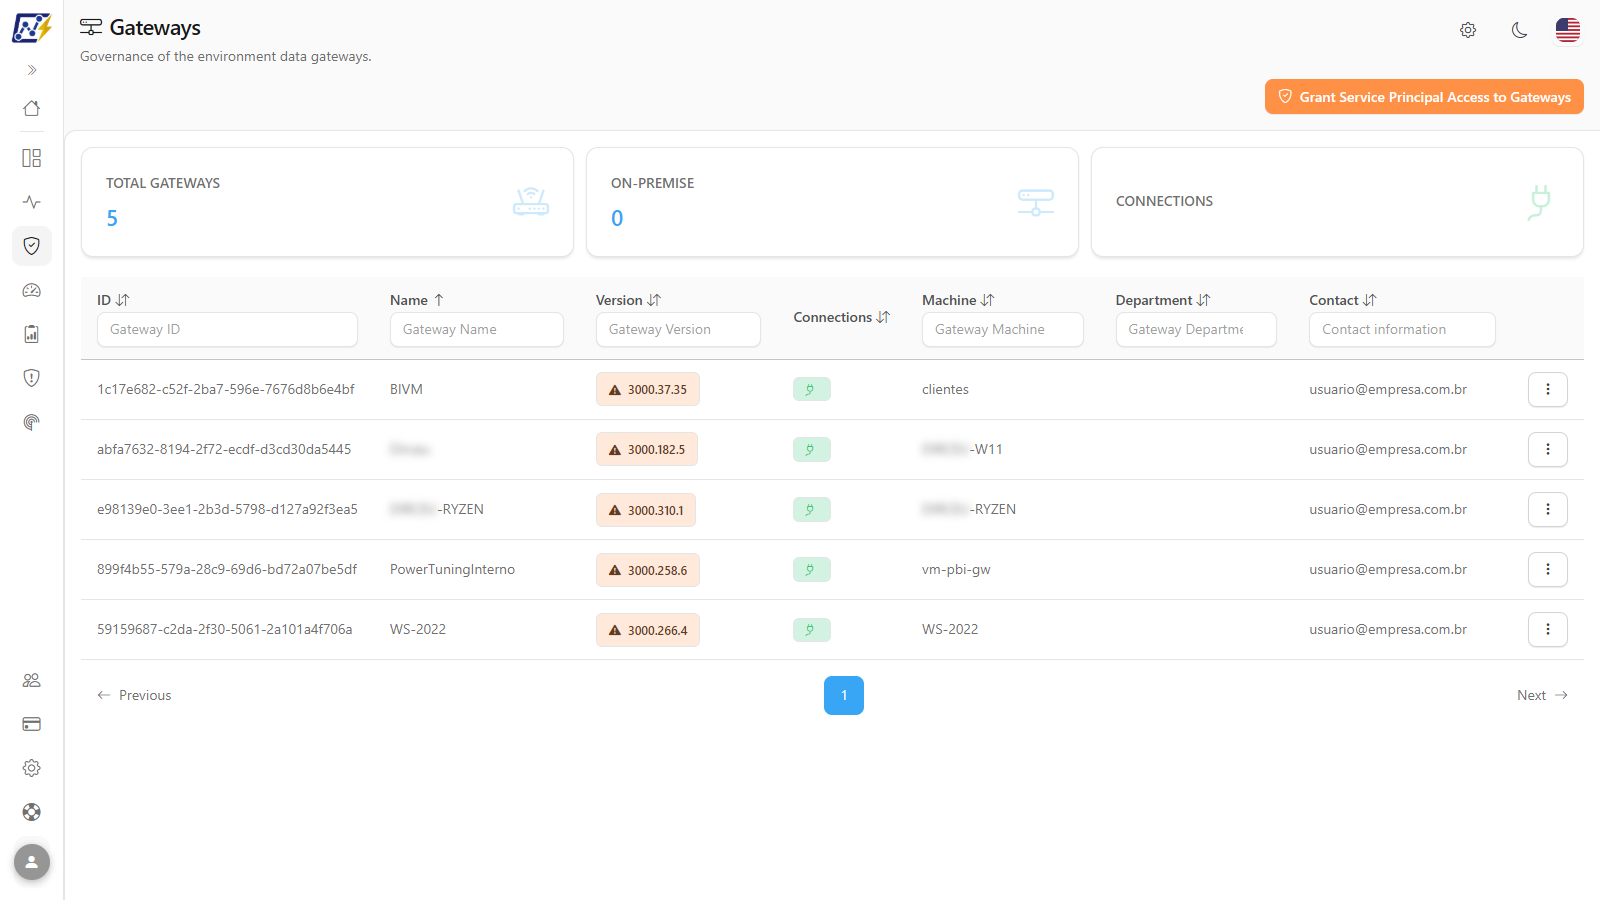
The **Gateways** screen catalogs the data gateways registered in your tenant (On-premises Data Gateway and virtual network gateways), with the installed version, machine, department and contact of each one. It also warns when the gateway version is **outdated or out of Microsoft support**, shows **who has permission** on each gateway and what **goes through it** (connections, semantic models, pipelines, dataflows and tables).

**How to access:** menu *Governance › Infrastructure › Gateways*.

**Who can use it:** the screen is visible to **all profiles** (User and Administrator). The **Grant Service Principal Access to Gateways** button appears only for **Administrators**, and the grant through the *Permissions* tab is also only executed for Administrators. The page can be hidden for specific users by the administrator, on the **Page access** tab of the [Users](/en/power-monitor/usuarios.md) record.

<figure><picture><source srcset="/files/0MbedvHv0CTw3XfYNtB7" media="(prefers-color-scheme: dark)"><img src="https://3938213054-files.gitbook.io/~/files/v0/b/gitbook-x-prod.appspot.com/o/spaces%2FH2bFRBmIfyK3kwVKbldl%2Fuploads%2Fgit-blob-e24349705714b64317a141ffa316c66aad7643c0%2Fpm-governanca-gateways-en.png?alt=media" alt="Gateways screen with the summary cards and the gateways table with the version badge"></picture><figcaption><p>Governance › Infrastructure › Gateways</p></figcaption></figure>

## What it is for

* **Keep gateways up to date**: identify gateways with an outdated version or already outside the versions supported by Microsoft, which may fail during data refreshes.
* **Know who is responsible** for each gateway (department and contact) and on which machine it is installed.
* **Audit permissions**: see who is an administrator or user of each gateway.
* **Assess the impact** of maintenance: find out which connections, semantic models and tables depend on a gateway before restarting, updating or migrating it.

## Screen overview

From top to bottom, the screen has:

1. **Header** with the title **Gateways** and the subtitle *"Governance of the environment data gateways."*
2. **Grant Service Principal Access to Gateways** button (Administrators only), on the right, and the summary panel of the last grant, when there is one.
3. **Summary cards**: **Total Gateways**, **On-Premise** and **Connections**.
4. **Gateways table** with text filter and sorting in the header, a **⋮** menu per row and pagination of 10 rows at a time.
5. **Details modal** of the gateway, with the **Information**, **Permissions**, **Connection Lineage**, **Item Lineage** and **Table Lineage** tabs.

## Features

### Grant Service Principal Access to Gateways

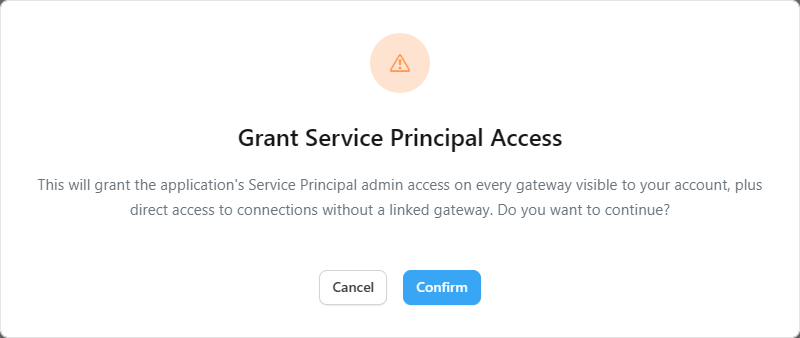
**What it is:** a button at the top of the screen, visible only to **Administrators**, that grants the Power Monitor Service Principal **admin access on every gateway visible to your account** and direct access to **connections without a linked gateway**.

**What it is for:** this access is what allows Power Monitor to read the permissions, connections and details of the gateways. Use it when deploying the product and whenever new gateways are created in the tenant. Without it, part of the information on this screen and on the [Connections](/en/power-monitor/governanca/infraestrutura/conexoes.md) screen may be incomplete (for example, the *Permissions* tab shows "No access granted").

<figure><picture><source srcset="/files/Wp6DVbRw2Yp1dibsfjNE" media="(prefers-color-scheme: dark)"><img src="https://3938213054-files.gitbook.io/~/files/v0/b/gitbook-x-prod.appspot.com/o/spaces%2FH2bFRBmIfyK3kwVKbldl%2Fuploads%2Fgit-blob-f259fa4c76930f5ff46ed1e4d2479995c0faaf7a%2Fpm-governanca-gateways-conceder-acesso-confirmacao-en.png?alt=media" alt="Grant Service Principal Access modal with the Cancel and Confirm buttons"></picture><figcaption><p>Confirmation of the Service Principal access grant</p></figcaption></figure>

**How to use:**

{% stepper %}
{% step %}

### Start the grant

In *Governance › Infrastructure › Gateways*, click **Grant Service Principal Access to Gateways** (above the cards).
{% endstep %}

{% step %}

### Confirm

The **Grant Service Principal Access** modal explains what will be done: *"This will grant the application's Service Principal admin access on every gateway visible to your account, plus direct access to connections without a linked gateway. Do you want to continue?"*. Click **Confirm** to proceed or **Cancel** to give up. During the process, the button shows **Granting access...**.
{% endstep %}

{% step %}

### Check the result

The message "Service Principal access granted to gateways." is displayed and the **Service Principal access grant completed** panel summarizes, in one line for **Gateways** and another for **Connections**, how many were granted, how many already had access, how many failed and how many were rate-limited by the Microsoft API. If there is nothing eligible, the panel states "No eligible gateway or connection was found under your access, so there was nothing to grant.". Close the panel with the **X**.
{% endstep %}
{% endstepper %}

**How it works / rules:**

* The grant uses **your** identity in Fabric (delegated permission): it only reaches the gateways and connections that you yourself can administer. If another Fabric administrator manages gateways that you cannot see, they must repeat the operation.
* "Rate-limited" items were temporarily rejected by the Microsoft API due to too many calls: repeat the grant a few minutes later.
* If the operation fails (for example, without permission or without the required consent completed), an error message is displayed and no summary appears.

### Summary cards

**What it is:** three cards at the top of the list: **Total Gateways** (number of listed gateways), **On-Premise** (how many are of the On-premises Data Gateway type) and **Connections**.

**What it is for:** giving the size of the gateway fleet and how much of it is on-premises, which helps plan monthly updates and server maintenance.

<figure><picture><source srcset="/files/1Es09tprU3rrTSBT0Aaf" media="(prefers-color-scheme: dark)"><img src="https://3938213054-files.gitbook.io/~/files/v0/b/gitbook-x-prod.appspot.com/o/spaces%2FH2bFRBmIfyK3kwVKbldl%2Fuploads%2Fgit-blob-39701abbd40fd93d9612f443660d2c96f64bbbb5%2Fpm-governanca-gateways-cards-en.png?alt=media" alt="Total Gateways, On-Premise and Connections cards"></picture><figcaption><p>Summary cards of the Gateways screen</p></figcaption></figure>

**How to use:**

1. Open *Governance › Infrastructure › Gateways* and read the **Total Gateways** and **On-Premise** numbers.
2. To see the number of connections, use the **Connections** column of the table (per gateway) or the [Connections](/en/power-monitor/governanca/infraestrutura/conexoes.md) screen (complete inventory).

**How it works:** the cards are calculated over the list returned with the **column filters** applied, so they adjust when you filter the table. The **Connections** card is only a reference and does not display a counter: the count per gateway is in the **Connections** column.

### Gateways table

**What it is:** the list of the tenant's gateways, one per row.

**What it is for:** locating a gateway and seeing at a glance its version, number of connections and owner.

**How to use:** go through the columns below; click a row to open the details (see the **Details modal: Information tab** feature).

| Column          | Description                                                                                                                               |
| --------------- | ----------------------------------------------------------------------------------------------------------------------------------------- |
| **ID**          | Identifier (GUID) of the gateway in Fabric                                                                                                |
| **Name**        | Gateway name, with the type badge: **On-Premise** (blue) or **VNet** (virtual network gateway). Unrecognized types appear without a badge |
| **Version**     | Installed version, in a badge colored by the update status (see the next feature)                                                         |
| **Connections** | Number of connections associated with the gateway                                                                                         |
| **Machine**     | Name of the server or VM where the gateway is installed                                                                                   |
| **Department**  | Department entered in the gateway record                                                                                                  |
| **Contact**     | Contact information of the owner, as registered in the gateway                                                                            |

**How it works:** the data comes from the [Gateway Scan](/en/power-monitor/mapeamento/gateways.md). Gateways deleted in Fabric do not appear here; they are listed in [Deleted Artifacts](/en/power-monitor/governanca/operacao/artefatos-excluidos.md). When no gateway matches the filters (or no gateways have been collected), the table shows "No gateway registered".

### Version badge and update status

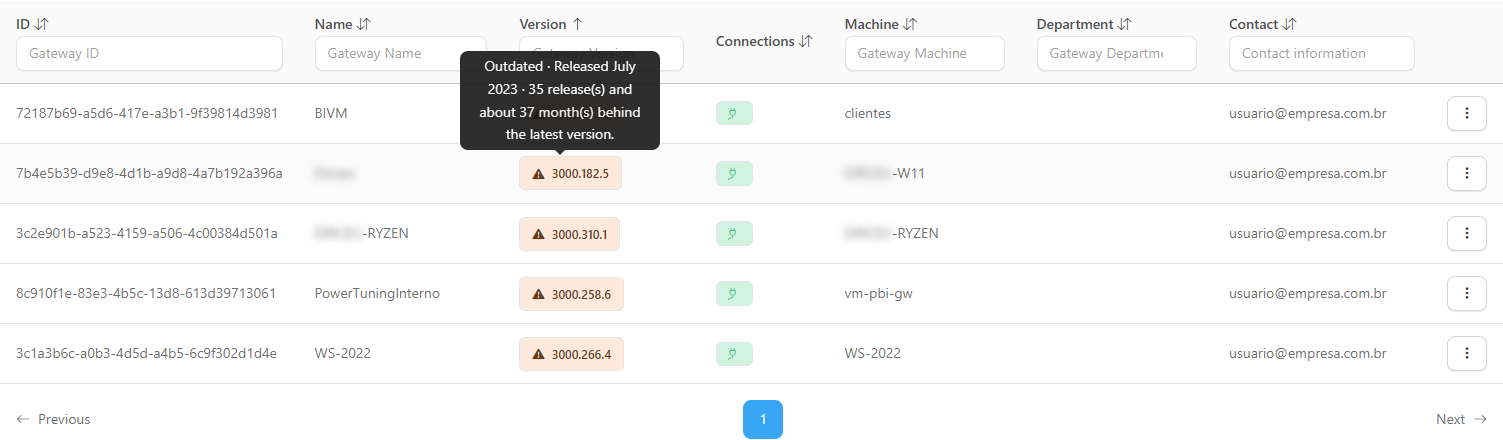
**What it is:** in the **Version** column, the installed version appears in a badge whose color and icon indicate whether the gateway is up to date with Microsoft's monthly releases. Hover over the badge to see the status, the release month ("Released *month*") and how far behind the latest version it is.

**What it is for:** quickly finding gateways that need updating before they fail during data refreshes or lose support.

<figure><picture><source srcset="/files/G0fQq7c4D4uHfzuRFqvp" media="(prefers-color-scheme: dark)"><img src="https://3938213054-files.gitbook.io/~/files/v0/b/gitbook-x-prod.appspot.com/o/spaces%2FH2bFRBmIfyK3kwVKbldl%2Fuploads%2Fgit-blob-f2204c7aaad2ef5ae64820ebac8231bcf93411fc%2Fpm-governanca-gateways-versao-tooltip-en.png?alt=media" alt="Version badge tooltip with status, release month and delay"></picture><figcaption><p>Version badge tooltip</p></figcaption></figure>

**How to use:**

1. In the **Version** column, identify the badge color.
2. Hover over the badge to read the details.
3. To prioritize, sort by the **Version** column (see the **Sorting and pagination** feature) and handle the red badges first.

| Badge                   | Color  | Meaning                                                                                                                                                                                                              |
| ----------------------- | ------ | -------------------------------------------------------------------------------------------------------------------------------------------------------------------------------------------------------------------- |
| **Up to date**          | Green  | The gateway is on the latest version published by Microsoft                                                                                                                                                          |
| **Outdated**            | Yellow | The version is in the catalog, but there are newer versions. The details show how many versions and approximately how many months behind, for example "2 release(s) and about 2 month(s) behind the latest version." |
| **Unsupported**         | Red    | The version is older than the oldest version still supported. Microsoft only supports the **last 6 monthly releases**: update as soon as possible                                                                    |
| **Uncataloged version** | Gray   | The version is not in the official release list known to Power Monitor                                                                                                                                               |

**How it works / rules:**

* **Release catalog:** Power Monitor syncs the official On-premises Data Gateway monthly updates page **once a day**. The catalog **accumulates** the versions already seen, so older gateways keep a known release month even after Microsoft removes the version from the page.
* The comparison considers only the first two numbers of the version (for example, 3000.330), ignoring the build.
* **"Unsupported" is relative to the catalog:** it means older than the oldest version in the Power Monitor catalog. Since the catalog accumulates versions already removed from the Microsoft page, an **Outdated** gateway more than 6 versions behind may also already be out of support: check the delay in the tooltip or on the version card.
* A very recent version, released after the last daily sync, may appear as **Uncataloged version** until the next sync.

### Column filters

**What it is:** text boxes below the titles of the **ID** (*Gateway ID*), **Name** (*Gateway Name*), **Version** (*Gateway Version*), **Machine** (*Gateway Machine*), **Department** (*Gateway Department*) and **Contact** (*Contact information*) columns. The **Connections** column has no filter.

**What it is for:** locating a gateway by name, finding all gateways of the same version (for example, by typing the beginning of the version number) or of the same server or department.

<figure><picture><source srcset="/files/KJ0JKz0O2iB1jzOalrCC" media="(prefers-color-scheme: dark)"><img src="https://3938213054-files.gitbook.io/~/files/v0/b/gitbook-x-prod.appspot.com/o/spaces%2FH2bFRBmIfyK3kwVKbldl%2Fuploads%2Fgit-blob-9e97b65bc52bfa5df2067bca56d4a35531d4a2ac%2Fpm-governanca-gateways-filtros-colunas-en.png?alt=media" alt="Header of the gateways table with the filter boxes of each column"></picture><figcaption><p>Column filters of the gateways table</p></figcaption></figure>

**How to use:**

1. Type the term in the filter box of the desired column.
2. The table is filtered automatically right after you stop typing and returns to the first page. The summary cards follow the result.
3. Combine filters on different columns to refine (all of them must be met).
4. To return to the complete list, delete the text in the filters.

**How it works:** the **Name**, **Version**, **Machine**, **Department** and **Contact** filters look for the text anywhere in the value, without distinguishing uppercase from lowercase. The **ID** filter requires the gateway's **complete identifier** (GUID): copy the ID from the column or the modal and paste it in full.

### Sorting and pagination

**What it is:** click a column title to sort the list by it; the table is paginated with **10 gateways per page**.

**What it is for:** grouping gateways of the same version, machine or department, and browsing large lists.

**How to use:**

1. Click the column title (**Name**, **Version**, **Machine**, **Department** or **Contact**). The first click sorts in ascending order (up arrow); click again to reverse it (down arrow).
2. Use the page controls below the table to navigate.

**How it works:** by default, the list is sorted by **Name**, in ascending order. Sorting by **Version** compares the version text. Changing a filter returns to the first page.

### Row actions menu (⋮)

**What it is:** the **⋮** button at the end of each row (or right-clicking the row) opens the menu with **Open details**. When you hover over **Open details**, a submenu goes directly to **Information** or **Lineage**.

**What it is for:** going directly to the desired tab of the modal, without going through the *Information* tab.

<figure><picture><source srcset="/files/0MbedvHv0CTw3XfYNtB7" media="(prefers-color-scheme: dark)"><img src="https://3938213054-files.gitbook.io/~/files/v0/b/gitbook-x-prod.appspot.com/o/spaces%2FH2bFRBmIfyK3kwVKbldl%2Fuploads%2Fgit-blob-5a8b03402cfb7d126c7252cbdf480ea60d38e78f%2Fpm-governanca-gateways-menu-acoes-en.png?alt=media" alt="Gateway row actions menu with the Open details submenu open"></picture><figcaption><p>⋮ menu with the Open details submenu</p></figcaption></figure>

**How to use:**

1. Click **⋮** on the gateway row (or right-click the row).
2. Click **Open details** to open the modal on the **Information** tab, or hover over it and choose **Information** or **Lineage** (opens the **Item Lineage** tab).

**How it works:** clicking anywhere on the row also opens the modal on the **Information** tab.

### Details modal: Information tab

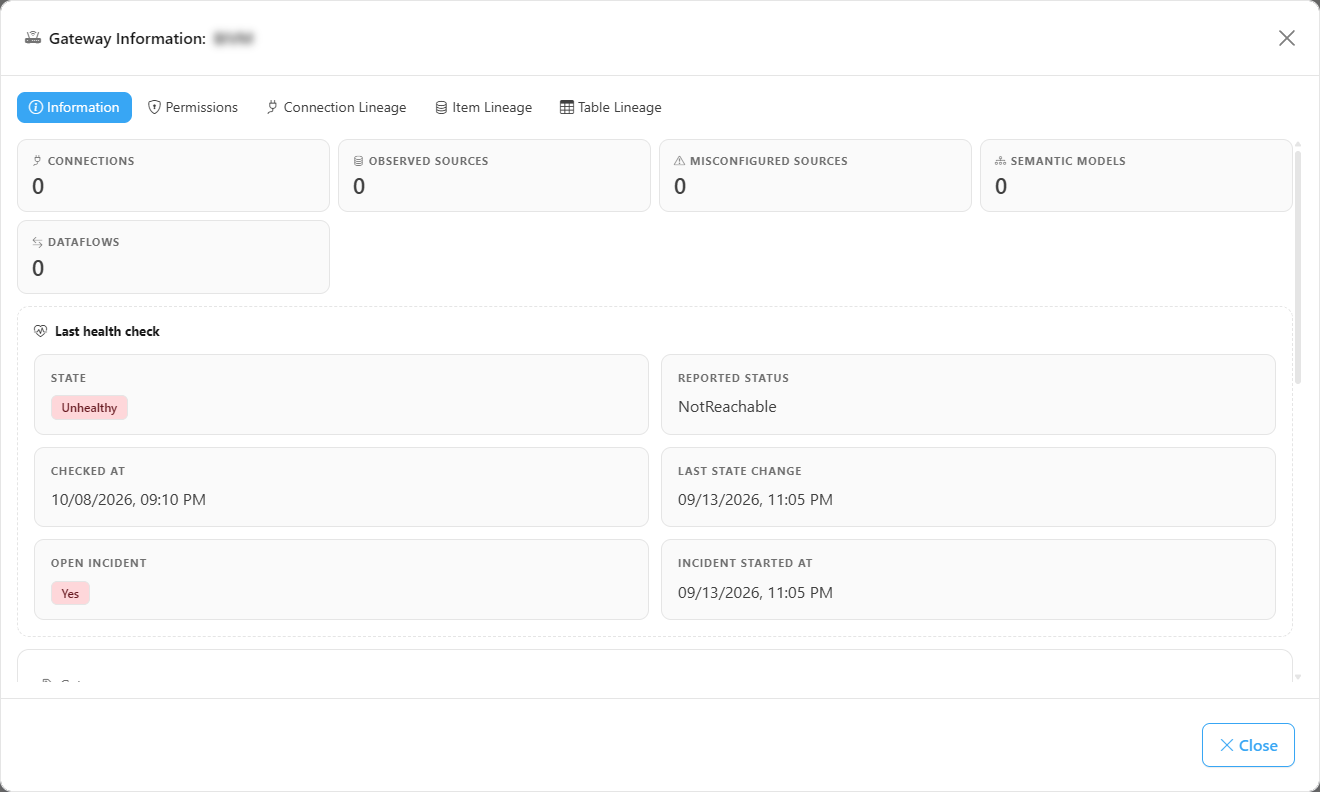
**What it is:** the first tab of the **Gateway Information:&#x20;*****name*** modal, with the gateway's usage indicators, the last health check and all the record data.

**What it is for:** checking in one place how much the gateway is used, whether it is healthy, and the gateway's identifier, version, connections, owner and public keys.

<figure><picture><source srcset="/files/izbovyXhJk5LiCfTxlDT" media="(prefers-color-scheme: dark)"><img src="https://3938213054-files.gitbook.io/~/files/v0/b/gitbook-x-prod.appspot.com/o/spaces%2FH2bFRBmIfyK3kwVKbldl%2Fuploads%2Fgit-blob-9dfaa8c409b626be1b33d8b3277df0bfd050df4f%2Fpm-governanca-gateways-modal-informacoes-en.png?alt=media" alt="Gateway Information modal with the version card and the Update button"></picture><figcaption><p>Information tab, with the version status</p></figcaption></figure>

**How to use:**

1. Click the gateway row (or use **⋮ › Open details**).
2. Read the indicators and the sections at the top (see below).
3. Read the cards: **Gateway name** (with the machine and the type badge), **ID** (Power Monitor internal identifier), **Remote ID** (identifier of the gateway in Fabric), **Version**, **Connections**, **Department**, **Contact information** and **Technical information**.
4. Click **Close** (or the **X**) to exit.

**How it works:**

* The top of the tab follows the [common Overview structure](/en/power-monitor/governanca/relatorios.md#the-overview-tab). The indicators are **Connections**, **Observed sources** (data sources in use by semantic models that go through the gateway), **Misconfigured sources** (the ones Power BI could not resolve), **Semantic models** and **Dataflows**. **Semantic models** and **Dataflows** are minimum values: sources without a stable identifier are not counted.
* The **Connections by type** section splits the connections by connectivity type (*Type not captured* when the type did not come in the scan).
* The **Last health check** section shows the **State** (*Healthy*, *Degraded*, *Unhealthy* or *Unknown*), the **Reported status**, **Checked at**, **Last state change** and, when there is one, the open incident and the start and end dates of the last incident. Without a check, "This gateway has not been checked yet." appears.
* When the gateway no longer exists, the banner "Removed from Fabric/Power BI since *date*." appears at the top.
* The **Department** and **Contact information** cards only appear when the data was filled in the gateway record, and the **Version** card only appears when the version is known.

### Version card and Update button

**What it is:** a card on the *Information* tab that shows the installed version, the status badge, the release month ("Released *month*"), the delay and "Latest version: *version* (*month*)", with the **Update** button. When the gateway needs updating, the card gets a colored border and the button is highlighted.

**What it is for:** knowing exactly how far behind the gateway is and getting the latest installer.

<figure><picture><source srcset="/files/615OrmWQyMqACmf9RyFp" media="(prefers-color-scheme: dark)"><img src="https://3938213054-files.gitbook.io/~/files/v0/b/gitbook-x-prod.appspot.com/o/spaces%2FH2bFRBmIfyK3kwVKbldl%2Fuploads%2Fgit-blob-4f74592f20182e85e5ae773c71f7e387cd95b439%2Fpm-governanca-gateways-modal-cartao-versao-en.png?alt=media" alt="Version card with status, release month, latest version and Update button"></picture><figcaption><p>Version card of the Information tab</p></figcaption></figure>

**How to use:**

{% stepper %}
{% step %}

### Open the version card

Open the gateway details. On the **Information** tab, locate the **Version** card and check the status and the delay.
{% endstep %}

{% step %}

### Download the installer

Click **Update** (*"Download the latest On-premises Data Gateway from the Microsoft website"*). The On-premises Data Gateway download page on the Microsoft website opens in a new tab.
{% endstep %}

{% step %}

### Update on the server

The installation is done on the gateway server, outside Power Monitor. The new version appears on this screen after the next run of the [Gateway Scan](/en/power-monitor/mapeamento/gateways.md).
{% endstep %}
{% endstepper %}

**How it works:** the **Update** button always takes you to the official Microsoft download page, which delivers the latest monthly version; it does not install anything automatically.

### Connections card and View button

**What it is:** a card on the *Information* tab with the number of connections of the gateway and the **View** button.

**What it is for:** going from the gateway to the detailed list of connections configured on it, with privacy, credential and usage.

**How to use:**

1. Open the gateway details and, on the **Information** tab, locate the **Connections** card.
2. Click **View**. The [Connections](/en/power-monitor/governanca/infraestrutura/conexoes.md) screen opens already filtered by this gateway, with the banner "Filtering connections for gateway: *name*".

**How it works:** the **View** button is disabled when the gateway has no connections. For a quick view without leaving the modal, use the **Connection Lineage** tab.

### Technical information

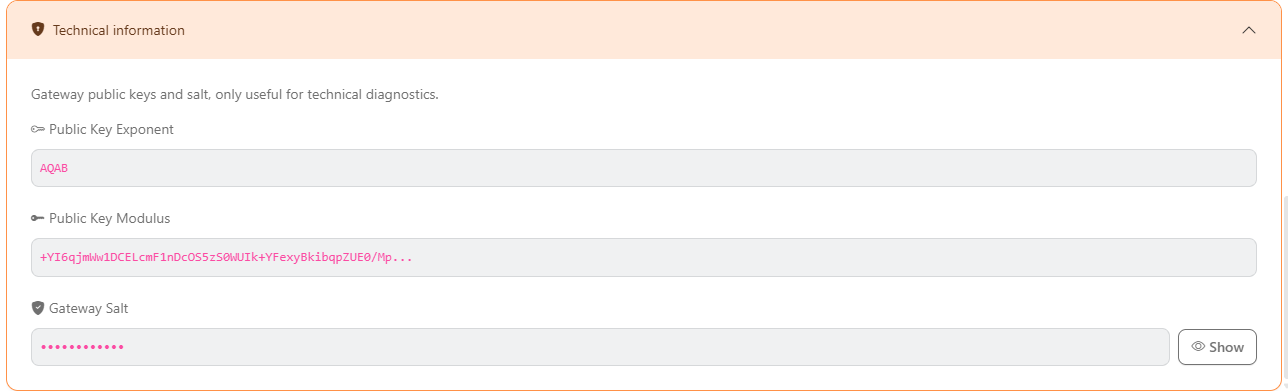
**What it is:** the collapsible **Technical information** card (formerly called *Security information*), with the gateway's public keys and salt: **Public Key Exponent**, **Public Key Modulus** and **Gateway Salt**, displayed in abbreviated form.

**What it is for:** confirming, in a technical diagnosis, that the gateway has the encryption keys registered, which Fabric uses to encrypt credentials sent to the gateway.

<figure><picture><source srcset="/files/MFfCVwqdw8ieNdY17rWq" media="(prefers-color-scheme: dark)"><img src="https://3938213054-files.gitbook.io/~/files/v0/b/gitbook-x-prod.appspot.com/o/spaces%2FH2bFRBmIfyK3kwVKbldl%2Fuploads%2Fgit-blob-008e18093d3ce00635abd4c6992159bc0195d1db%2Fpm-governanca-gateways-modal-seguranca-en.png?alt=media" alt="Technical information card open, with the gateway&#x27;s public keys and the Gateway Salt hidden with the Show button"></picture><figcaption><p>Gateway technical information</p></figcaption></figure>

**How to use:**

1. Open the gateway details and scroll the **Information** tab to the **Technical information** card.
2. Click the card title to open it.
3. To see the **Gateway Salt**, click **Show**; click **Hide** to hide it again.

**How it works:** the card comes collapsed and the salt comes hidden (*••••••••••••*), so they are not exposed in screenshots and screen sharing. When you switch gateways or close the modal, the card collapses again and the salt is hidden again. When the gateway does not have this information, the tab shows the warning "This gateway does not have security information configured.".

### Permissions tab

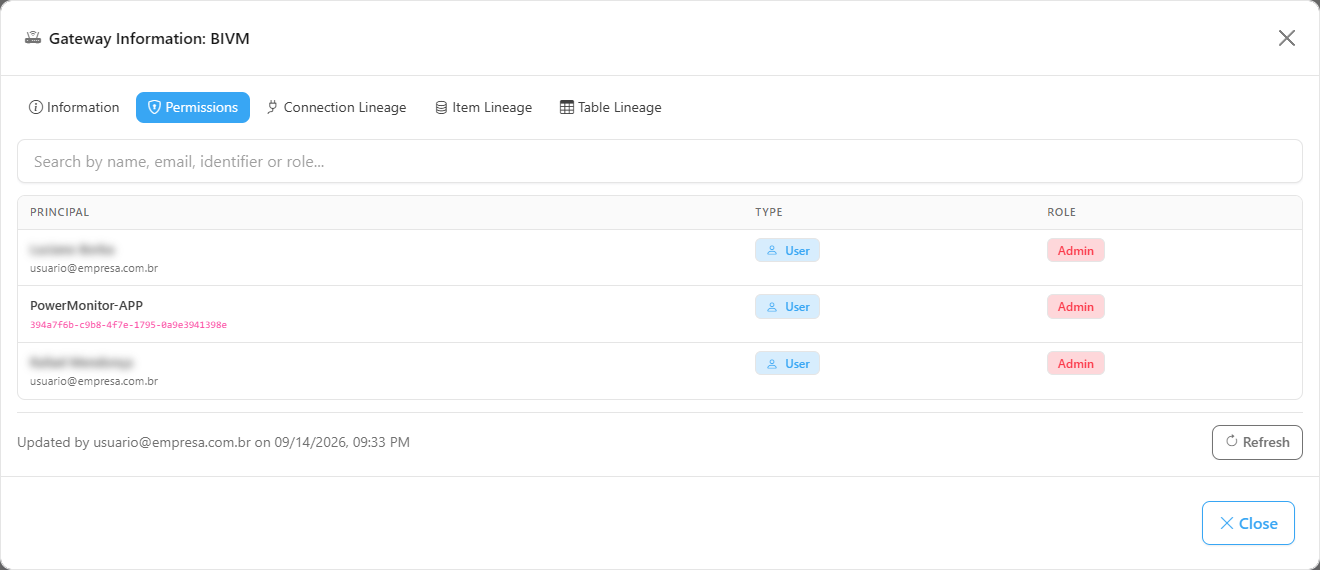
**What it is:** the list of users, groups and service principals with a role on the gateway in Fabric.

**What it is for:** auditing who can administer the gateway and who can create connections on it.

<figure><picture><source srcset="/files/AOIBO1ElEOABvTs9uKfm" media="(prefers-color-scheme: dark)"><img src="https://3938213054-files.gitbook.io/~/files/v0/b/gitbook-x-prod.appspot.com/o/spaces%2FH2bFRBmIfyK3kwVKbldl%2Fuploads%2Fgit-blob-40ed8a382213f2e275cafeadb52030345674d9ae%2Fpm-governanca-gateways-modal-permissoes-en.png?alt=media" alt="Permissions tab of the gateway modal"></picture><figcaption><p>Permissions tab</p></figcaption></figure>

**How to use:**

{% stepper %}
{% step %}

### Open the tab

Open the gateway details and click the **Permissions** tab. The screen displays "Loading permissions..." while it fetches the last recorded result.
{% endstep %}

{% step %}

### Search

Use the *Search by name, email, identifier or role...* box. The table shows **Principal** (name and, below it, e-mail or identifier), **Type** (**User**, **Group** or **Service Principal**) and **Role**.
{% endstep %}

{% step %}

### Refresh the query

The footer shows "Updated by *name* on *date*". Click **Refresh** to query Fabric again.
{% endstep %}

{% step %}

### If "No access granted" appears

The Service Principal does not yet have permission on the gateway. An **Administrator** can click **Grant permissions** on the tab itself (the same grant as the button at the top of the screen). At the end, the grant summary panel appears on the tab and it is queried again.
{% endstep %}
{% endstepper %}

**How it works / rules:**

* The tab shows the **last result queried** in Fabric (with author and date) and only queries again when you click **Refresh**, which is available to all profiles.
* Roles are displayed with spaces between words and in color: **Admin** in red, **Connection Creator With Resharing** in yellow and **Connection Creator** in blue.
* Other states: "No permissions found." (query with no results) and "Failed to fetch permissions", with the **Retry** button.
* **Grant permissions** is only executed for **Administrators**; for other profiles, the operation is rejected.

### Connection Lineage tab

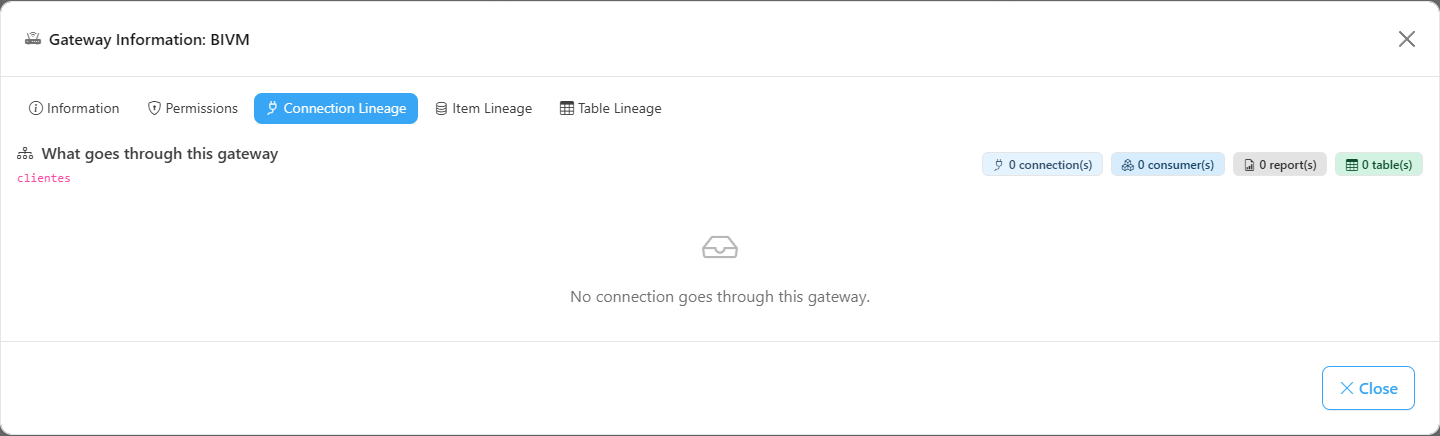
**What it is:** the list of connections configured on the gateway, with the **Connection**, **Type**, **Path** and **Credential** columns. The lineage header ("What goes through this gateway") shows the counters of connections, consumers, reports and tables.

**What it is for:** seeing, without leaving the modal, which connections would be affected by a gateway outage and what type of credential each one uses.

<figure><picture><source srcset="/files/CuB0hPOs1ZJZXdPCBOCK" media="(prefers-color-scheme: dark)"><img src="https://3938213054-files.gitbook.io/~/files/v0/b/gitbook-x-prod.appspot.com/o/spaces%2FH2bFRBmIfyK3kwVKbldl%2Fuploads%2Fgit-blob-fb8db4212761283402d0bd903f36078a04412c6d%2Fpm-governanca-gateways-modal-linhagem-conexoes-en.png?alt=media" alt="Connection Lineage tab of the gateway modal"></picture><figcaption><p>Connection Lineage tab</p></figcaption></figure>

**How to use:**

1. Open the gateway details and click the **Connection Lineage** tab.
2. Filter using the *Filter Connection...* and *Filter Path...* boxes, or select one or more values in the **Type** and **Credential** lists.
3. If no connection matches the filter, the tab shows "No results for the applied filter.".

**How it works:** when the gateway has no connections, the tab states "No connection goes through this gateway.". The three lineage tabs are loaded only once per gateway; switching between them does not rerun the query.

### Item Lineage tab

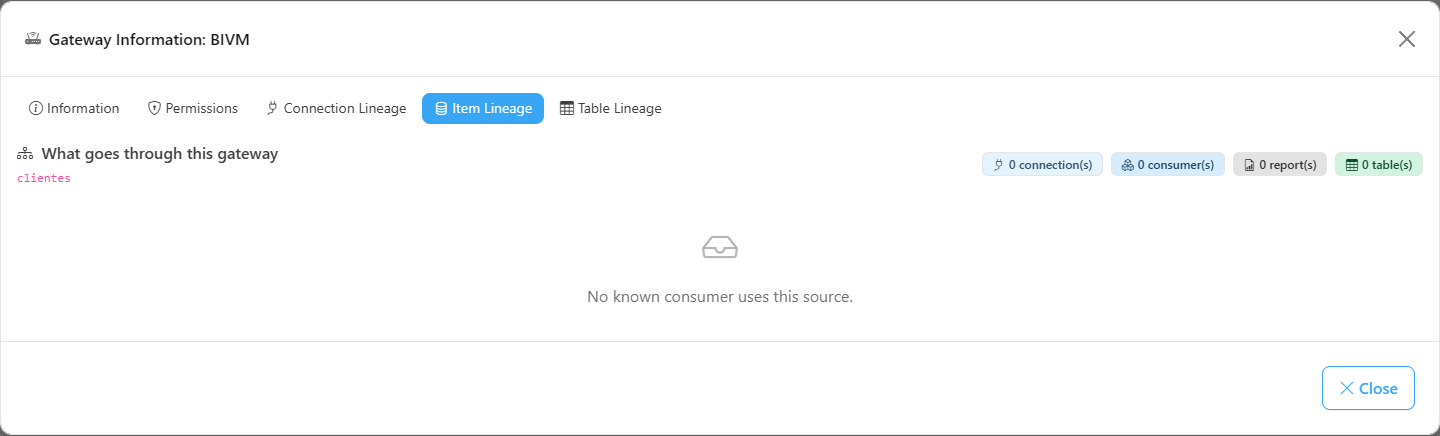
**What it is:** the consumers that read through the gateway's connections: **semantic models** (with their reports), **Data Pipelines**, **Dataflows** and **Mirrored Databases**, with the **Consumer**, **Type**, **Workspace**, **Via connection** and **Reports** columns.

**What it is for:** assessing the impact of maintenance on the gateway and knowing whom to notify.

<figure><picture><source srcset="/files/PmD0WJghiJjMaCRc0JI8" media="(prefers-color-scheme: dark)"><img src="https://3938213054-files.gitbook.io/~/files/v0/b/gitbook-x-prod.appspot.com/o/spaces%2FH2bFRBmIfyK3kwVKbldl%2Fuploads%2Fgit-blob-0a455a97b07791f30479a2970033db94368b67a1%2Fpm-governanca-gateways-modal-linhagem-itens-en.png?alt=media" alt="Item Lineage tab of the gateway modal"></picture><figcaption><p>Item Lineage tab: what goes through this gateway</p></figcaption></figure>

**How to use:**

1. In the gateway's **⋮** menu, choose **Open details › Lineage**, or open the modal and click the **Item Lineage** tab.
2. See each consumer, the workspace and the connection through which it reads (**Via connection** column).
3. Filter using the **Consumer**, **Workspace**, **Via connection** and **Reports** boxes; in the **Type** column, select one or more consumer types (**Clear selection** removes the choice).
4. Use the row's shortcut button (**Open model in Power BI**) or click the name of a report (**Open report in Power BI**) to go directly to the item.

**How it works:** only semantic models have linked reports. For the other types, the **Reports** column shows "Not applicable" (the data is not missing); a model without reports shows "No reports". Without consumers, the tab states "No known consumer uses this source.".

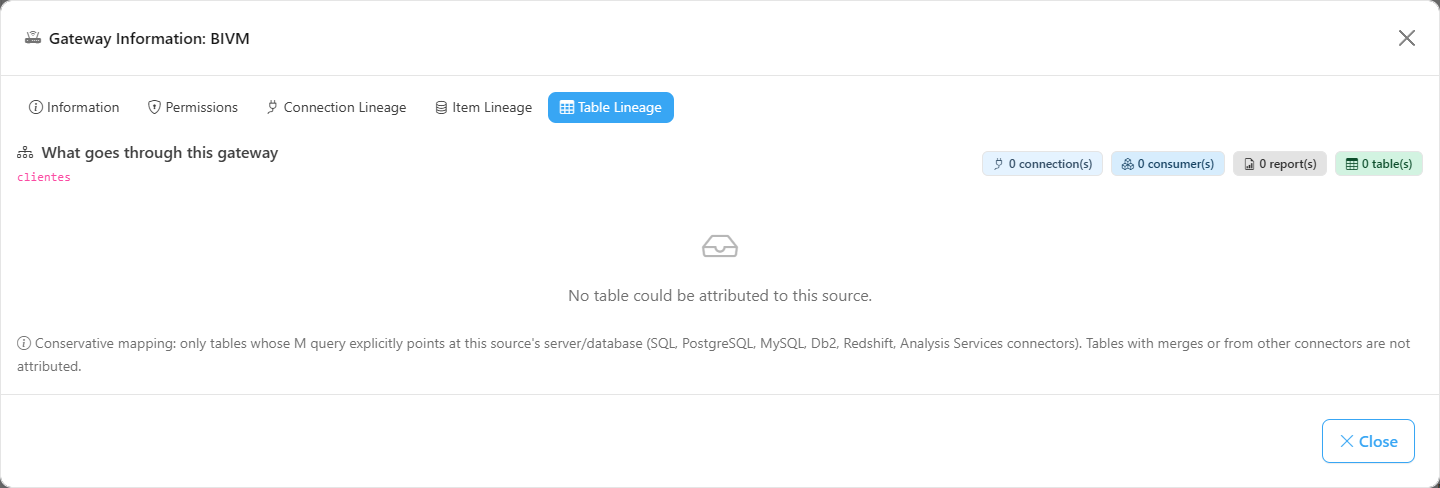
### Table Lineage tab

**What it is:** the semantic model tables attributed to the gateway's sources, with the **Table**, **Source object**, **Semantic model**, **Workspace**, **Via connection** and **Reports** columns.

**What it is for:** going down to the table level: knowing exactly which tables of which models read through this gateway.

<figure><picture><source srcset="/files/BLXvR9jVNXH7rE3erYft" media="(prefers-color-scheme: dark)"><img src="https://3938213054-files.gitbook.io/~/files/v0/b/gitbook-x-prod.appspot.com/o/spaces%2FH2bFRBmIfyK3kwVKbldl%2Fuploads%2Fgit-blob-a95ba507097cb75e83922454042845caf99eacf8%2Fpm-governanca-gateways-modal-linhagem-tabelas-en.png?alt=media" alt="Table Lineage tab of the gateway modal"></picture><figcaption><p>Table Lineage tab</p></figcaption></figure>

**How to use:**

1. Open the gateway details and click the **Table Lineage** tab.
2. Filter using the boxes of each column.
3. Click the semantic model name to open it in Power BI, or a report to open the report.

**How it works:** the mapping is **conservative**: only tables whose M query explicitly points to the source's server/database are attributed (SQL, PostgreSQL, MySQL, Db2, Redshift and Analysis Services connectors). Tables with merges or from other connectors are not attributed. Without attributable tables, the tab states "No table could be attributed to this source.".

### Loading and error states

**What it is:** messages displayed when there is no data or a query fails.

**What it is for:** distinguishing "does not exist" from "could not be loaded".

| Message                         | Where                              | Meaning                                                       |
| ------------------------------- | ---------------------------------- | ------------------------------------------------------------- |
| **No gateway registered**       | Table                              | No gateway collected or none matches the current filters      |
| **Failed to load gateways.**    | Notice in the corner of the screen | The list could not be loaded; reload the page                 |
| **Could not load the lineage.** | Lineage tabs                       | Failed to build the lineage; click **Retry**                  |
| **No access granted**           | Permissions tab                    | The Service Principal does not have permission on the gateway |
| **Failed to fetch permissions** | Permissions tab                    | The query to Fabric failed; click **Retry**                   |

## How to use: common tasks

### How to find gateways that need updating

{% stepper %}
{% step %}

### Sort by version

In *Governance › Infrastructure › Gateways*, click the **Version** column title to group the versions.
{% endstep %}

{% step %}

### Identify the red and yellow badges

**Unsupported** (red) badges are the priority; **Outdated** (yellow) indicates a delay of one or more monthly versions. Hover over them to see the delay.
{% endstep %}

{% step %}

### Contact the owner

Open the gateway, check **Machine**, **Department** and **Contact information** and use the **Update** button on the **Version** card to get the latest installer.
{% endstep %}
{% endstepper %}

### How to assess the impact of maintenance on the gateway

{% stepper %}
{% step %}

### Open the lineage

In the gateway's **⋮** menu, choose **Open details › Lineage**. The modal opens on the **Item Lineage** tab, with the title "What goes through this gateway".
{% endstep %}

{% step %}

### Review the consumers

See the semantic models, pipelines, dataflows and mirrored databases that read through the gateway, the connection through which each one reads (**Via connection**) and the reports of each model.
{% endstep %}

{% step %}

### Check the connections and tables

On the **Connection Lineage** tab, see which connections will be affected; on **Table Lineage**, which model tables read through the gateway's sources. Notify the owners of the listed workspaces.
{% endstep %}
{% endstepper %}

### How to enable permission reading for new gateways

{% stepper %}
{% step %}

### Check the Permissions tab

Open a newly created gateway and click the **Permissions** tab. If **No access granted** appears, the Service Principal does not have access yet.
{% endstep %}

{% step %}

### Grant the access (Administrator)

Click **Grant Service Principal Access to Gateways** at the top of the screen and confirm. Use an account that administers the gateways in Fabric.
{% endstep %}

{% step %}

### Refresh the tab

Go back to the gateway's **Permissions** tab and click **Refresh**.
{% endstep %}
{% endstepper %}

## Rules and behavior

* **Data source:** gateways are collected by the [Gateway Scan](/en/power-monitor/mapeamento/gateways.md) (Fabric API). Changes made in Fabric appear after the next scan run.
* **Release catalog:** synced once a day from the official On-premises Data Gateway monthly updates page, accumulating the versions already seen (see the **Version badge and update status** feature).
* **Permissions:** they are recorded with the date and author of the last query; the query to Fabric is only rerun when you click **Refresh**.
* **Gateways deleted** in Fabric are removed from this list and appear in [Deleted Artifacts](/en/power-monitor/governanca/operacao/artefatos-excluidos.md).
* **Read-only with respect to the gateway:** the screen does not change gateway settings. The only write action is granting access to the Service Principal, exclusive to Administrators.

{% hint style="info" %}
This screen covers the **registration, version and permissions** of gateways. For real-time online/offline status and unavailability alerts, use [Monitoring › Gateways](/en/power-monitor/monitoramento/gateways.md).
{% endhint %}

## Frequently asked questions

<details>

<summary>What should I do with a gateway marked as "Unsupported"?</summary>

The installed version is older than the monthly versions that Microsoft still supports. Update the gateway on the server (the **Update** button on the **Version** card takes you to the download page) to avoid refresh and cloud authentication failures.

</details>

<details>

<summary>Why does a gateway appear as "Uncataloged version"?</summary>

The version is not in the release catalog known to Power Monitor. This can happen with very recent versions, released after the catalog's last daily sync, or with versions outside the official numbering pattern.

</details>

<details>

<summary>The Permissions tab shows "No access granted".</summary>

The organization's Service Principal does not yet have permission on the gateway in the Fabric API. An administrator can use **Grant permissions** on the tab itself or the **Grant Service Principal Access to Gateways** button at the top of the screen.

</details>

<details>

<summary>I do not see the "Grant Service Principal Access to Gateways" button.</summary>

The button is displayed only to users with the **Administrator** profile in Power Monitor.

</details>

<details>

<summary>I filtered by ID and nothing appeared.</summary>

The **ID** filter requires the gateway's complete identifier (GUID). Copy the value from the **ID** column and paste it in full in the filter box.

</details>

<details>

<summary>I updated the gateway, but the old version still appears.</summary>

The version is read by the [Gateway Scan](/en/power-monitor/mapeamento/gateways.md). Wait for the next scan run to see the new version.

</details>

## Related pages

* [Connections](/en/power-monitor/governanca/infraestrutura/conexoes.md)
* [Monitoring › Gateways](/en/power-monitor/monitoramento/gateways.md)
* [Mapping › Gateways](/en/power-monitor/mapeamento/gateways.md)
* [Deleted Artifacts](/en/power-monitor/governanca/operacao/artefatos-excluidos.md)
* [Schedules](/en/power-monitor/governanca/operacao/agendamentos.md) (the Timeline filters refresh runs by gateway)
* [Users](/en/power-monitor/usuarios.md)


---

# Agent Instructions
This documentation is published with GitBook. GitBook is the documentation platform designed so that both humans and AI agents can read, navigate, and reason over technical content effectively. Learn more at gitbook.com.

## Querying This Documentation
If you need additional information that is not directly available in this page, you can query the documentation by asking a question.

Perform an HTTP GET request on the following URL with the `ask` and `goal` query parameters:

```
GET https://docs.powermonitor.com.br/en/power-monitor/governanca/infraestrutura/gateways.md?ask=<question>&goal=<user_goal>
```

`ask` is the immediate question: it should be specific, self-contained, and written in natural language.
`goal` is what the user is ultimately trying to achieve, the reason they need the answer. Sharing it helps GitBook give you a better, more relevant answer. A goal is most helpful when it describes the outcome the user wants rather than restating the question. For example, with `ask=how do I create an API token`, a goal like `automate deployments from our CI pipeline` lets GitBook tailor the answer to that use case.

The response will contain a direct answer to the question and relevant excerpts and sources from the documentation.

Use this mechanism when the answer is not explicitly present in the current page, you need clarification or additional context, or you want to retrieve related documentation sections.