> For the complete documentation index, see [llms.txt](https://docs.powermonitor.com.br/llms.txt). Markdown versions of documentation pages are available by appending `.md` to page URLs; this page is available as [Markdown](https://docs.powermonitor.com.br/en/power-monitor/governanca/modelos-semanticos.md).

# Semantic Models

Inventory and governance of Power BI and Fabric semantic models (datasets), storage mode, RLS, size, schema, lineage, model diagram, refresh history and governance metadata.

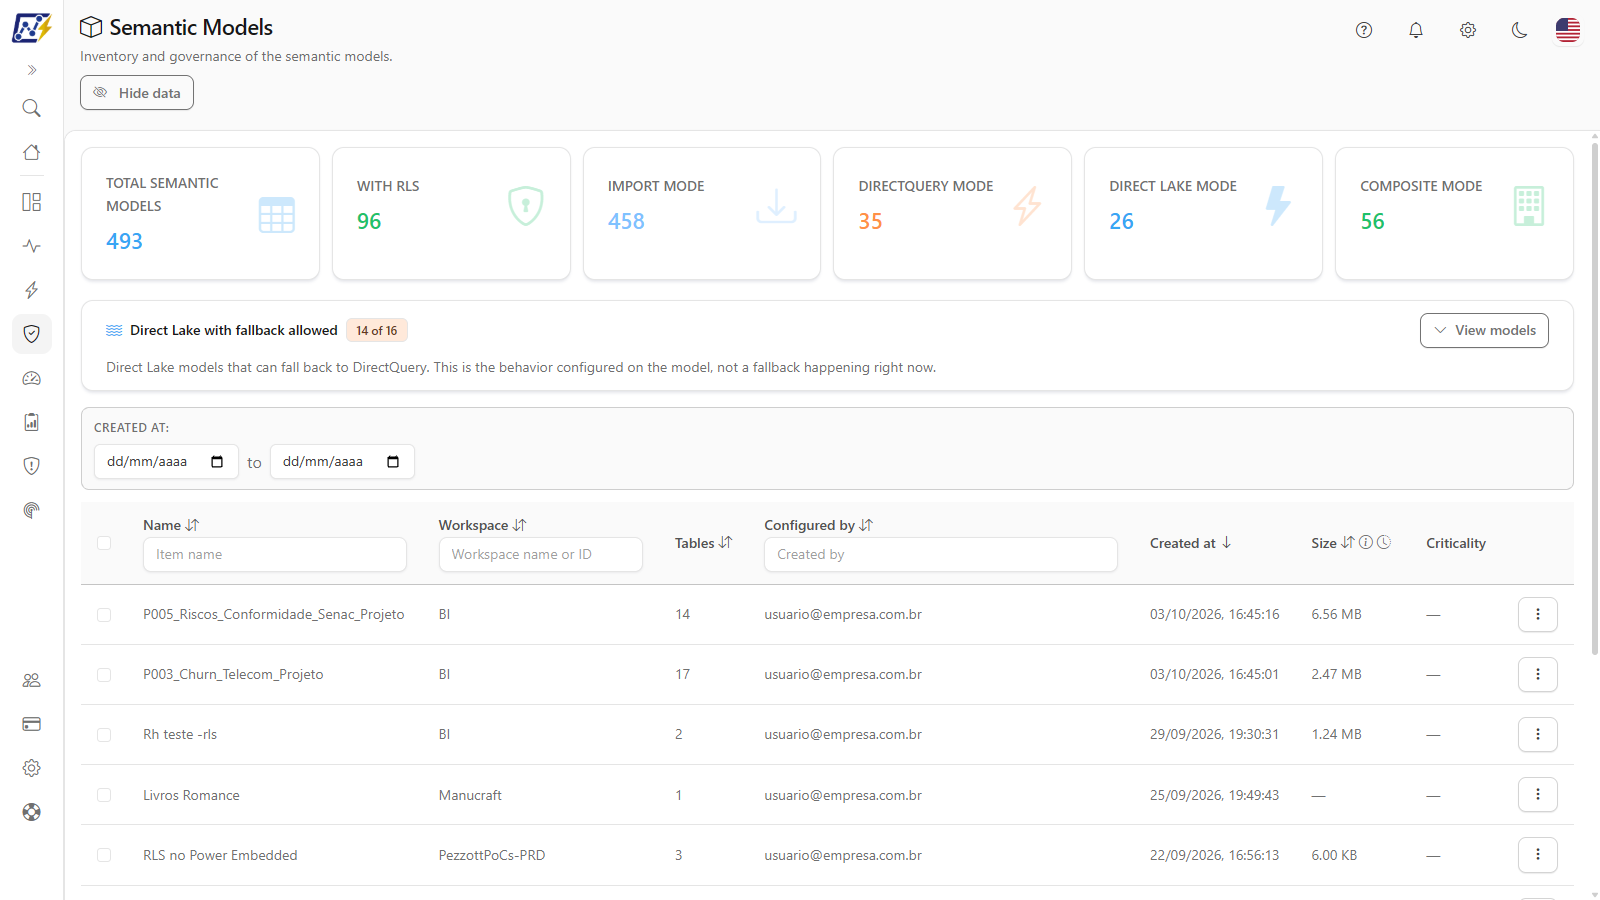
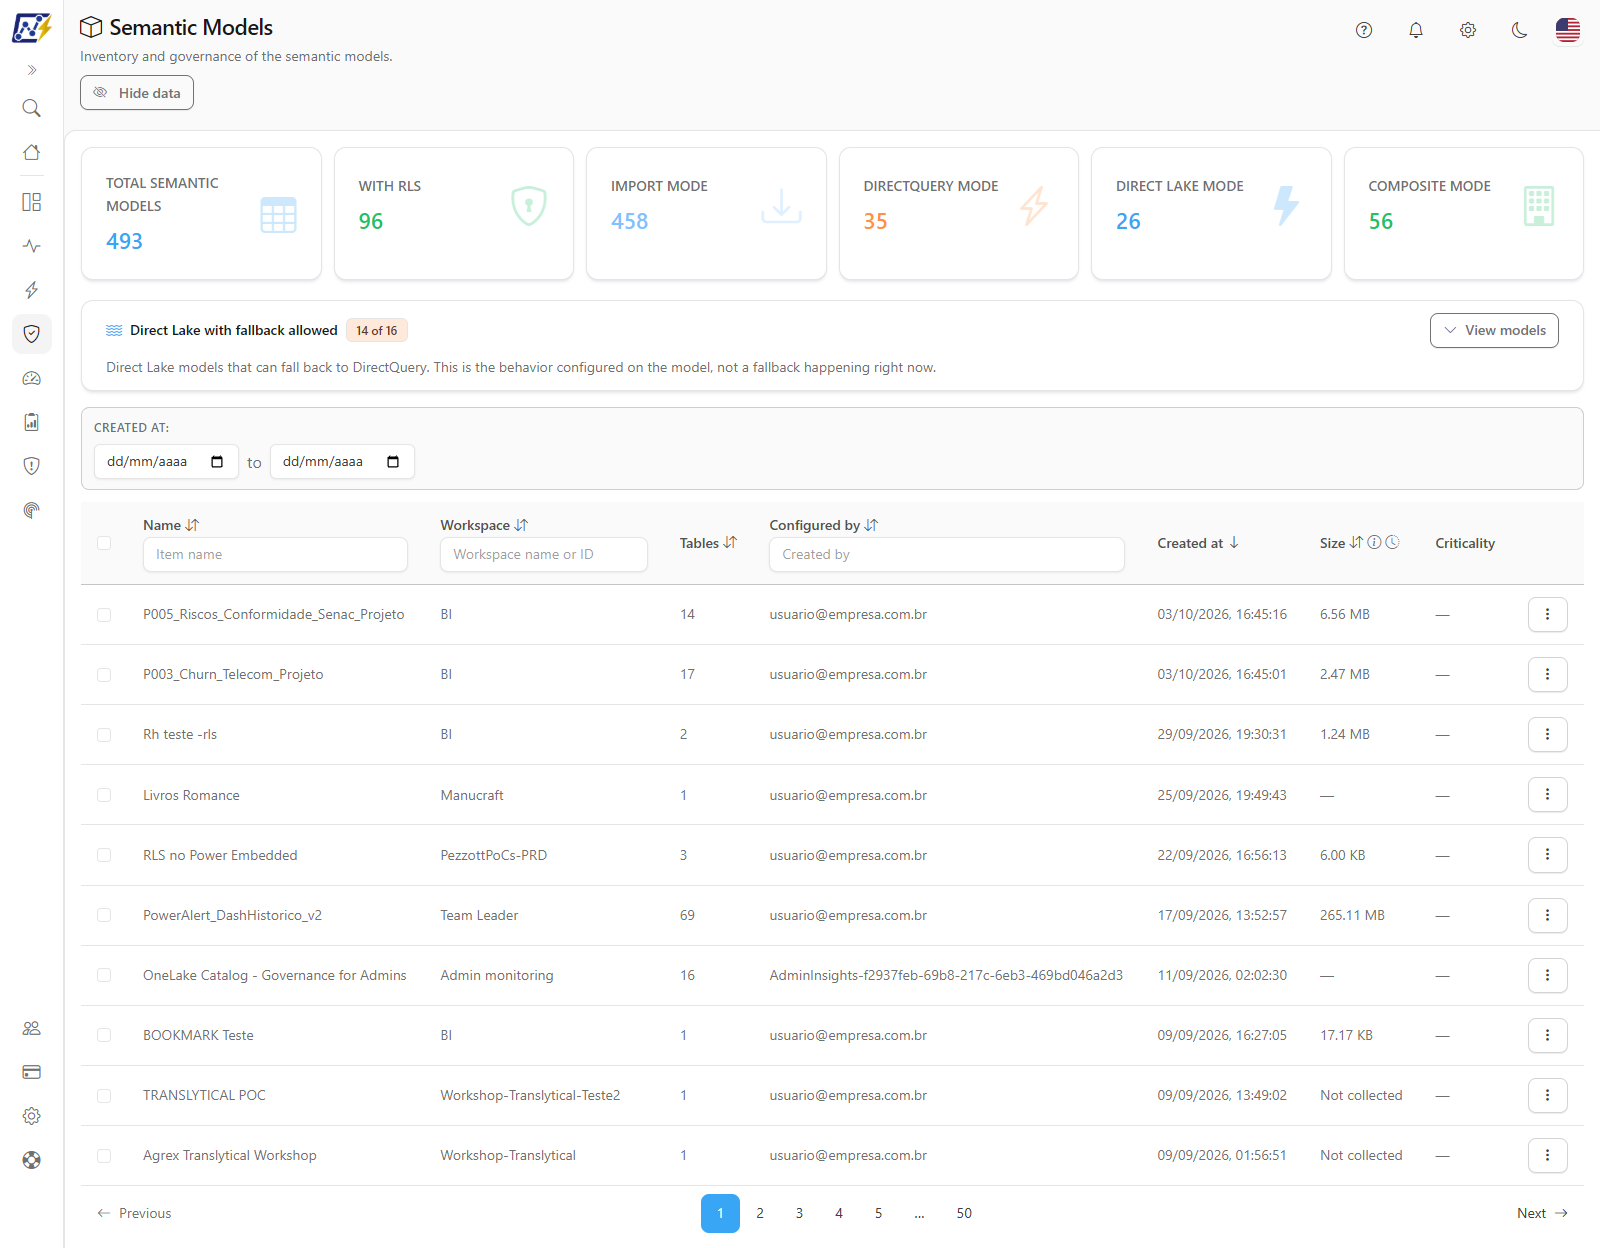
The **Semantic Models** screen is the inventory of the semantic models (formerly *datasets*) of the monitored workspaces. It is the most complete Governance screen: in addition to listing the models, it shows the storage mode, row-level security (RLS), in-memory size, complete schema (tables, columns, measures, M expressions), end-to-end lineage, relationship diagram, AI and best practices assessments, schedule, refresh history and the governance metadata (owner, criticality) of each model.

**How to access:** menu *Governance › Semantic Models*. The screen is available to all profiles; editing governance, managing schedules and turning on execution duration deviation monitoring are actions exclusive to the **Administrator**. Users with visibility restricted to some workspaces see only the models of those workspaces.

<figure><picture><source srcset="/files/Wq93t1P1yhUzFE0ueeoB" media="(prefers-color-scheme: dark)"><img src="https://3938213054-files.gitbook.io/~/files/v0/b/gitbook-x-prod.appspot.com/o/spaces%2FH2bFRBmIfyK3kwVKbldl%2Fuploads%2Fgit-blob-268f1965127ab4ab1562eafb2ae8e98f2667c0e4%2Fpm-governanca-modelos-semanticos-en.png?alt=media" alt="Semantic Models screen with the storage mode cards and the inventory table"></picture><figcaption><p>Semantic Models inventory</p></figcaption></figure>

## What it is for

* **Map the data architecture:** how many models are Import, DirectQuery, Direct Lake or composite, and which ones use RLS.
* **Find heavy models:** the **Size** column shows the in-memory size (VertiPaq) of each model on dedicated capacity, useful for capacity planning and prioritizing optimizations.
* **Analyze impact before changing something:** the **Lineage** tab shows where the model reads from (gateways, sources, source models) and who depends on it (reports, apps, dependent models).
* **Document and review the model:** tables, columns, DAX measures, Power Query expressions and the relationship diagram, exportable as images.
* **Assess model quality:** the **AI Adherence** and **Best Practices Adherence** tabs give a score from 0 to 100 and list the problems found.
* **Assign responsibility:** record the technical owner, business area contact and criticality of each model, including in bulk.
* **Investigate slow or failed refreshes:** the refresh history shows the duration, variance from the average and error message of each run.

## Screen overview

The screen follows the [common structure of the Governance lists](/en/power-monitor/governanca/relatorios.md#common-structure-of-the-lists) and is organized, from top to bottom, into:

1. **KPI cards** (six cards; five of them work as filters).
2. **Created at** filter and, for Administrators, the bulk selection bar.
3. **Inventory table**, with filters and sorting in the header, paginated with 10 models per page (the **Items per page** selector offers 10, 25, 50 or 100).
4. **Actions menu (⋮)** on each row, which gives access to the **details modal** (nine tabs), the **Refresh History**, governance editing, the Performance Assessment, the history of changes to the model structure and shortcuts to Power BI.

The list has no CSV/Excel export. Below the page title is the **Hide data** button, which masks the names and identifiers of people (see [Rules and permissions](#rules-and-permissions)).

## Features

All flows below start from the *Governance › Semantic Models* menu.

### KPI cards and card filter

**What it is:** six cards at the top of the screen that summarize the inventory: **Total Semantic Models**, **With RLS**, **Import Mode**, **DirectQuery Mode**, **Direct Lake Mode** and **Composite Mode**. The last five are clickable and filter the table.

**What it is for:** answering questions such as "which models have RLS?" or "how many models are already on Direct Lake?" with one click, and immediately seeing the list of those models.

<figure><picture><source srcset="/files/PLETAbBdapM6CUqTWjZv" media="(prefers-color-scheme: dark)"><img src="https://3938213054-files.gitbook.io/~/files/v0/b/gitbook-x-prod.appspot.com/o/spaces%2FH2bFRBmIfyK3kwVKbldl%2Fuploads%2Fgit-blob-4c5c4cd3d3a774678592f213ea83b76658655f3b%2Fpm-governanca-modelos-semanticos-cards-filtro-en.png?alt=media" alt="Semantic Models KPI cards with the With RLS card active as a filter"></picture><figcaption><p>KPI cards with the With RLS filter active</p></figcaption></figure>

| Card                      | What it counts                                                                               | Clickable |
| ------------------------- | -------------------------------------------------------------------------------------------- | --------- |
| **Total Semantic Models** | Total models in the list, considering the applied filters.                                   | No        |
| **With RLS**              | Models that require an effective identity, that is, that have row-level security configured. | Yes       |
| **Import Mode**           | Models whose storage mode reported by Power BI is *Import* or *Import (ABF)*.                | Yes       |
| **DirectQuery Mode**      | Models whose storage mode reported by Power BI is *DirectQuery* or *Premium Files*.          | Yes       |
| **Direct Lake Mode**      | Models that have at least one table in Direct Lake mode.                                     | Yes       |
| **Composite Mode**        | Composite models (combining storage modes).                                                  | Yes       |

**How to use:**

1. Click one of the **With RLS**, **Import Mode**, **DirectQuery Mode**, **Direct Lake Mode** or **Composite Mode** cards (or select it with the keyboard and press Enter/Space). The card is highlighted, the icon turns into a funnel and the table shows only the models it counts.
2. To combine, also click **With RLS** together with a mode card. The four mode cards are mutually exclusive: clicking another one switches the filter.
3. Click the active card again to remove the filter.

**How it works:**

* The counters are calculated over the **entire** filtered list (including the header and date filters), not just the current page.
* The click applies exactly the same condition used in the count, the number on the card and the number of filtered rows always match.
* **RLS:** the *With RLS* card indicates that the model requires an effective identity, that is, that there are security roles defined. It does not validate whether the DAX rules are correct.

{% hint style="warning" %}
**How to read the Import and DirectQuery cards.** For each model, Power BI reports the *storage format*, `ABF` for the small format and `Premium Files` for the large semantic model format. The **Import Mode** card counts models in the small format and the **DirectQuery Mode** card counts those in the **large format (Premium Files)**, which includes Import models with the large storage format enabled. To confirm the mode of each table, check the **Tables & Schema** tab of the details modal.

**Direct Lake** is identified by the model's tables, which are filled in by the model mapping scan. A newly discovered Direct Lake model may appear outside this card until the next mapping.
{% endhint %}

### Direct Lake with fallback allowed card
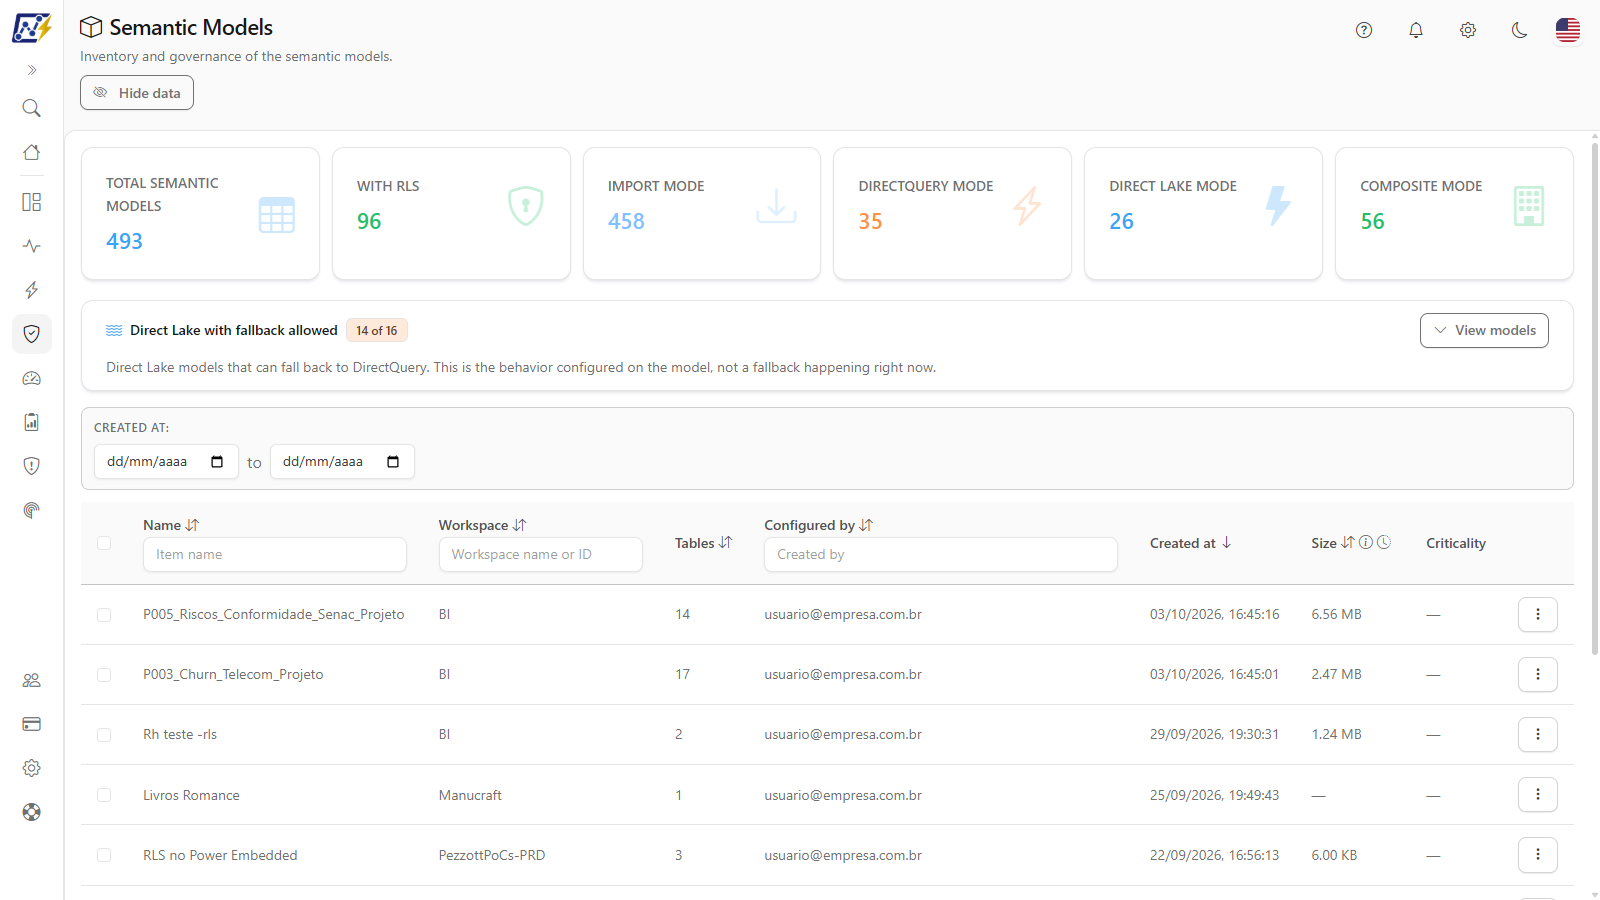
**What it is:** a compact card, right below the indicator cards, called **Direct Lake with fallback allowed** (with the *N of M* Direct Lake models counter). It is closed by default: click **View models** to open the list and **Hide** to collapse it (the button only appears when there is at least one model with fallback allowed). If the tenant has no Direct Lake model, the card does not appear.

**What it is for:** finding the Direct Lake models that **may fall back to DirectQuery** (automatic fallback), which usually makes queries slower and more expensive. The list brings **Model**, **Workspace** and **Direct Lake tables** (*N of M*, the Direct Lake tables out of the model's total), sorted with the models with the most Direct Lake tables first and then by name. It shows 10 models at a time, with a **Show more (N)** button when the list is long.

<figure><picture><source srcset="/files/GQdkG8CU3aubj19mmj8J" media="(prefers-color-scheme: dark)"><img src="https://3938213054-files.gitbook.io/~/files/v0/b/gitbook-x-prod.appspot.com/o/spaces%2FH2bFRBmIfyK3kwVKbldl%2Fuploads%2Fgit-blob-1e0a08e5475bcee55b96b545155582d032118772%2Fpm-governanca-modelos-semanticos-direct-lake-en.png?alt=media" alt="Direct Lake with fallback allowed card open, with the list of models, workspaces and Direct Lake tables"></picture><figcaption><p>Direct Lake with fallback allowed card</p></figcaption></figure>

**How it works:**

* The card looks at the whole tenant and **does not follow** the table's filters, sorting or **Created at** filter.
* The card shows the **behavior configured** on the model, not a fallback happening right now: Power BI does not report whether a query is falling back to DirectQuery at this moment.
* Models whose behavior has not been captured yet appear in the note *N model(s) with unknown behavior. It shows up after the next read of the model definition.* The definition is only read on models where the Service Principal has write permission.
* If no Direct Lake model allows fallback, the card reports *No Direct Lake model allows fallback to DirectQuery.*

### Creation period filter

**What it is:** the **Created at** filter, above the table, with a start date and an end date.

**What it is for:** finding recently published models (for example, to review what went into production in the last month) or old models that are candidates for retirement.

<figure><picture><source srcset="/files/Y6hxKxBoFI52yewatkGv" media="(prefers-color-scheme: dark)"><img src="https://3938213054-files.gitbook.io/~/files/v0/b/gitbook-x-prod.appspot.com/o/spaces%2FH2bFRBmIfyK3kwVKbldl%2Fuploads%2Fgit-blob-810483791275f8b282b66eb5007052e9b4cb2e7c%2Fpm-governanca-modelos-semanticos-filtros-tabela-en.png?alt=media" alt="Created at filter and table header with the Item name, Workspace name or ID and Created by filter boxes"></picture><figcaption><p>Period filter and table header filters</p></figcaption></figure>

**How to use:**

1. In the **Created at** filter, fill in the start date and/or the end date.
2. The table and the cards are recalculated automatically.
3. To remove the filter, clear the dates.

**How it works:** when you fill in the start date, the list is sorted by creation date from oldest to newest; without a start date, it goes back to sorting from newest to oldest.

### Table filters and sorting

**What it is:** search boxes below the titles of the **Name**, **Workspace** and **Configured by** columns, and sorting by clicking the column titles.

**What it is for:** quickly locating a model by name, all models of a workspace or all models configured by a given account; sorting to find the largest or the most recent models.

**How to use:**

{% stepper %}
{% step %}

#### Filter by the header

Type the term in the box below the title of the **Name** (*Item name*), **Workspace** (*Workspace name or ID*) or **Configured by** (*Created by*) column. The table is filtered automatically as you type.
{% endstep %}

{% step %}

#### Sort

Click the column title (for example, **Size**). The first click sorts in descending order (largest models first); click again to reverse it. The arrow next to the title indicates the sorted column and direction.
{% endstep %}

{% step %}

#### Navigate through the pages

Use the pagination below the table. Any change of filter or sorting returns to the first page.
{% endstep %}
{% endstepper %}

**How it works:**

* In the workspace filter, pasting the complete ID (GUID) searches for the exact workspace by ID; any other text searches by name.
* All columns except **Criticality** are sortable; **Size** sorts by the actual number of bytes.
* The header filters combine with the date filter and with the cards.

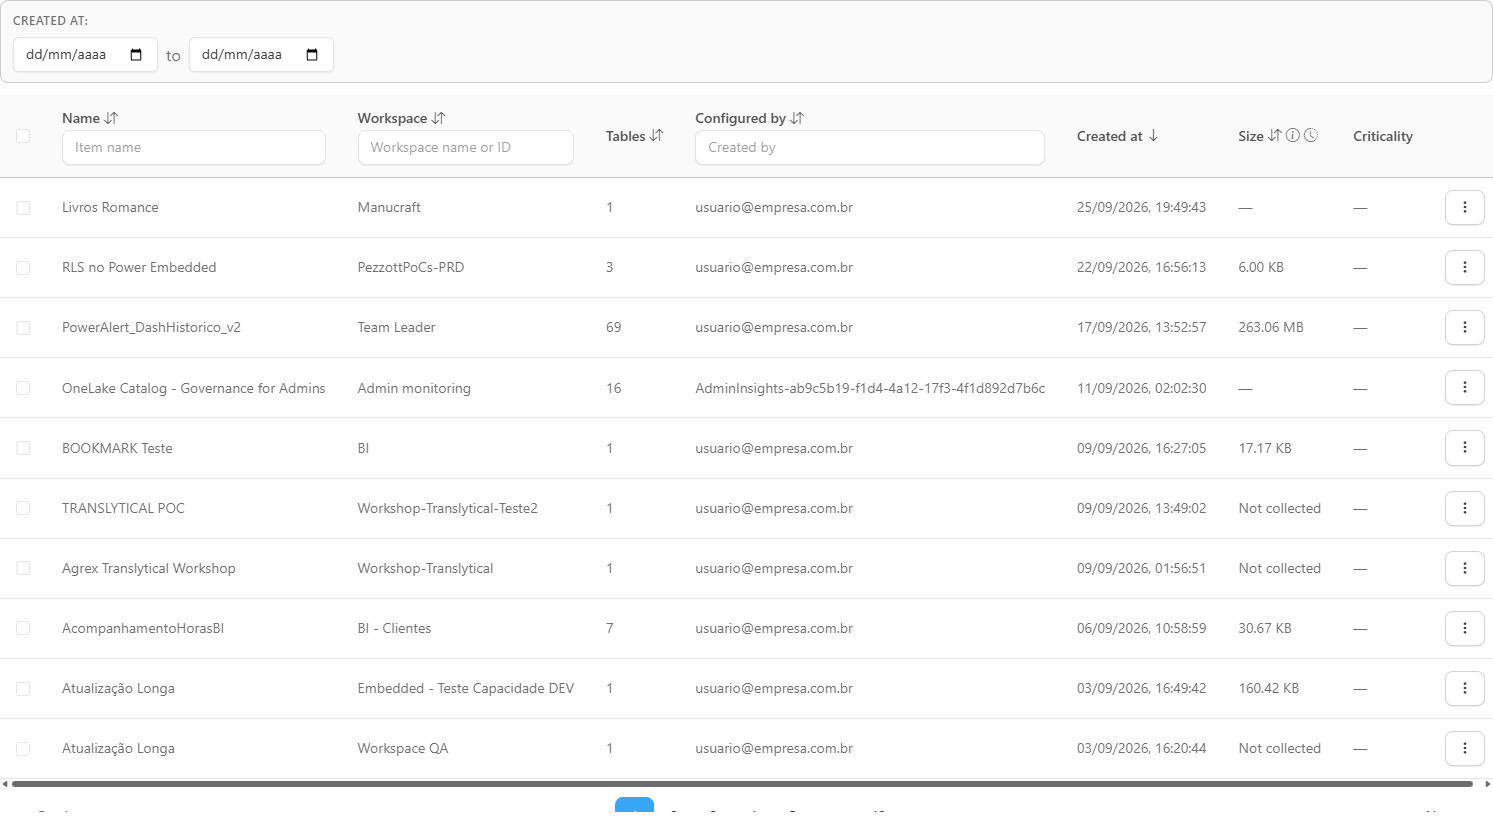
### Inventory table

**What it is:** the list of semantic models, with 10 models per page by default. The **Items per page** selector (10, 25, 50 or 100) is in the pagination; changing it returns the list to the first page, keeping the filters.

**What it is for:** having a consolidated view of each model, where it is published, how many tables it has, who configured it, when it was created, its size and criticality.

| Column            | Description                                                                                                                     |
| ----------------- | ------------------------------------------------------------------------------------------------------------------------------- |
| *(selection)*     | Checkbox for bulk governance editing. Visible only to Administrators.                                                           |
| **Name**          | Name of the semantic model.                                                                                                     |
| **Workspace**     | Workspace where the model is published.                                                                                         |
| **Tables**        | Number of tables in the model.                                                                                                  |
| **Configured by** | Account that owns the model's configuration in Power BI.                                                                        |
| **Created at**    | Creation date and time.                                                                                                         |
| **Size**          | In-memory size of the model (VertiPaq). See [Size column](#size-column).                                                        |
| **Criticality**   | Badge with the criticality level assigned in governance: **Low**, **Medium**, **High** or **Critical** ("-" when unclassified). |

**How to use:**

1. Click anywhere on the row (or select it and press Enter) to open the [details modal](#details-modal-and-general-information-tab).
2. Right-click the row, or click the **⋮** button at its end, to open the [actions menu](#actions-menu).

**How it works:**

* Only models from **monitored workspaces** appear, and models detected as deleted in the tenant do not appear (they go to [Deleted Artifacts](/en/power-monitor/governanca/operacao/artefatos-excluidos.md)).
* When no model matches the filters, the table shows "No datasets registered".
* The inventory is updated by the inventory scans; tables, columns and measures depend on the model mapping scan. See [Inventory Scan](/en/power-monitor/mapeamento/inventarios.md) and [Model Mapping Scan](/en/power-monitor/mapeamento/mapeamento-de-modelos.md).

### Size column

**What it is:** the in-memory size of the model (VertiPaq), measured directly on the model.

**What it is for:** identifying the heaviest models on the capacity, tracking growth and prioritizing optimizations (removing columns, reducing cardinality, incremental refresh).

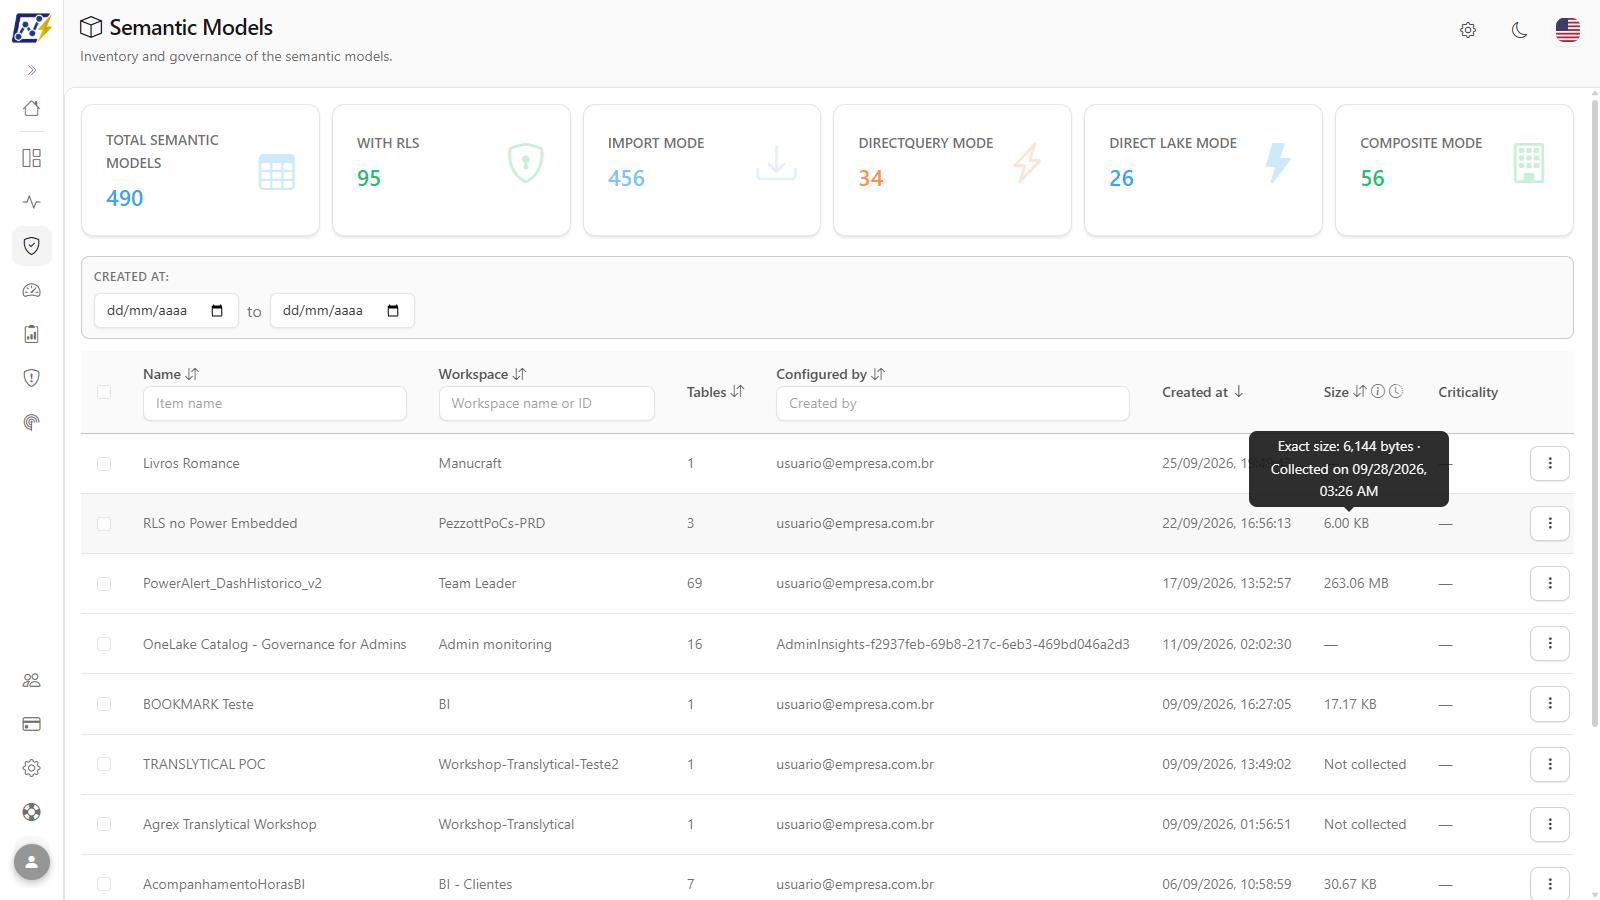
<figure><picture><source srcset="/files/VPvm6EK6nyPqgcgIiVi5" media="(prefers-color-scheme: dark)"><img src="https://3938213054-files.gitbook.io/~/files/v0/b/gitbook-x-prod.appspot.com/o/spaces%2FH2bFRBmIfyK3kwVKbldl%2Fuploads%2Fgit-blob-905247e8122578589cba3893c74b2bd83b2fd503%2Fpm-governanca-modelos-semanticos-coluna-tamanho-en.png?alt=media" alt="Size column tooltip with the exact size in bytes and the collection date"></picture><figcaption><p>Size column tooltip</p></figcaption></figure>

**How to use:**

1. Click the **Size** title to sort from the largest to the smallest model.
2. Hover over the value to see the exact size in bytes and the collection date (or the reason why there is no collection).
3. Hover over the information icon next to the title to see on which capacities the data exists. Administrators also see a clock icon that leads to the capture history in [Mapping › Model Size](/en/power-monitor/mapeamento/tamanho-de-modelos.md).

**How it works:**

* The size is measured **on the model itself, via the XMLA endpoint**, by a daily routine (at 22:16, Brasília time, UTC-3; in *Settings › Monitoring* the frequency can be changed to weekly or monthly, see [Run frequency](/en/power-monitor/configuracoes/monitoramento.md#run-frequency)). The Administrator can also trigger a manual capture in [Mapping › Model Size](/en/power-monitor/mapeamento/tamanho-de-modelos.md).
* **Prerequisites:** the workspace must be **monitored** and on **dedicated capacity** (Fabric, Power BI Embedded, Premium or PPU), and the Power Monitor Service Principal must be a **member of the workspace**, XMLA access is not covered by the Admin API permissions.
* Possible values: **-** (workspace without dedicated capacity: the data does not apply), **Not collected** (waiting for the first collection or the last attempt failed, the reason appears on hover) or the formatted size. If a collection fails after a successful collection, the last good value is kept and the tooltip warns that it may be outdated.

### Actions menu

**What it is:** the menu opened by the **⋮** button of each row (or by right-clicking the row), with all the actions available for the model.

**What it is for:** going directly to the desired information or action, for example, opening the modal directly on the **Lineage** tab, without going through the initial tab.

<figure><picture><source srcset="/files/GQdkG8CU3aubj19mmj8J" media="(prefers-color-scheme: dark)"><img src="https://3938213054-files.gitbook.io/~/files/v0/b/gitbook-x-prod.appspot.com/o/spaces%2FH2bFRBmIfyK3kwVKbldl%2Fuploads%2Fgit-blob-d93f723e007bf3a55014d6f772841fecc3b51157%2Fpm-governanca-modelos-semanticos-menu-acoes-en.png?alt=media" alt="Actions menu of a semantic model with the Open details submenu open"></picture><figcaption><p>Actions menu of a semantic model</p></figcaption></figure>

| Action                          | What it does                                                                                                                                                                                                                                                                                                | Who sees it   |
| ------------------------------- | ----------------------------------------------------------------------------------------------------------------------------------------------------------------------------------------------------------------------------------------------------------------------------------------------------------- | ------------- |
| **Open details**                | Opens the details modal on the *General Information* tab. On hover, it opens a submenu with *General Information*, *Tables & Schema*, *Parameters*, *Permissions*, *Lineage*, *Model diagram*, *AI Adherence*, *Best Practices Adherence* and *Schedules*, which open the modal directly on the chosen tab. | Everyone      |
| **Edit governance**             | Opens the governance modal already filled in with the model's current values.                                                                                                                                                                                                                               | Administrator |
| **Assess performance** *(beta)* | Takes you to the [Performance Assessment](/en/power-monitor/performance/avaliacao-de-performance.md) screen with the model already selected.                                                                                                                                                                | Everyone      |
| **View change history**         | Opens the model's version history, with version comparison. See [Model History](/en/power-monitor/governanca/operacao/historico-de-modelos.md).                                                                                                                                                             | Everyone      |
| **Open in Power BI**            | Opens the semantic model page in Power BI.                                                                                                                                                                                                                                                                  | Everyone      |
| **Settings in Power BI**        | Opens the model's settings page in Power BI (credentials, gateway, scheduled refresh).                                                                                                                                                                                                                      | Everyone      |
| **Refresh History**             | Opens the modal with the model's latest refreshes.                                                                                                                                                                                                                                                          | Everyone      |

**How to use:**

1. Click the row's **⋮** button or right-click anywhere on the row. The menu opens next to the button (or at the click point).
2. Click the desired action. To open the modal on a specific tab, hover over **Open details** and choose the tab in the submenu.
3. To close the menu without choosing anything, press Esc or click outside it.

### Details modal and General Information tab

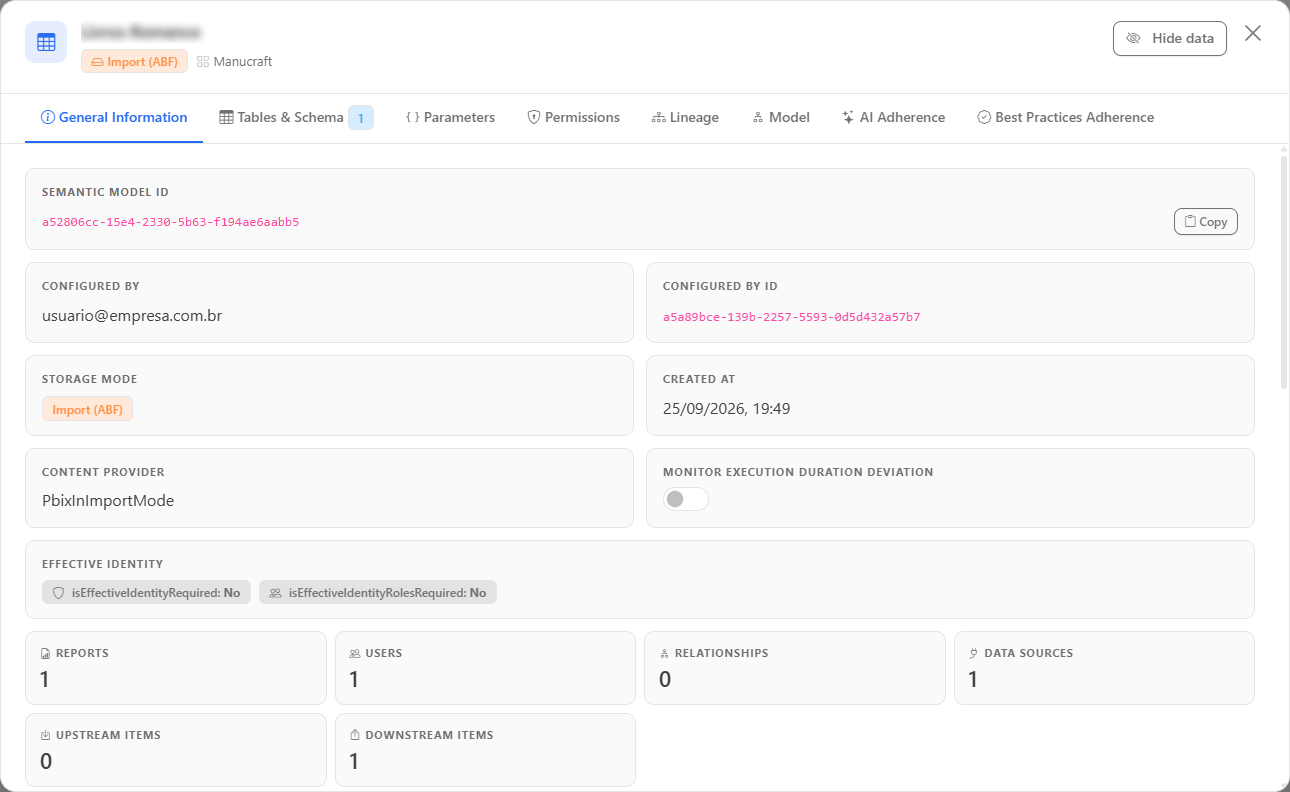
**What it is:** the modal opened when you click the row. The header shows the model name, a badge with the storage mode (**Import (ABF)**, **Premium Files**, **Import**, **DirectQuery**, **Composite** or *Not defined*) and the workspace. The first tab, **General Information**, brings together the model's record and technical data.

**What it is for:** quickly checking the model ID (for support tickets, scripts or APIs), who configured it, whether it requires an effective identity and what refresh schedule is configured in Power BI.

<figure><picture><source srcset="/files/VBjThCUm9e1qezvV3dcR" media="(prefers-color-scheme: dark)"><img src="https://3938213054-files.gitbook.io/~/files/v0/b/gitbook-x-prod.appspot.com/o/spaces%2FH2bFRBmIfyK3kwVKbldl%2Fuploads%2Fgit-blob-f3a12637ce10ee60975e100ff0e2dfef0c57300a%2Fpm-governanca-modelos-semanticos-modal-informacoes-en.png?alt=media" alt="General Information tab of the semantic model modal with VertiPaq technical details"></picture><figcaption><p>General Information tab</p></figcaption></figure>

**How to use:**

1. Click the model row, or the **⋮** button › **Open details**. The modal opens on the **General Information** tab.
2. Click **Copy** next to the **Semantic model ID** to copy the model identifier (the button shows the copy confirmation).
3. Switch tabs using the modal's tab bar (on narrow screens, the tabs become a drop-down list). The **Tables & Schema** tab shows the number of tables next to its name.
4. Close the modal with the **×**, with Esc or by clicking outside it.

**How it works:** the tab shows **Semantic model ID**, **Configured by**, **Configured by ID**, **Storage mode**, **Created at**, **Content provider** and **Effective identity** (whether the model requires an effective identity and whether it requires roles), in addition to the [Monitor execution duration deviation](#monitor-execution-duration-deviation) switch, the [Technical Details (VertiPaq)](#technical-details-vertipaq) block and the **Refresh Schedule** block (status, days, times and time zone configured in Power BI; "No schedule configured for this model" when there is none). The modal header has the **Hide data** button, which masks **Configured by** and **Configured by ID**.

### Technical Details (VertiPaq)

**What it is:** a block on the **General Information** tab with the technical metrics collected on the model itself: **Total Size**, **Total Rows**, **Compatibility Level**, **Partitions**, **Incremental Refresh** and **RLS Roles**, with the collection date.

**What it is for:** understanding the size and configuration of the model without opening external tools, for example, confirming whether incremental refresh is configured or how many RLS roles exist.

<figure><picture><source srcset="/files/zpYNTwDer2OfEy6ZIx8i" media="(prefers-color-scheme: dark)"><img src="https://3938213054-files.gitbook.io/~/files/v0/b/gitbook-x-prod.appspot.com/o/spaces%2FH2bFRBmIfyK3kwVKbldl%2Fuploads%2Fgit-blob-aff93eefc37ebc86eb86d3e438ae77f5dbb86553%2Fpm-governanca-modelos-semanticos-detalhes-tecnicos-en.png?alt=media" alt="Technical Details (VertiPaq) block with total size, rows, compatibility level, partitions, incremental refresh and RLS roles"></picture><figcaption><p>Technical Details (VertiPaq)</p></figcaption></figure>

**How to use:**

1. Open the model modal (**General Information** tab).
2. Check the **Technical Details (VertiPaq)** block. The collection date appears in the upper-right corner of the block.

**How it works:** the data comes from the same daily capture as the [Size column](#size-column) and has the same prerequisites. For workspaces without dedicated capacity, the block states that the data is only available for dedicated capacity; before the first collection, it shows "Not collected yet."; if the most recent collection failed, the last values are kept with a warning that they may be outdated.

### Monitor execution duration deviation

**What it is:** a switch on the **General Information** tab that includes the model in the monitoring of deviation from the average refresh time.

**What it is for:** being alerted when a refresh takes much longer (or much less time) than normal, a common symptom of growing volume, a slow source or a partial failure.

{% hint style="info" %}
Requires the **Administrator** profile. For other profiles, the switch appears disabled with the tooltip "This action is restricted to organization administrators.".
{% endhint %}

**How to use:**

1. Click the model row to open the modal on the **General Information** tab.
2. Turn on the **Monitor execution duration deviation** switch. The change is saved immediately (a loading indicator appears next to the switch).
3. To turn it off, clear the same switch. If the model's workspace is marked for monitoring, the model remains monitored through the workspace.

**How it works:** Power Monitor compares the duration of each refresh with the model's historical average and alerts when it deviates from the pattern (see [Average Execution Time](/en/power-monitor/performance/tempo-medio-de-execucao.md)). The model is monitored when **it** or **its workspace** is marked (the workspace setting is in the workspace details modal, in [Workspaces](/en/power-monitor/governanca/workspaces.md)). If saving fails, the switch returns to its previous position and the message "Failed to update the execution duration deviation monitoring." appears. Monitored models appear in [Average Execution Time](/en/power-monitor/performance/tempo-medio-de-execucao.md).

### Tables & Schema tab

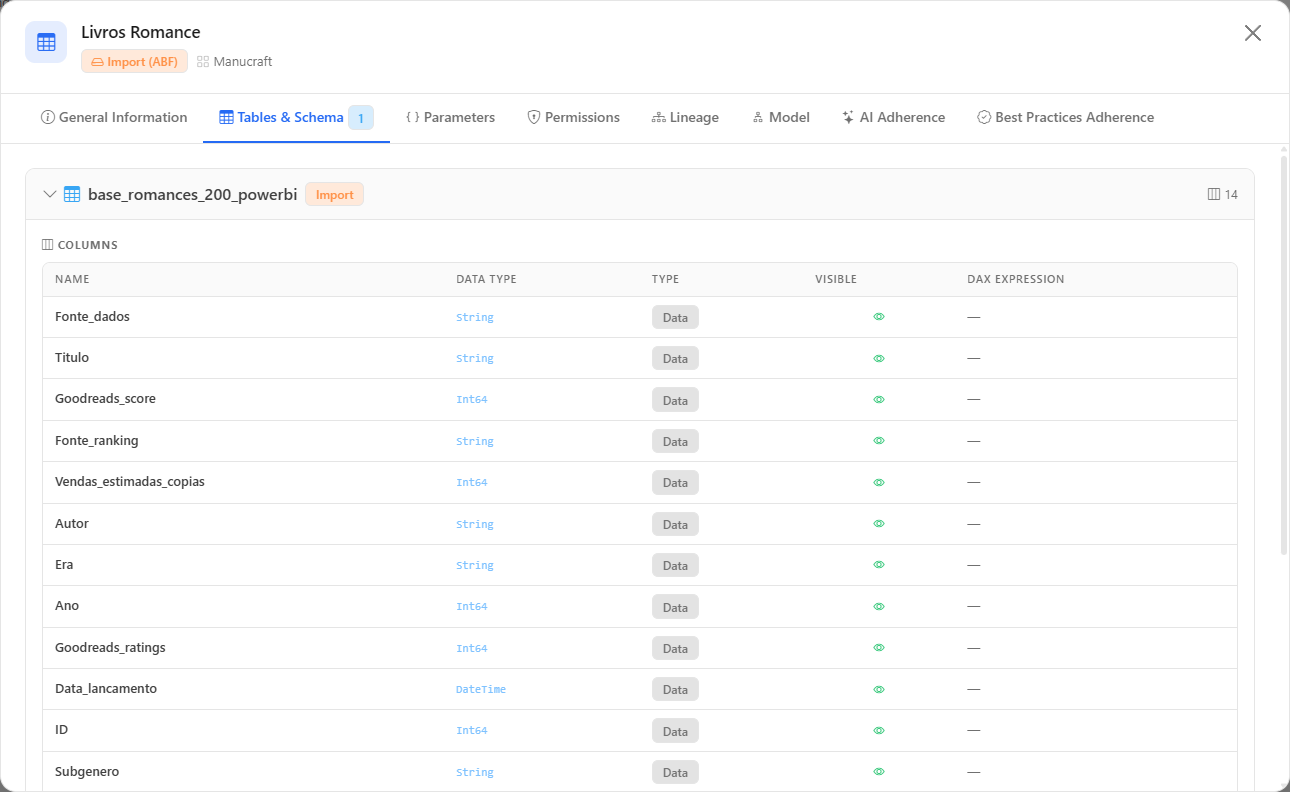
**What it is:** the complete schema of the model, with a collapsible section per table.

**What it is for:** documenting the model, reviewing a DAX measure or a Power Query expression, or checking the storage mode of each table without opening Power BI Desktop.

<figure><picture><source srcset="/files/ARyLvFh0i35DQVCjBUfv" media="(prefers-color-scheme: dark)"><img src="https://3938213054-files.gitbook.io/~/files/v0/b/gitbook-x-prod.appspot.com/o/spaces%2FH2bFRBmIfyK3kwVKbldl%2Fuploads%2Fgit-blob-bd251817bcca64282e6f8ee99ca46a13c6ccd641%2Fpm-governanca-modelos-semanticos-modal-tabelas-en.png?alt=media" alt="Tables &#x26; Schema tab with an expanded table showing columns, measures and Power Query / M"></picture><figcaption><p>Tables &#x26; Schema tab with an expanded table</p></figcaption></figure>

**How to use:**

{% stepper %}
{% step %}

#### Open the tab

In the model's **⋮** menu, hover over **Open details** and choose **Tables & Schema** (or click the tab with the modal already open).
{% endstep %}

{% step %}

#### Expand the table

Click the table name to expand the section. The section header shows the table's storage mode, the *Hidden* indication and the number of columns and measures.
{% endstep %}

{% step %}

#### View and copy

Inside the section: **Columns** (Name, Data type, type (calculated or data), Visible and DAX expression), **Measures** (DAX expression) and **Power Query / M** (M expressions). Click the copy icon of a measure or M expression to copy it to the clipboard.
{% endstep %}
{% endstepper %}

**How it works:** columns, measures and expressions depend on the scan's *enhanced metadata*. When they are not available, the tab lists only the table names with the warning "Detailed schema not available", run a new inventory scan with enhanced metadata enabled. A table without columns, measures or expressions shows "No details available for this table.".

### Parameters tab

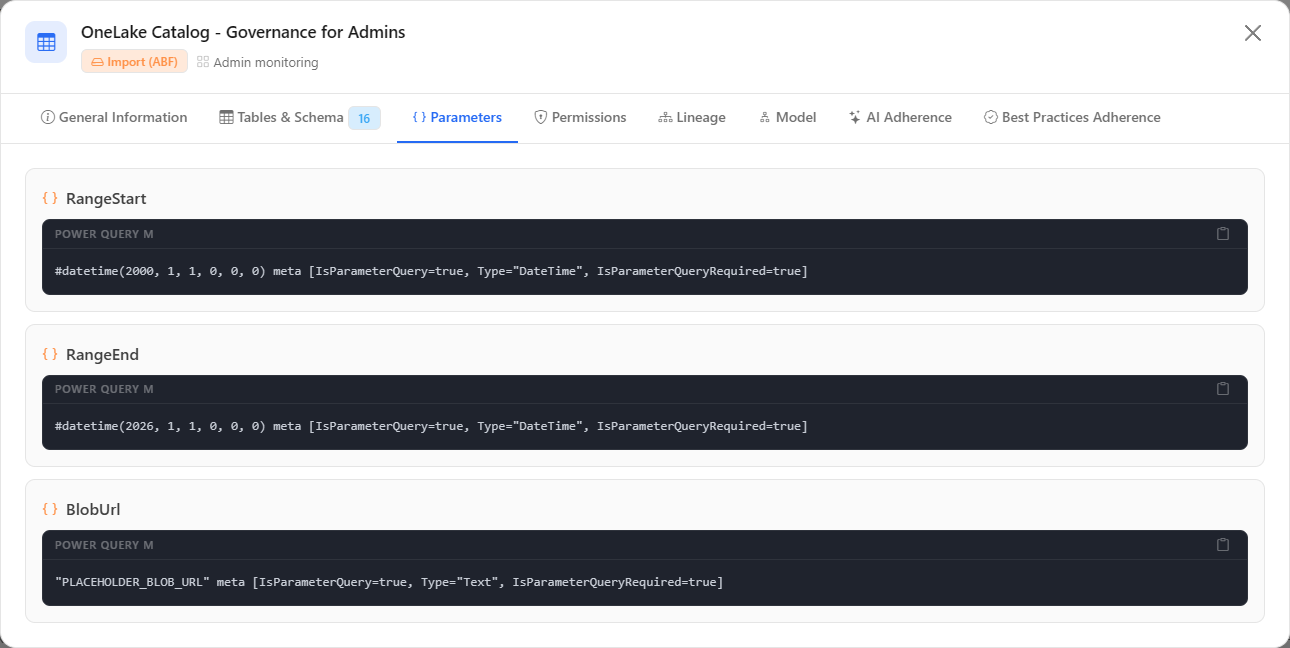
**What it is:** the model's global M expressions (parameters and shared queries).

**What it is for:** checking which server, database or environment the model points to (for example, development server parameters forgotten in production).

<figure><picture><source srcset="/files/f6lBIQJGv0PlbBbrmi7s" media="(prefers-color-scheme: dark)"><img src="https://3938213054-files.gitbook.io/~/files/v0/b/gitbook-x-prod.appspot.com/o/spaces%2FH2bFRBmIfyK3kwVKbldl%2Fuploads%2Fgit-blob-aa3cc9f2f3dda49ede8802ba28eb8ee12abe17cd%2Fpm-governanca-modelos-semanticos-modal-parametros-en.png?alt=media" alt="Parameters tab with the global expressions in Power Query M"></picture><figcaption><p>Parameters tab</p></figcaption></figure>

**How to use:**

1. In the model's **⋮** menu, hover over **Open details** and choose **Parameters**.
2. Each expression appears on a card with the name and the M code; click the copy icon to copy the value.

**How it works:** the content also depends on the scan's *enhanced metadata*. Without expressions, the tab shows "No global expressions available.".

### Permissions tab

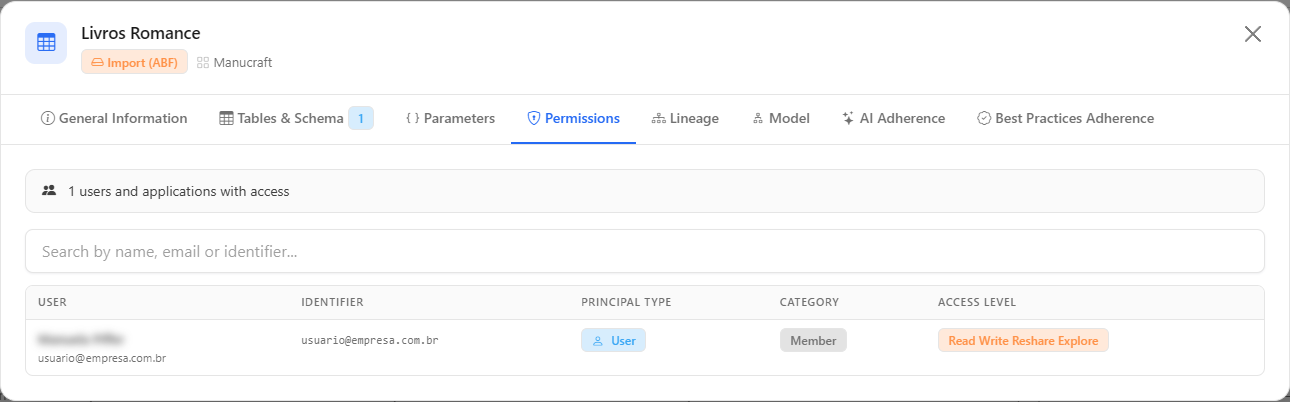
**What it is:** the list of users, groups and applications with direct access to the model.

**What it is for:** auditing who can read, rebuild or reuse the model, and identifying external guests with access.

<figure><picture><source srcset="/files/gPR48BjdM68EykwfiOcq" media="(prefers-color-scheme: dark)"><img src="https://3938213054-files.gitbook.io/~/files/v0/b/gitbook-x-prod.appspot.com/o/spaces%2FH2bFRBmIfyK3kwVKbldl%2Fuploads%2Fgit-blob-87d35f14858ac20486d7104b032dfdce72b98fb5%2Fpm-governanca-modelos-semanticos-modal-permissoes-en.png?alt=media" alt="Permissions tab with the search and the User, Identifier, Principal Type, Category and Access Level columns"></picture><figcaption><p>Permissions tab</p></figcaption></figure>

**How to use:**

1. In the model's **⋮** menu, hover over **Open details** and choose **Permissions**.
2. Use the search (*Search by name, email or identifier...*) to locate a user, group or application.
3. Analyze the **User**, **Identifier**, **Principal Type** (User, Group or Application), **Category** (**Member** or **Guest/External**, the latter highlighted) and **Access Level** columns.

**How it works:** the summary above the table states how many users and applications have access. The permissions come from the inventory scan.

### Lineage tab

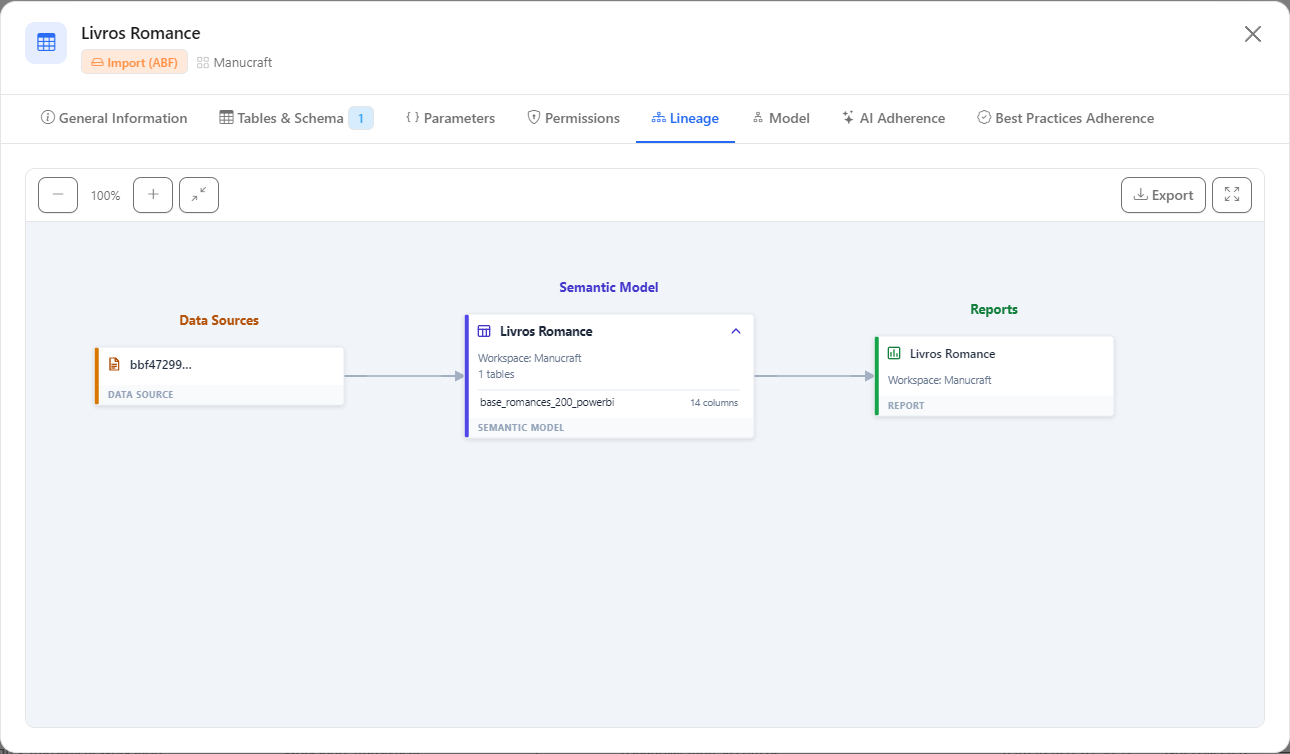
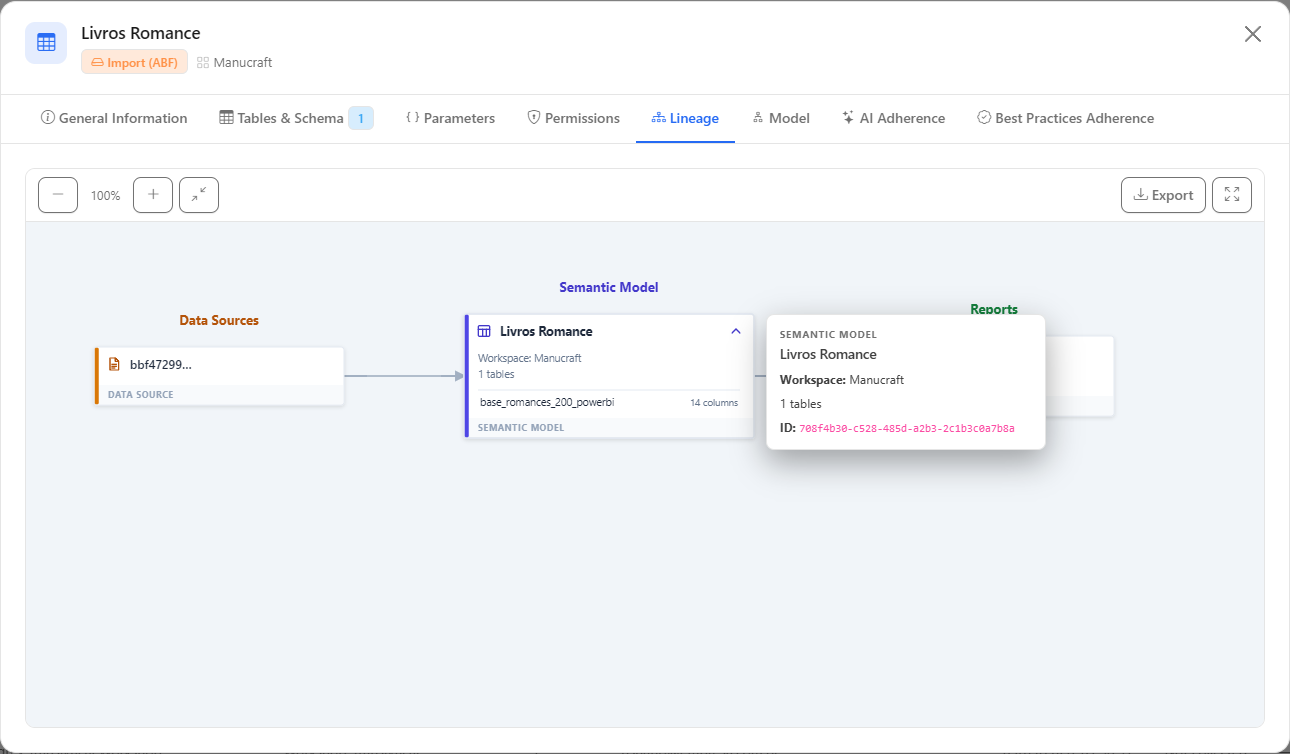
**What it is:** an end-to-end lineage diagram of the model, from the source to consumption.

**What it is for:** assessing the impact of a change (renaming a column, switching a source, deleting the model) and understanding where the model reads its data from.

<figure><picture><source srcset="/files/n9DWBZj4ir6a2yu9i4YI" media="(prefers-color-scheme: dark)"><img src="https://3938213054-files.gitbook.io/~/files/v0/b/gitbook-x-prod.appspot.com/o/spaces%2FH2bFRBmIfyK3kwVKbldl%2Fuploads%2Fgit-blob-01c6c12e8d4e1ae6e427e2c8eef24e1061b98d19%2Fpm-governanca-modelos-semanticos-modal-linhagem-en.png?alt=media" alt="Lineage diagram of the semantic model, with gateways and sources on the left and reports and apps on the right"></picture><figcaption><p>Lineage tab: where the model reads from and who depends on it</p></figcaption></figure>

<figure><picture><source srcset="/files/sTUSDtt0EjxCfp9q5l6H" media="(prefers-color-scheme: dark)"><img src="https://3938213054-files.gitbook.io/~/files/v0/b/gitbook-x-prod.appspot.com/o/spaces%2FH2bFRBmIfyK3kwVKbldl%2Fuploads%2Fgit-blob-7268d864eb573ae0c7b41453fb4d071f4daf2043%2Fpm-governanca-modelos-semanticos-linhagem-tooltip-en.png?alt=media" alt="Tooltip of a lineage node with type, workspace and ID"></picture><figcaption><p>Details of a node on hover</p></figcaption></figure>

**How to use:**

{% stepper %}
{% step %}

#### Open the lineage

In the model's **⋮** menu, hover over **Open details** and choose **Lineage**.
{% endstep %}

{% step %}

#### Read the diagram

The sources are on the left; the model is in the center; the consumers are on the right. Click the model node to expand or collapse the list of tables. Hover over a node to see its details and click it to highlight its connections (click again to undo).
{% endstep %}

{% step %}

#### Navigate

Drag the background to move, use the mouse wheel to zoom or the **Zoom out**, **Zoom in** and **Fit to screen** buttons. The **Fullscreen** button enlarges the diagram (**Exit fullscreen** to go back).
{% endstep %}

{% step %}

#### Export, if needed

See [Export the lineage](#export-the-lineage).
{% endstep %}
{% endstepper %}

**How it works:**

* **Before the model:** **Gateways**, **Data Sources** and **Source models** (when the model is composite and reads from another model).
* **Semantic Model** in the center, with up to 8 visible tables (the others appear as "+*N* more tables...").
* **After the model (reverse lineage):** **Dependent models**, **Reports of dependent models**, **Reports** and **Apps**, that is, everything that would be affected by a change to the model.
* The tooltip of each node shows, depending on the type, workspace, server, database, privacy level, gateway machine, report type, who published it and ID.
* Zoom ranges from 20% to 250%.

{% hint style="info" %}
For the reverse question starting from a Lakehouse or Warehouse ("which models read from this storage?"), use the *Lineage* tab of the [Storage](/en/power-monitor/governanca/armazenamento.md#reverse-lineage) screen.
{% endhint %}

### Export the lineage

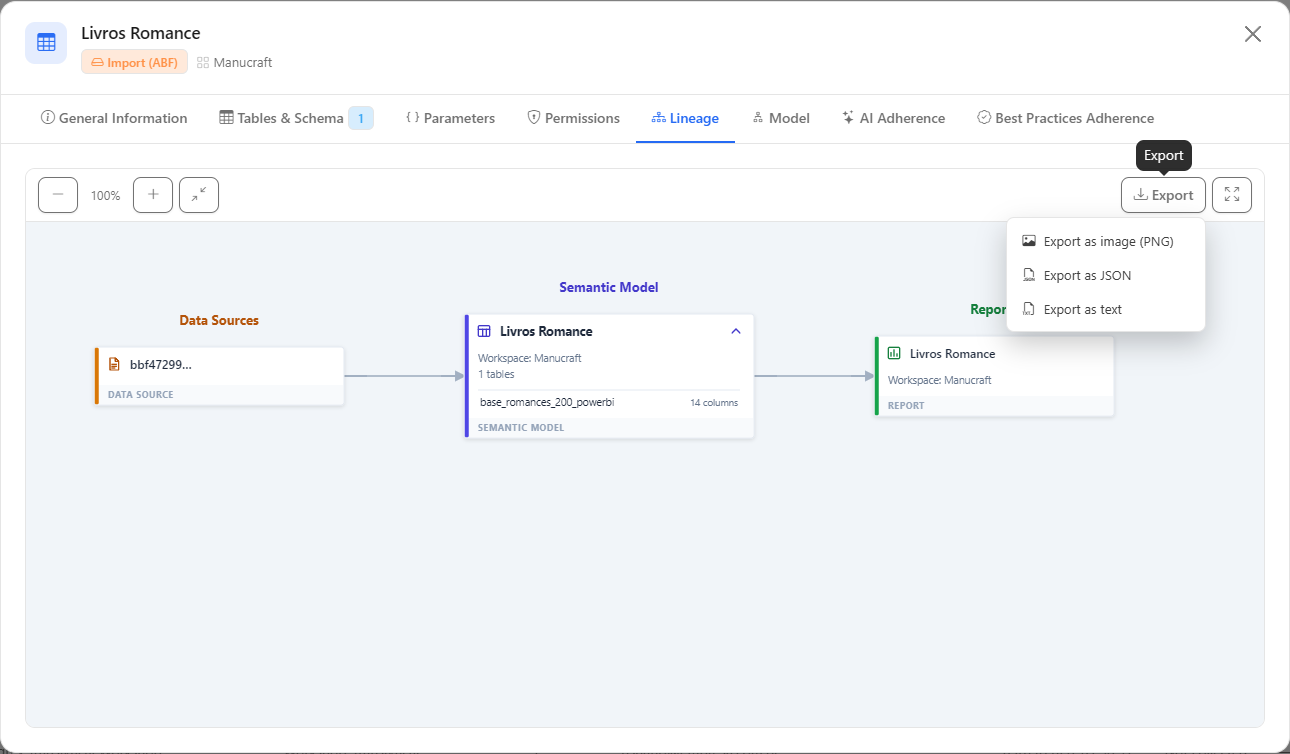
**What it is:** the **Export** button on the **Lineage** tab bar, with three formats: **Export as image (PNG)**, **Export as JSON** and **Export as text**.

**What it is for:** attaching the impact analysis to a change request, documenting the architecture or processing the lineage in another tool.

<figure><picture><source srcset="/files/4HKEN4vBQsey3dpL4Uhl" media="(prefers-color-scheme: dark)"><img src="https://3938213054-files.gitbook.io/~/files/v0/b/gitbook-x-prod.appspot.com/o/spaces%2FH2bFRBmIfyK3kwVKbldl%2Fuploads%2Fgit-blob-7daf2bc2ca189ad8dfefc15308e589262459ee8f%2Fpm-governanca-modelos-semanticos-linhagem-exportar-en.png?alt=media" alt="Lineage Export menu with the PNG, JSON and text options"></picture><figcaption><p>Lineage export options</p></figcaption></figure>

**How to use:**

1. On the **Lineage** tab, click **Export**.
2. Choose **Export as image (PNG)**, **Export as JSON** or **Export as text**. The file is downloaded by the browser.

**How it works:** the PNG is an image of the diagram; the JSON contains the complete structure of the lineage; the text contains a readable listing of the model, tables, sources, gateways, reports and apps. With **Hide data** on, who published each app is masked in the tooltip and in the text file.

### Model tab (model diagram)

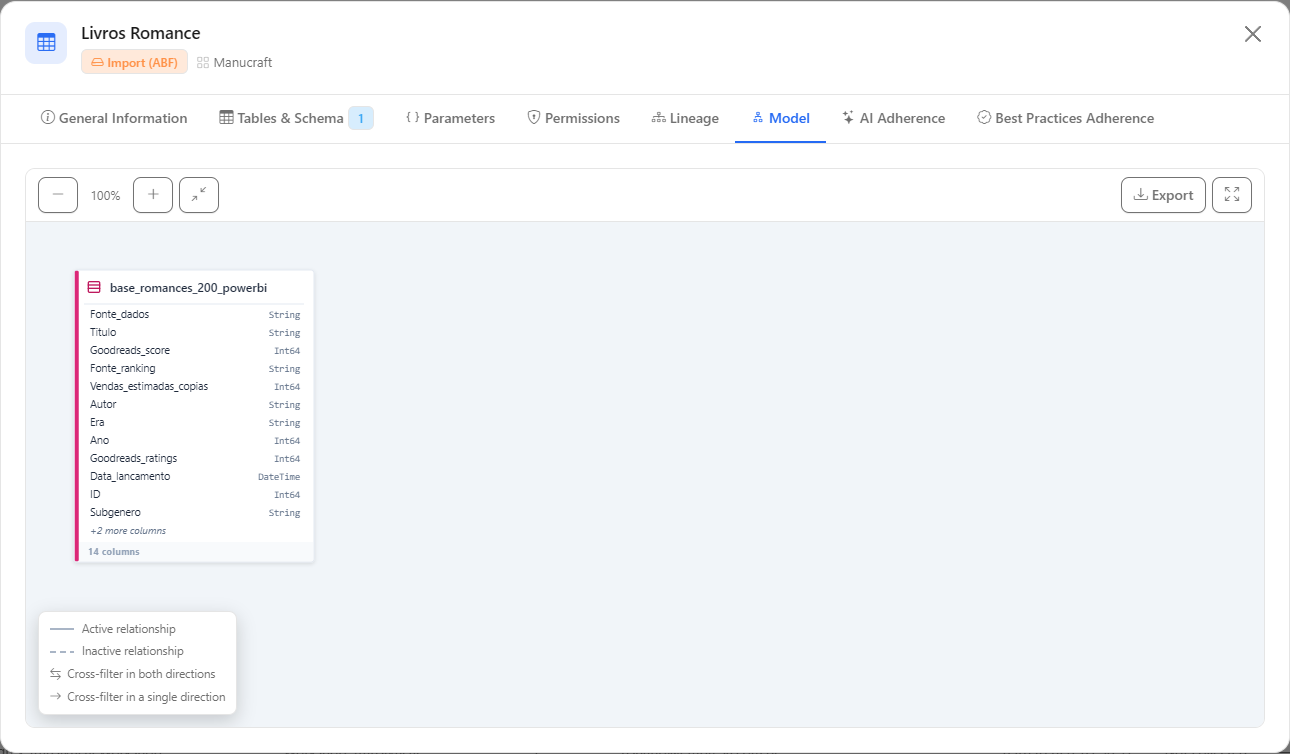
**What it is:** a diagram of the tables and relationships of the semantic model (in the **⋮** submenu, the item is called **Model diagram**).

**What it is for:** reviewing the modeling (star schema, inactive relationships, bidirectional filters) and generating an image for the project documentation.

<figure><picture><source srcset="/files/ZGxapZcv6nDvDO04kVqz" media="(prefers-color-scheme: dark)"><img src="https://3938213054-files.gitbook.io/~/files/v0/b/gitbook-x-prod.appspot.com/o/spaces%2FH2bFRBmIfyK3kwVKbldl%2Fuploads%2Fgit-blob-471e35b04d58e7aed83766f269fe7751c9f91375%2Fpm-governanca-modelos-semanticos-modal-diagrama-en.png?alt=media" alt="Diagram of tables and relationships of the semantic model"></picture><figcaption><p>Model tab: diagram of tables and relationships</p></figcaption></figure>

**How to use:**

1. In the model's **⋮** menu, hover over **Open details** and choose **Model diagram**.
2. Click a table to highlight the tables linked to it.
3. Use the mouse wheel or **Zoom in** / **Zoom out**, drag the background to move and click **Fit to screen** to frame all tables. **Fullscreen** enlarges the diagram.

**How it works:** each table appears as a card with its columns and data types (up to 12 columns per card, with the indication "+*N* more columns"), the **Hidden** mark on hidden tables and the relationship lines. The legend distinguishes **Active relationship** from **Inactive relationship** and **Cross-filter in both directions** from **Cross-filter in a single direction**.

### Export the model diagram

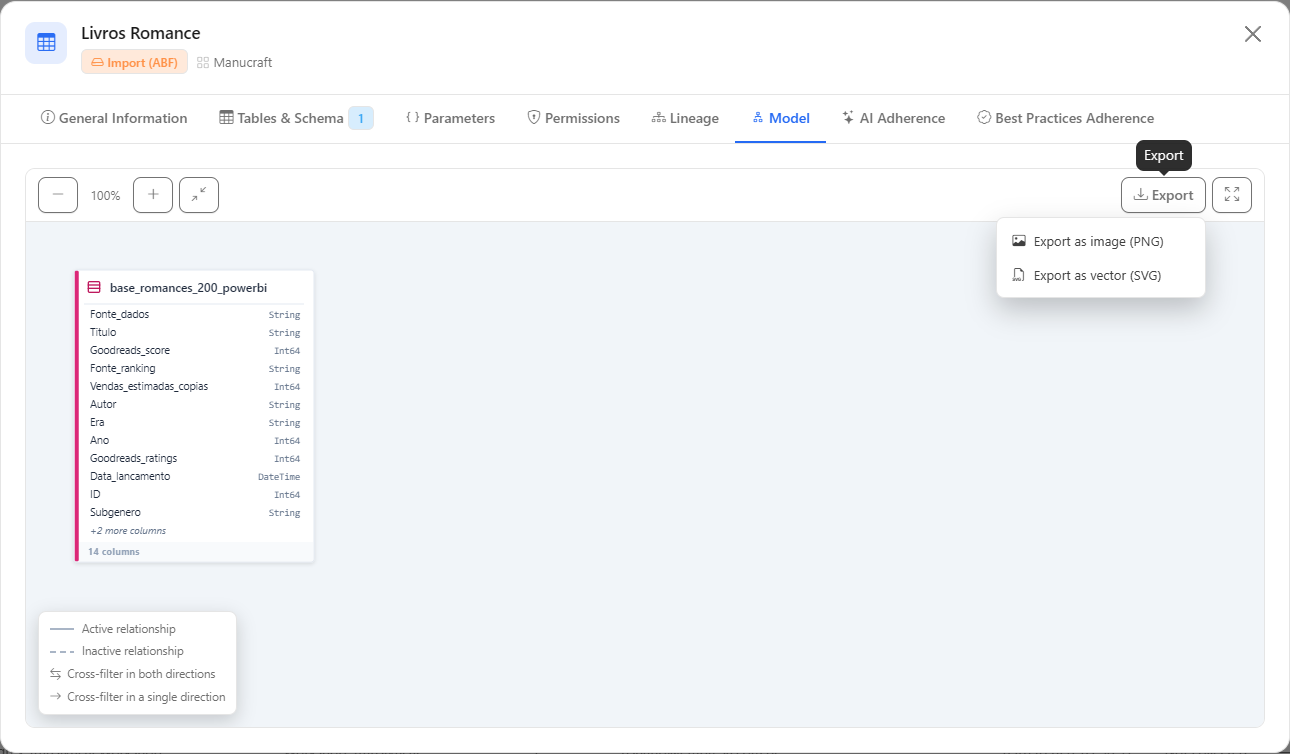
**What it is:** the **Export** button on the **Model** tab, with **Export as image (PNG)** and **Export as vector (SVG)**.

**What it is for:** including the diagram in technical documentation, a wiki or a presentation.

<figure><picture><source srcset="/files/zoXpOjLlMdJ6LDmY2Qs1" media="(prefers-color-scheme: dark)"><img src="https://3938213054-files.gitbook.io/~/files/v0/b/gitbook-x-prod.appspot.com/o/spaces%2FH2bFRBmIfyK3kwVKbldl%2Fuploads%2Fgit-blob-4ae2e05db2f42c3fa81a8a42b0b90aa1f266f545%2Fpm-governanca-modelos-semanticos-diagrama-exportar-en.png?alt=media" alt="Model diagram Export menu with the PNG and SVG options"></picture><figcaption><p>Model diagram export options</p></figcaption></figure>

**How to use:**

1. On the **Model** tab, click **Export**.
2. Choose **Export as image (PNG)** or **Export as vector (SVG)**. The file is downloaded by the browser.

**How it works:** the PNG is generated in high resolution with the entire diagram, regardless of the screen zoom; the SVG is vector-based and can be enlarged without loss of quality.

### AI Adherence tab

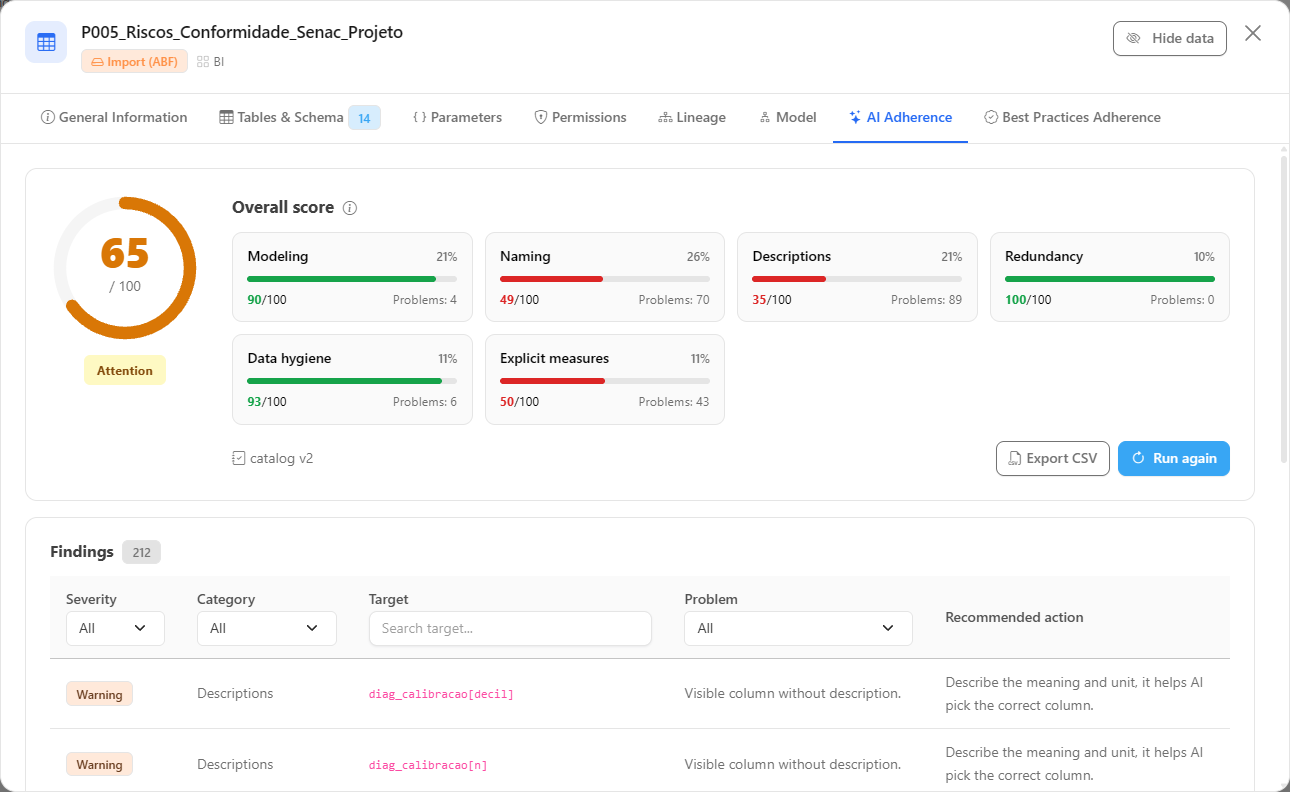
**What it is:** an assessment of how prepared the model is for use with AI, with a score from 0 to 100.

**What it is for:** knowing what to adjust in the model so that the answers generated by AI tools about it are more reliable, with the recommended action for each problem.

<figure><picture><source srcset="/files/7qxHi4LSlCffdtvCklOa" media="(prefers-color-scheme: dark)"><img src="https://3938213054-files.gitbook.io/~/files/v0/b/gitbook-x-prod.appspot.com/o/spaces%2FH2bFRBmIfyK3kwVKbldl%2Fuploads%2Fgit-blob-918ad274930149465a2164419dff04b245b3f32e%2Fpm-governanca-modelos-semanticos-modal-aderencia-ia-en.png?alt=media" alt="AI Adherence tab with the overall score, the categories and the table of findings"></picture><figcaption><p>AI Adherence tab</p></figcaption></figure>

**How to use:**

1. In the model's **⋮** menu, hover over **Open details** and choose **AI Adherence**. The tab shows "Analyzing the model..." while it calculates.
2. See the overall score and the status badge: **Good** (80 or more), **Warning** (60 to 79) or **Needs attention** (below 60).
3. In **Overall score**, each category shows its weight, score and number of **Problems**. Click a category to filter the **Findings** table (click **Clear filter** to undo).
4. Filter the table by **Severity**, **Category**, **Target** or **Problem** and read the **Recommended action** of each item; when available, the **Source** link opens the rule's reference.
5. Click **Export CSV** to download the list of problems, or **Run again** to recalculate the analysis.

**How it works:** the analysis uses the metadata from the model's last scan. The rules and categories are described in [AI Score](/en/power-monitor/qualidade-de-dados/score-de-ia.md). Next to **Export CSV** the rule catalog version appears (*catalog vN*): compare scores only between analyses of the same version, because the score can change when the catalog changes. The information icon on **Overall score** explains the weights (categories without applicable checks are left out and the weights are redistributed). On each finding, **Recommendation** expands the fix text and the rule source appears as **Source: Microsoft**, **Source: W3C standard**, **Source: Community tool**, **Source: Power Monitor heuristic** or a link with the reference address. When data is missing, the expandable **Rules not evaluated (N)** list says which rules were left out of the calculation and why, and a notice reports that part of the model metadata is not available.

### Best Practices Adherence tab

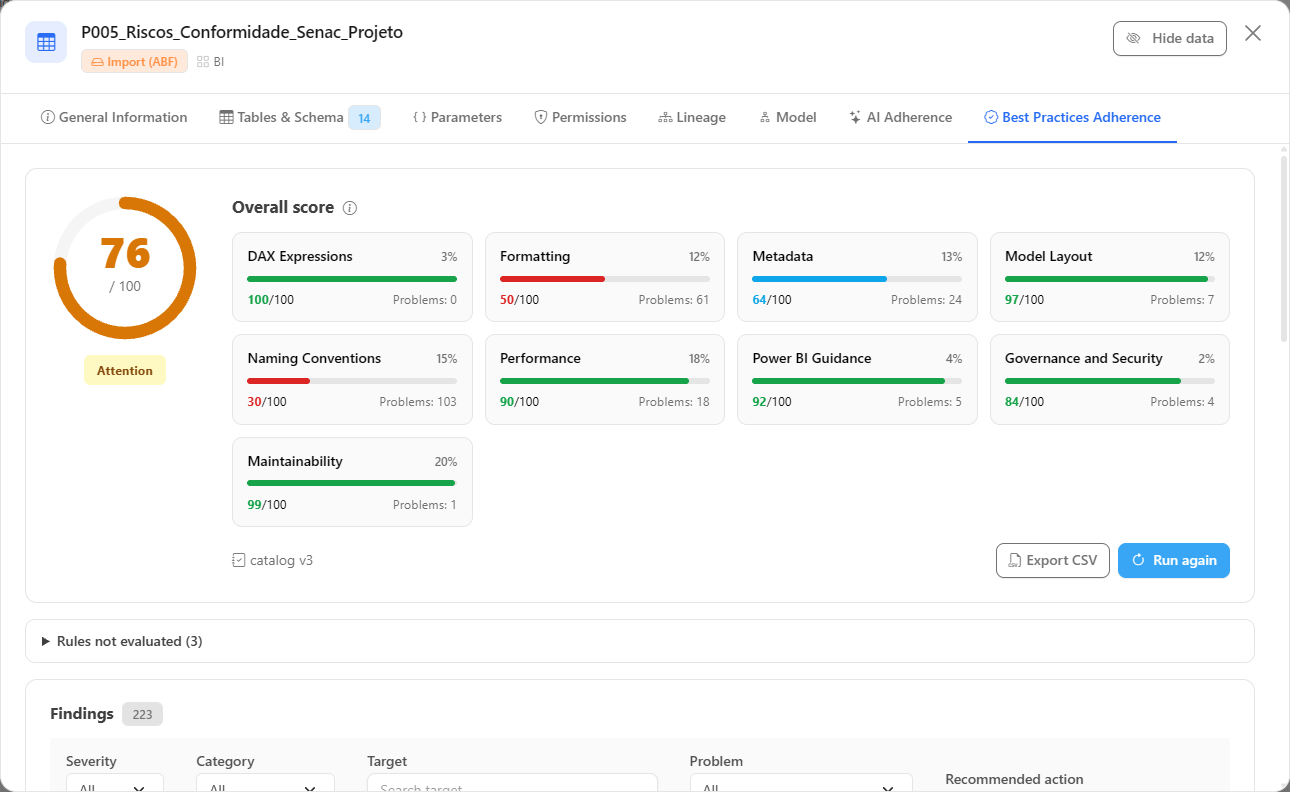
**What it is:** an assessment of the model according to the modeling best practice rules, with a score from 0 to 100.

**What it is for:** finding modeling problems that affect performance, maintenance and standardization, with the recommended action for each one.

<figure><picture><source srcset="/files/BfQz1ZyXLtxRGV8rOTHa" media="(prefers-color-scheme: dark)"><img src="https://3938213054-files.gitbook.io/~/files/v0/b/gitbook-x-prod.appspot.com/o/spaces%2FH2bFRBmIfyK3kwVKbldl%2Fuploads%2Fgit-blob-5ff2a2a3a9482e2214ac73fe35a369887ef3d247%2Fpm-governanca-modelos-semanticos-modal-boas-praticas-en.png?alt=media" alt="Best Practices Adherence tab with the overall score, the categories and the table of findings"></picture><figcaption><p>Best Practices Adherence tab</p></figcaption></figure>

**How to use:** it works exactly like the [AI Adherence tab](#ai-adherence-tab): overall score with badge, categories clickable as filters, **Findings** table with filters, **Export CSV** and **Run again**.

**How it works:** the analysis uses the metadata from the model's last scan. The rules are described in [Best Practices Score](/en/power-monitor/qualidade-de-dados/score-de-boas-praticas-bpa.md). The rule catalog, recommendations, sources and the **Rules not evaluated (N)** list work as described in the previous tab.

### Schedules tab

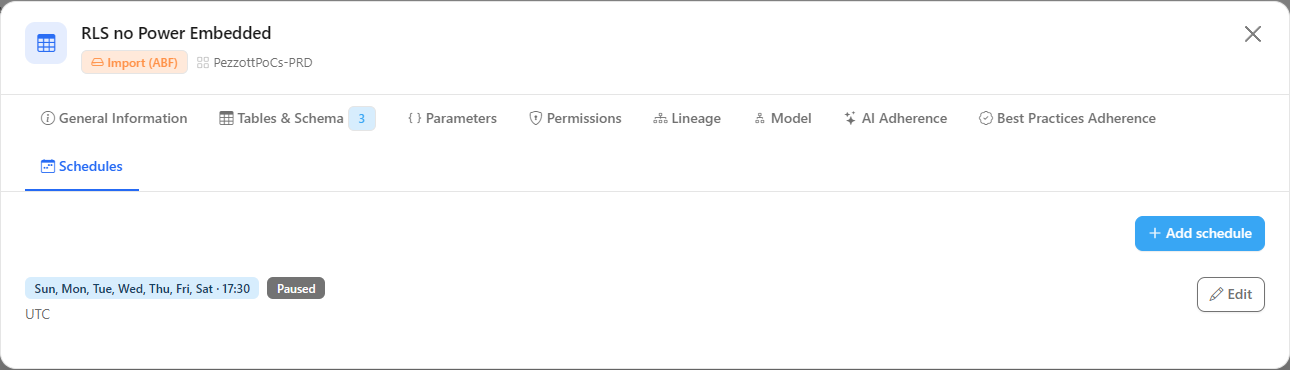
**What it is:** the model's refresh schedule, read directly from Power BI when the tab is opened, with the option to create or change it.

**What it is for:** checking and adjusting the days, times and time zone of the scheduled refresh without leaving Power Monitor, for example, to move the refresh out of a capacity peak time.

<figure><picture><source srcset="/files/pzBIZNitqIaO6libxcDv" media="(prefers-color-scheme: dark)"><img src="https://3938213054-files.gitbook.io/~/files/v0/b/gitbook-x-prod.appspot.com/o/spaces%2FH2bFRBmIfyK3kwVKbldl%2Fuploads%2Fgit-blob-b65abfef6633fb807adc73e38f23b19928447955%2Fpm-governanca-modelos-semanticos-modal-agendamentos-en.png?alt=media" alt="Schedules tab of the semantic model modal with the refresh schedule summary"></picture><figcaption><p>Schedules tab</p></figcaption></figure>

{% hint style="info" %}
Viewing is available to all profiles; **Add schedule** and **Edit** are exclusive to the **Administrator**. The Power Monitor Service Principal must have access to the model's workspace.
{% endhint %}

**How to use:**

{% stepper %}
{% step %}

#### Open the tab

In the model's **⋮** menu, hover over **Open details** and choose **Schedules**. The screen shows "Checking the service principal’s access…" while it queries Power BI.
{% endstep %}

{% step %}

#### Check the current schedule

The schedule appears with the summary of days and times, the status (**Active** or **Paused**) and the time zone. If the model has no schedule, "This item has no schedule yet." appears.
{% endstep %}

{% step %}

#### Create or change

Click **Add schedule** (opens **Create refresh schedule**) or **Edit** (opens **Edit refresh schedule**). Select the **Days of the week**, enter the **Times**, the **Time zone**, the status (active/paused) and the **Notification**.
{% endstep %}

{% step %}

#### Save

Click **Create schedule** or **Save**. The tab is reread from Power BI and shows the new configuration. If Power BI rejects the change, the provider's message appears in the form.
{% endstep %}
{% endstepper %}

**How it works:**

* In Power BI each model has a single refresh schedule, and it cannot be deleted: to turn it off, pause it or clear all the days.
* The tab only exists when the model has its Power BI identifiers registered.
* If the warning that the service principal does not have access to the workspace appears, use the **Grant access to the service principal** button or grant access manually in the workspace. The details of each form field are in [Schedules](/en/power-monitor/governanca/operacao/agendamentos.md#features).

### Refresh History

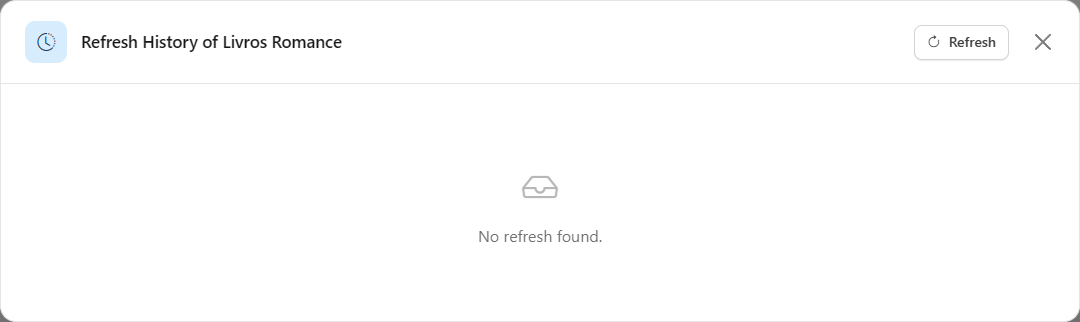
**What it is:** the **Refresh History of&#x20;*****model name*** modal, opened from the **⋮** menu, with the model's refreshes from newest to oldest.

**What it is for:** investigating a slow or failed refresh, seeing when it started, how long it took, how much it deviated from the average and what the error was.

<figure><picture><source srcset="/files/COHqv4xyOZ69LK5Agpb4" media="(prefers-color-scheme: dark)"><img src="https://3938213054-files.gitbook.io/~/files/v0/b/gitbook-x-prod.appspot.com/o/spaces%2FH2bFRBmIfyK3kwVKbldl%2Fuploads%2Fgit-blob-a08bf33fd4cb4b0ca53145e46c44c02fd5c4f964%2Fpm-governanca-modelos-semanticos-historico-atualizacoes-en.png?alt=media" alt="Refresh History modal with the Type, Start, End, Duration, Variance, Status and Message columns"></picture><figcaption><p>Refresh History of a model</p></figcaption></figure>

**How to use:**

{% stepper %}
{% step %}

#### Open the history

In the model's **⋮** menu, click **Refresh History**.
{% endstep %}

{% step %}

#### Analyze the runs

Look at the **Variance** column: red indicates a run much slower than the historical average; green, much faster (hover over it to read the interpretation). For failures, hover over the **Message** to read the complete error.
{% endstep %}

{% step %}

#### Reload, if needed

Click **Refresh** to fetch the most recent runs without closing the modal. The history does not update by itself while the modal is open.
{% endstep %}
{% endstepper %}

**How it works:**

| Column              | Description                                                                                                                                                                                                                                                                                    |
| ------------------- | ---------------------------------------------------------------------------------------------------------------------------------------------------------------------------------------------------------------------------------------------------------------------------------------------- |
| **Type**            | How the refresh was triggered: **Scheduled**, **On-demand**, **Via API**, **Via Enhanced API**, **Via XMLA endpoint** or **OneDrive**.                                                                                                                                                         |
| **Start** / **End** | Start and end of the run.                                                                                                                                                                                                                                                                      |
| **Duration**        | Total refresh time.                                                                                                                                                                                                                                                                            |
| **Variance**        | Percentage difference between this duration and the model's historical average. Down to −40%: green ("Much faster than the historical average"); from +40%: red ("Much slower than the historical average"); in between: gray ("within the expected range"). "-" when there is no average yet. |
| **Status**          | Refresh result, in a colored badge.                                                                                                                                                                                                                                                            |
| **Message**         | Error code and message, when there was a failure.                                                                                                                                                                                                                                              |

The history comes from the semantic model refresh monitoring. Without runs, the modal shows "No refresh found.". To track refreshes in real time and configure alerts, use [Monitoring › Semantic Models](/en/power-monitor/monitoramento/modelos-semanticos.md).

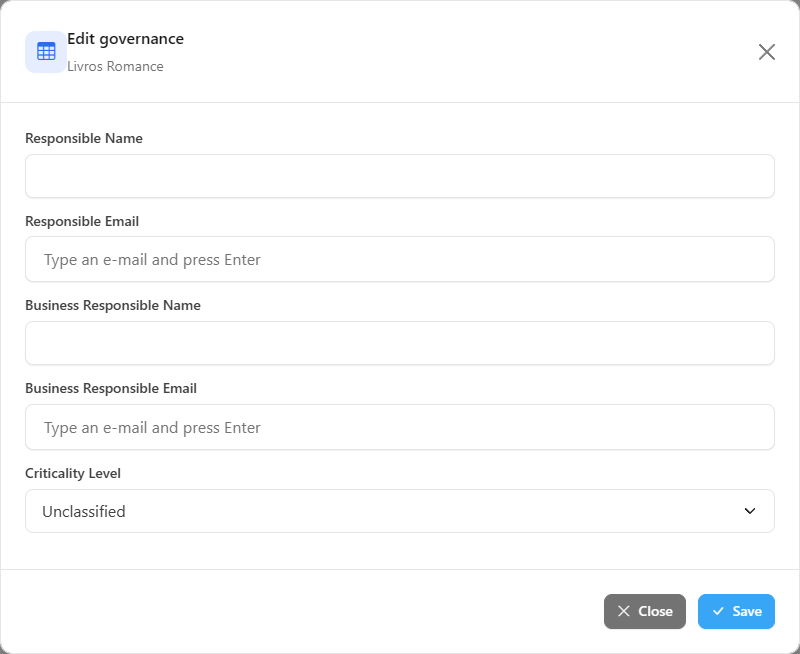
### Edit the governance of a model

**What it is:** the **Edit governance** modal, opened from the **⋮** menu, for recording the technical owner, the business owner and the criticality of a model.

**What it is for:** knowing whom to turn to when the model fails and prioritizing support for the most critical models. The registered e-mails can also be used as alert recipients.

{% hint style="info" %}
Requires the **Administrator** profile. For other profiles, the **Edit governance** item does not appear in the menu.
{% endhint %}

<figure><picture><source srcset="/files/WVjLyqNCFwZWuws9qXO7" media="(prefers-color-scheme: dark)"><img src="https://3938213054-files.gitbook.io/~/files/v0/b/gitbook-x-prod.appspot.com/o/spaces%2FH2bFRBmIfyK3kwVKbldl%2Fuploads%2Fgit-blob-f75e930bf945e12c3bf5ec5708c74ceafb8bf2c1%2Fpm-governanca-modelos-semanticos-editar-governanca-en.png?alt=media" alt="Edit governance modal of a semantic model with the owner and criticality fields"></picture><figcaption><p>Editing the governance of a model</p></figcaption></figure>

**How to use:**

{% stepper %}
{% step %}

#### Open the modal

In the model's **⋮** menu (or by right-clicking the row), click **Edit governance**. The modal opens with the model's current values.
{% endstep %}

{% step %}

#### Fill in the fields

Enter the **Responsible Name**, **Responsible Email**, **Business Responsible Name**, **Business Responsible Email** and the **Criticality Level**. In the e-mail fields, type each address and press Enter to add it; click the **×** of an e-mail to remove it.
{% endstep %}

{% step %}

#### Save

Click **Save**. The message "Governance updated for 1 item(s)." appears and the **Criticality** column of the table is updated.
{% endstep %}
{% endstepper %}

**How it works:**

| Field                          | Note                                                       |
| ------------------------------ | ---------------------------------------------------------- |
| **Responsible Name**           | Free text.                                                 |
| **Responsible Email**          | One or more e-mails: type and press Enter to add each one. |
| **Business Responsible Name**  | Free text.                                                 |
| **Business Responsible Email** | One or more e-mails.                                       |
| **Criticality Level**          | Low, Medium, High, Critical or Unclassified.               |

In single-model mode, all fields are saved when you save. The **Area** and **Sub-Area** fields exist only in the governance of [Workspaces](/en/power-monitor/governanca/workspaces.md); they do not appear for semantic models.

{% hint style="info" %}
The owner e-mails registered here can be used as alert recipients, for example, the option to notify the semantic model contacts in data refresh alerts. The same governance can also be applied from the workspace, with the **Apply to all items in the workspace** option (see [Workspaces](/en/power-monitor/governanca/workspaces.md)).
{% endhint %}

### Bulk governance editing

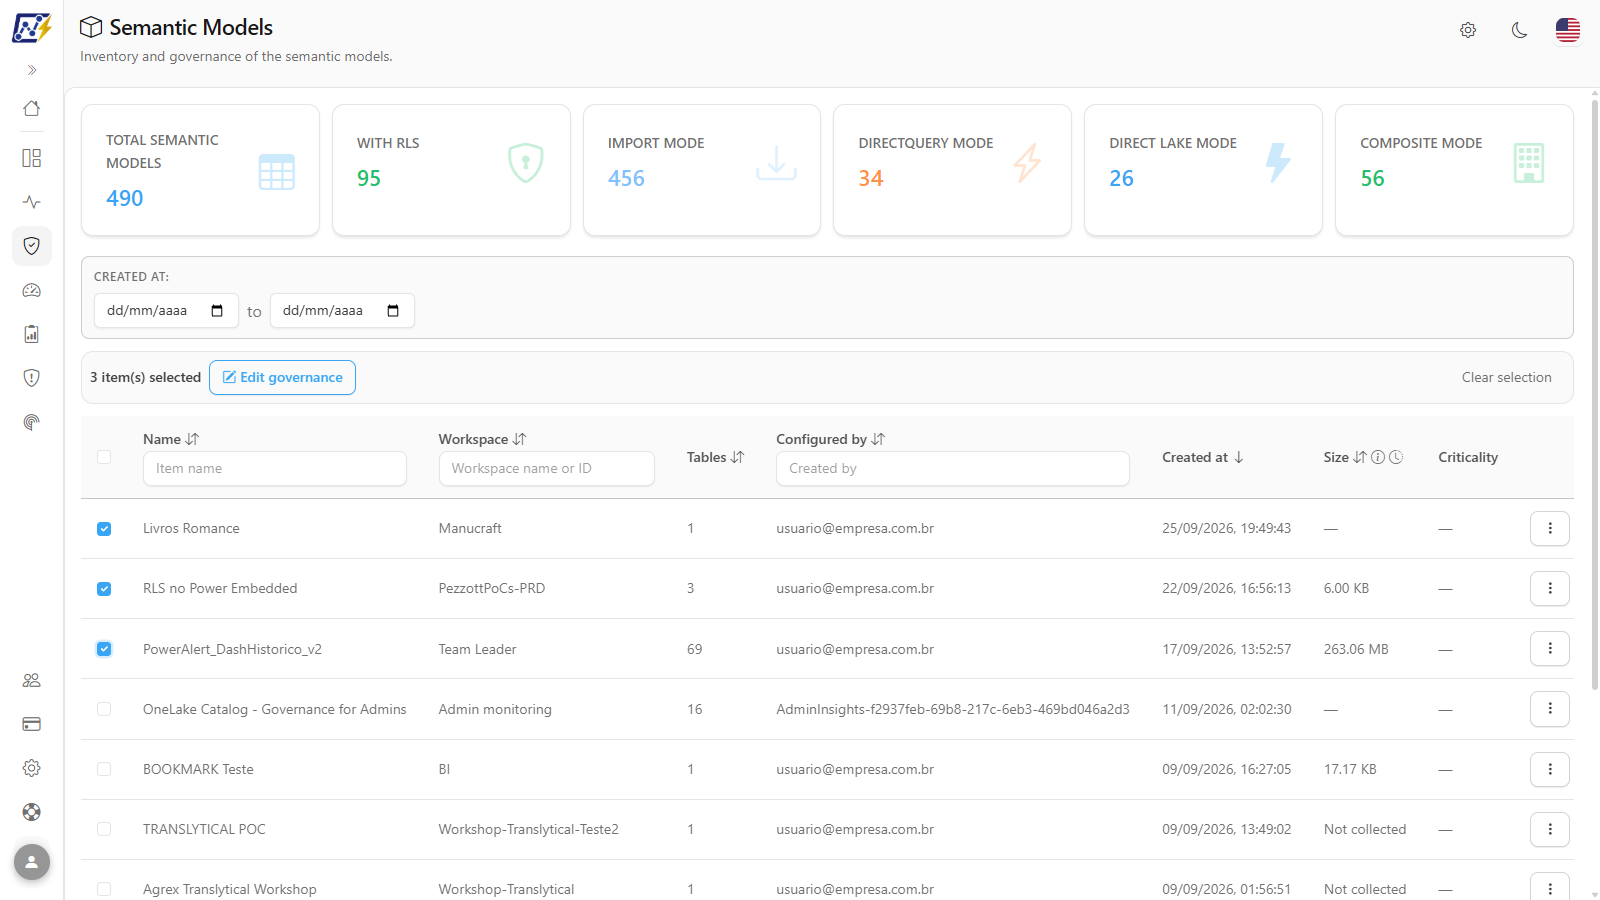
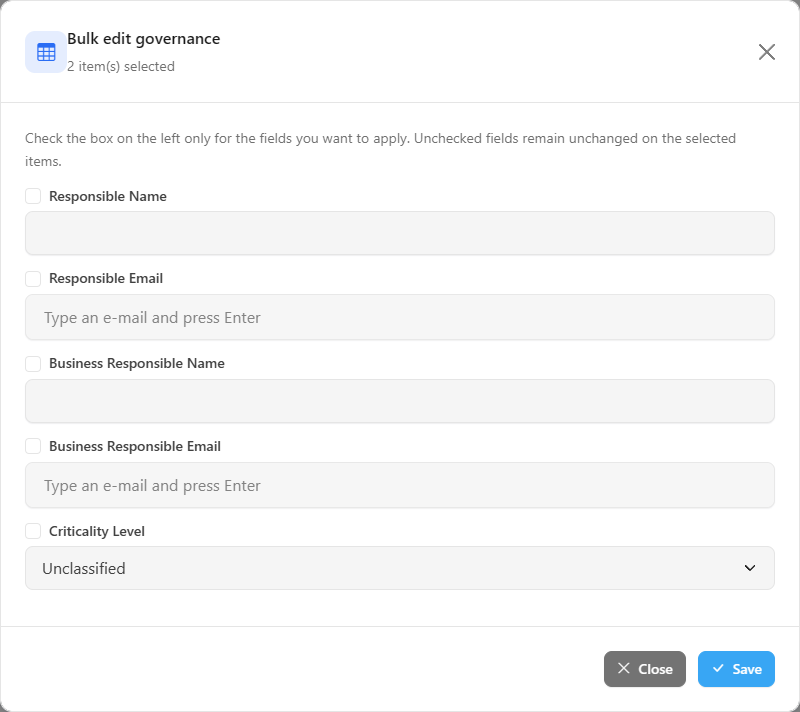
**What it is:** the selection of several rows with the **"*****N*****&#x20;item(s) selected"** bar and the **Bulk edit governance** modal.

**What it is for:** applying the same owner or the same criticality to several models at once, for example, all models of a Finance workspace.

{% hint style="info" %}
Requires the **Administrator** profile. The checkboxes and the action bar only appear for Administrators.
{% endhint %}

<figure><picture><source srcset="/files/OZNWeq7ezDTJxaYeYa6N" media="(prefers-color-scheme: dark)"><img src="https://3938213054-files.gitbook.io/~/files/v0/b/gitbook-x-prod.appspot.com/o/spaces%2FH2bFRBmIfyK3kwVKbldl%2Fuploads%2Fgit-blob-2102f0704393a6bd5f09617ec8c36378d12df2dd%2Fpm-governanca-modelos-semanticos-barra-selecao-en.png?alt=media" alt="Selection bar with the text 3 item(s) selected and the Edit governance and Clear selection buttons"></picture><figcaption><p>Bulk selection action bar</p></figcaption></figure>

<figure><picture><source srcset="/files/FYTDsiyYiDSUnPUjAtf9" media="(prefers-color-scheme: dark)"><img src="https://3938213054-files.gitbook.io/~/files/v0/b/gitbook-x-prod.appspot.com/o/spaces%2FH2bFRBmIfyK3kwVKbldl%2Fuploads%2Fgit-blob-53315d93a2907672d153b44327a9e65aaba6b98c%2Fpm-governanca-modelos-semanticos-editar-governanca-massa-en.png?alt=media" alt="Bulk edit governance modal with the Include this field checkboxes"></picture><figcaption><p>Bulk governance editing</p></figcaption></figure>

**How to use:**

{% stepper %}
{% step %}

#### Select the models

Filter the list (for example, by **Workspace**) and select the checkboxes of the desired models. The header checkbox selects all models **on the current page**. The "*N* item(s) selected" bar appears above the table.
{% endstep %}

{% step %}

#### Open the bulk edit

Click **Edit governance** on the bar. The **Bulk edit governance** modal opens with all fields disabled.
{% endstep %}

{% step %}

#### Select only what you want to change

Select the checkbox to the left of the fields you want to apply (*Include this field*, for example, *Responsible Email* and *Criticality Level*) and fill in the values.
{% endstep %}

{% step %}

#### Save

Click **Save**. The message "Governance updated for *N* item(s)." appears, the selection is cleared and the table is reloaded. To give up before saving, use **Close** in the modal or **Clear selection** on the bar.
{% endstep %}
{% endstepper %}

**How it works:** only the selected fields are saved to the selected models, the others remain as they are. You must select at least one field; otherwise, the message "Select at least one field to apply." appears. A field that is selected and left blank **clears** the value on the selected items.

### Assess performance

**What it is:** a shortcut in the **⋮** menu (**Assess performance**, with the *beta* badge) to the Performance Assessment screen.

**What it is for:** going from the inventory directly to a performance analysis of the model, without having to search for it again.

**How to use:**

1. In the model's **⋮** menu, click **Assess performance**.
2. The [Performance Assessment](/en/power-monitor/performance/avaliacao-de-performance.md) screen opens with the model already selected; follow that screen's flow to request the assessment.

**How it works:** the shortcut only navigates. The assessment itself is requested (and controlled by permission) on the destination screen.

### View change history

**What it is:** the **View change history** action of the **⋮** menu, right after **Assess performance**, which opens the model's version history: the timeline of captured versions and the difference comparer (tables, columns, measures and relationships added, removed or changed).

**What it is for:** finding out what changed in the model structure before a report breaks, without leaving the inventory.

**How to use:**

1. In the model's **⋮** menu, click **View change history**.
2. In the window, choose two versions (or use **Compare with previous**) to see the differences by severity.

**How it works:** the history only exists for models whose definition Power Monitor can read (the Service Principal needs write permission on the model). See [Model History](/en/power-monitor/governanca/operacao/historico-de-modelos.md).

### Open in Power BI and Settings in Power BI

**What it is:** shortcuts in the **⋮** menu that open the model in the Power BI portal.

**What it is for:** going directly to Power BI to act on the model, adjusting credentials, gateway or scheduled refresh, or opening the model page.

**How to use:**

1. In the model's **⋮** menu, click **Open in Power BI** to open the model page, or **Settings in Power BI** to open the settings (credentials, gateway, scheduled refresh).
2. The page opens in a new browser tab.

**How it works:** you need to have access to the model in Power BI to view the page; Power Monitor does not grant this access.

## Rules and permissions

* **Permissions:** editing governance (individually or in bulk), creating/editing schedules and changing the deviation monitoring switch are **Administrator** actions. All queries, diagram exports and links to Power BI are available to all profiles.
* **Scope:** only models from workspaces that are monitored and visible to the user appear.
* **Hide data:** the button is below the screen title and in the details modal header (which also applies to the **Lineage** tab). When on, it masks **Configured by** on screen, the modal's **Configured by ID** and who published the apps in the lineage (also in the exported text). The preference applies to the browser and is shared across screens.
* **Data source:** inventory and permissions come from the inventory scan; tables, columns, measures and expressions come from the scan with enhanced metadata and from the model mapping; size and technical details come from the daily capture via XMLA; the refresh history comes from the semantic model monitoring; schedules are read from Power BI at query time.

## Frequently asked questions

<details>

<summary>Why does the Size column show "-" or "Not collected"?</summary>

"-" means that the workspace is not on dedicated capacity: the XMLA endpoint does not exist for that workspace and the size cannot be measured. "Not collected" means that the capture has not yet run for the model or has failed, hover over it to see the reason. The most common cause is that the Service Principal is not a member of the workspace.

</details>

<details>

<summary>A Direct Lake model does not appear on the Direct Lake Mode card.</summary>

Direct Lake mode is identified by the model's tables, which are filled in by the model mapping scan. Wait for the next mapping (or ask an Administrator to run it) and the model will be counted.

</details>

<details>

<summary>Why does an Import model appear on the DirectQuery Mode card?</summary>

Because the card counts the storage format reported by Power BI, and models with the **large semantic model format** are reported as *Premium Files*. See the warning in [KPI cards and card filter](#kpi-cards-and-card-filter).

</details>

<details>

<summary>The Tables &#x26; Schema tab says "Detailed schema not available".</summary>

The columns, measures and expressions come from the scan with enhanced metadata. Check whether the tenant allows the Service Principal to read enhanced metadata in the Fabric admin settings and run a new inventory scan.

</details>

<details>

<summary>I do not see the Schedules tab in the modal.</summary>

The tab only appears when the model has its Power BI identifiers registered in the inventory. Wait for the next inventory scan.

</details>

<details>

<summary>I do not see the Edit governance button or the checkboxes.</summary>

These features are exclusive to the Administrator. Users of other profiles see the criticality in the table, but cannot change it.

</details>

## Related pages

* [Workspaces](/en/power-monitor/governanca/workspaces.md)
* [Reports](/en/power-monitor/governanca/relatorios.md)
* [Storage](/en/power-monitor/governanca/armazenamento.md)
* [Performance Assessment](/en/power-monitor/performance/avaliacao-de-performance.md)
* [Schedules](/en/power-monitor/governanca/operacao/agendamentos.md)
* [Average Execution Time](/en/power-monitor/performance/tempo-medio-de-execucao.md)
* [Monitoring › Semantic Models](/en/power-monitor/monitoramento/modelos-semanticos.md)
* [Model Size Scan](/en/power-monitor/mapeamento/tamanho-de-modelos.md)
* [AI Score](/en/power-monitor/qualidade-de-dados/score-de-ia.md)
* [Best Practices Score](/en/power-monitor/qualidade-de-dados/score-de-boas-praticas-bpa.md)
* [Data Lineage](/en/power-monitor/qualidade-de-dados/linhagem-de-dados.md)


---

# Agent Instructions
This documentation is published with GitBook. GitBook is the documentation platform designed so that both humans and AI agents can read, navigate, and reason over technical content effectively. Learn more at gitbook.com.

## Querying This Documentation
If you need additional information that is not directly available in this page, you can query the documentation by asking a question.

Perform an HTTP GET request on the following URL with the `ask` and `goal` query parameters:

```
GET https://docs.powermonitor.com.br/en/power-monitor/governanca/modelos-semanticos.md?ask=<question>&goal=<user_goal>
```

`ask` is the immediate question: it should be specific, self-contained, and written in natural language.
`goal` is what the user is ultimately trying to achieve, the reason they need the answer. Sharing it helps GitBook give you a better, more relevant answer. A goal is most helpful when it describes the outcome the user wants rather than restating the question. For example, with `ask=how do I create an API token`, a goal like `automate deployments from our CI pipeline` lets GitBook tailor the answer to that use case.

The response will contain a direct answer to the question and relevant excerpts and sources from the documentation.

Use this mechanism when the answer is not explicitly present in the current page, you need clarification or additional context, or you want to retrieve related documentation sections.