> For the complete documentation index, see [llms.txt](https://docs.powermonitor.com.br/llms.txt). Markdown versions of documentation pages are available by appending `.md` to page URLs; this page is available as [Markdown](https://docs.powermonitor.com.br/en/power-monitor/governanca/operacao/agendamentos.md).

# Schedules

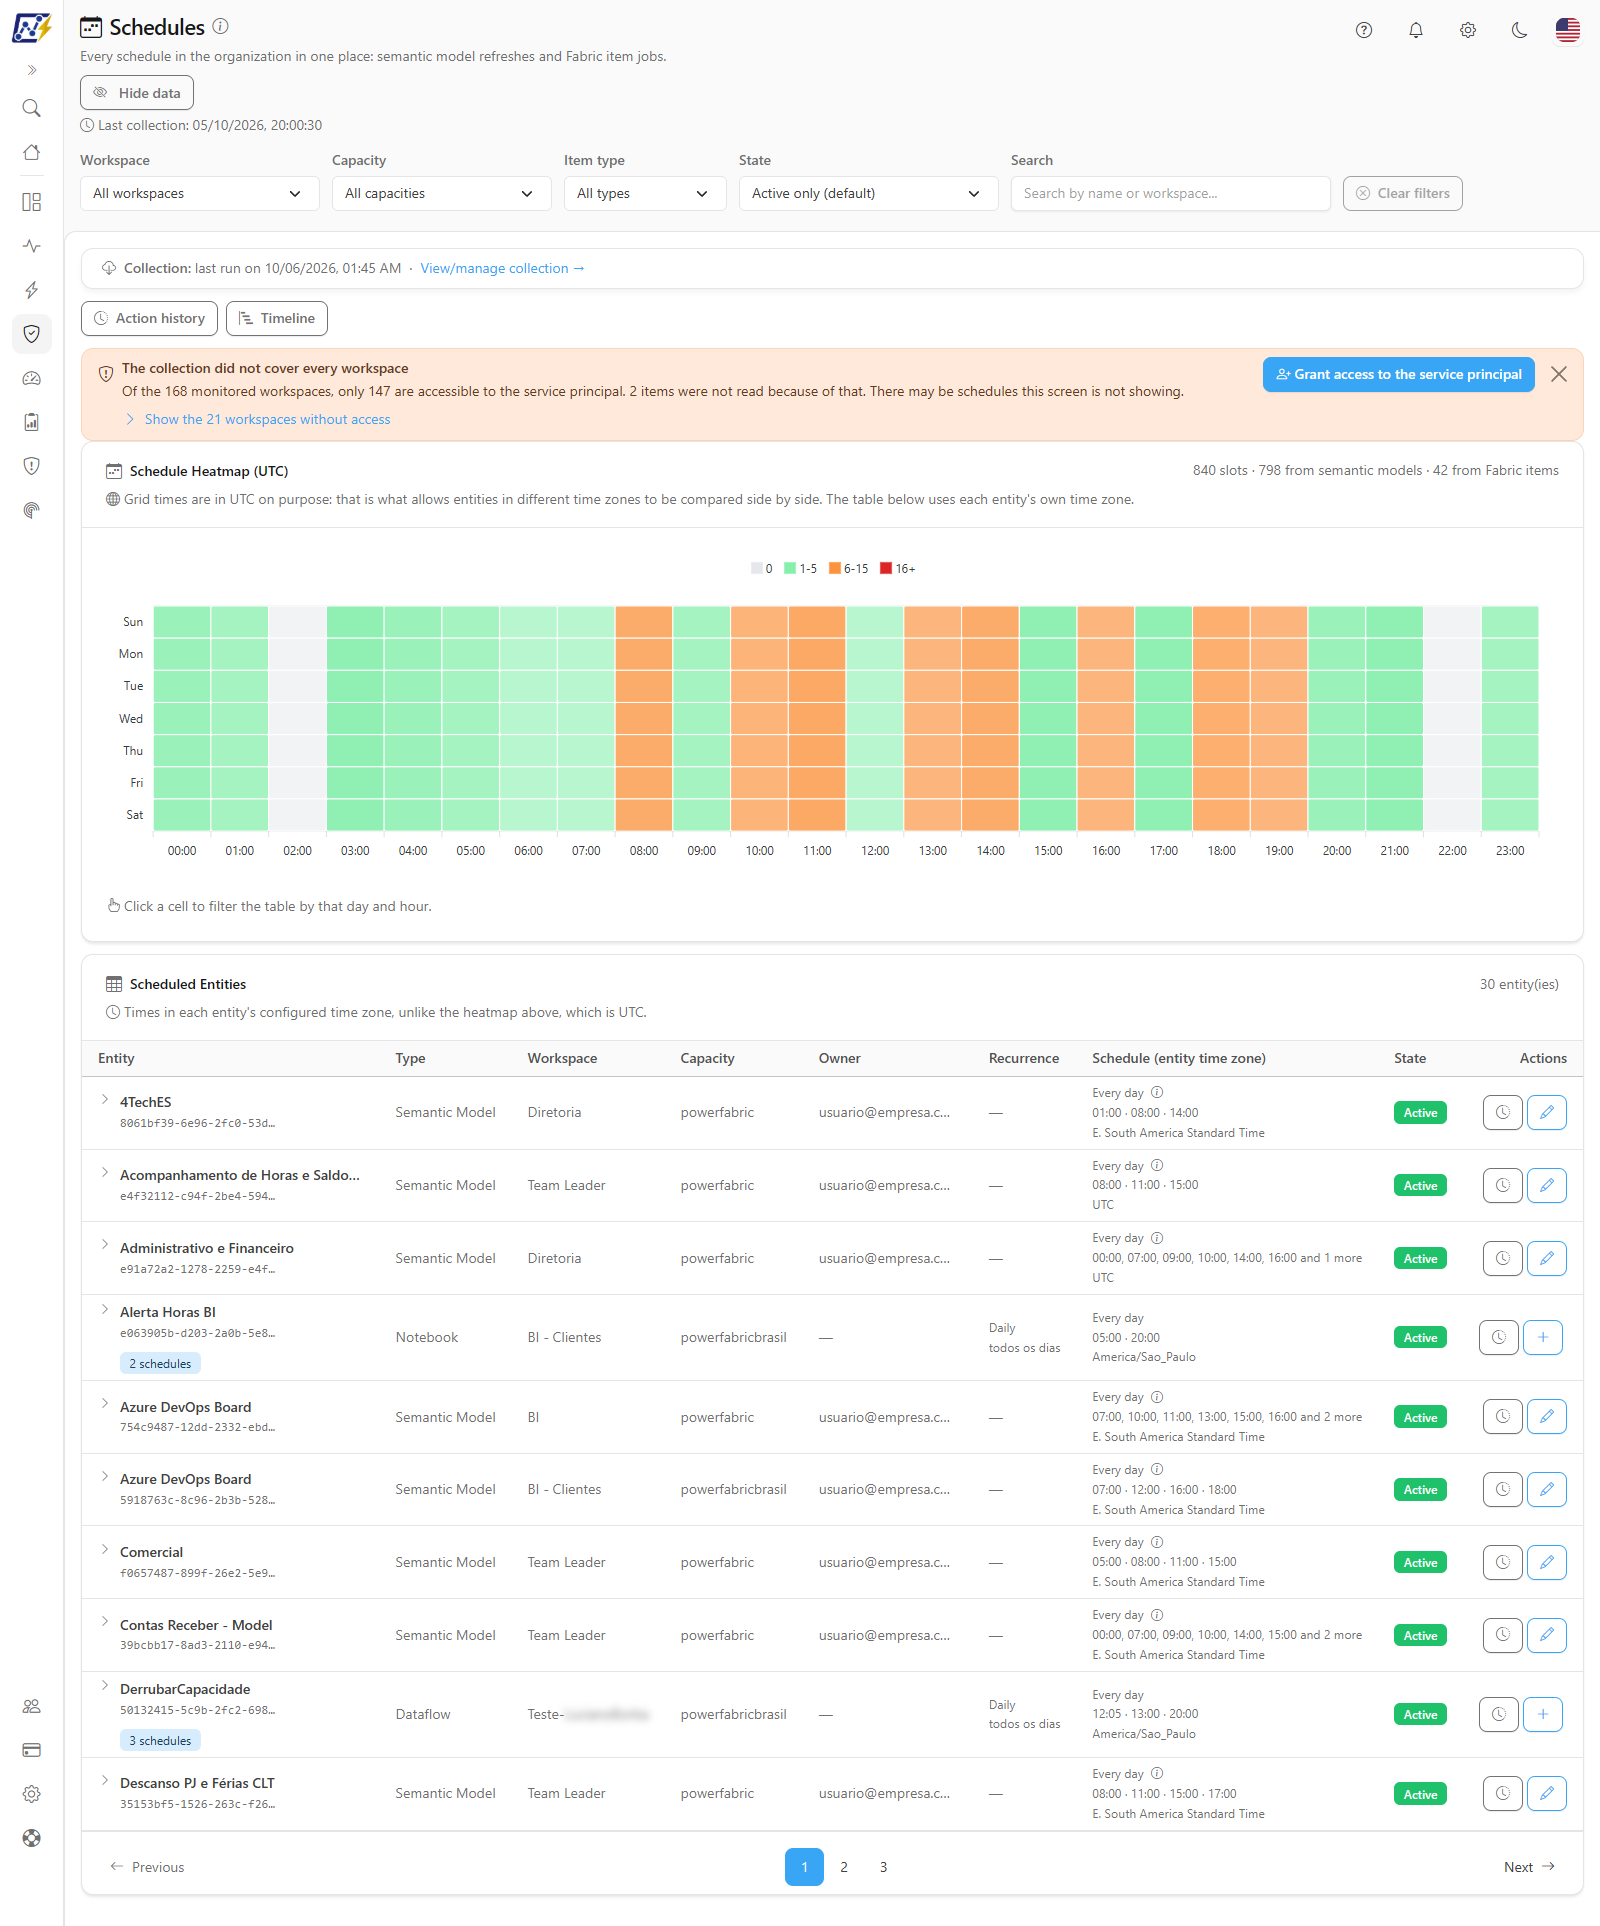
All of the organization's schedules in one place, semantic model refreshes and Fabric item jobs, with a concentration heatmap, editing, action history and an execution timeline.

The **Schedules** screen brings together in one place all of the organization's schedules: **semantic model refresh schedules** and **Fabric item job schedules** (Data Pipelines, Copy Jobs, Notebooks and Dataflows). A **heatmap** shows on which days and at what times the schedules are concentrated, the table details each entity's schedule, and administrators can create, edit, pause and delete schedules without leaving Power Monitor.

From it you can also reach the **Refresh Execution Timeline**, which shows the actual semantic model refresh executions in a Gantt chart.

**How to access:** menu *Governance › Operations › Schedules*. The Timeline is opened with the **Timeline** button, in the screen's action bar.

**Who can use it:** viewing (heatmap, table, action history and timeline) is available to **all profiles**. Creating, editing, pausing and deleting schedules are exclusive to **Administrators**; for other profiles these buttons are not displayed. Manual collection and the refresh history reconciliation are in [Mapping › Refreshes and Schedules](/en/power-monitor/mapeamento/atualizacoes-e-agendamentos.md), which is also exclusive to Administrators. The screen respects each user's **workspace scope** and can be hidden for specific users by the administrator, on the **Page access** tab of the [Users](/en/power-monitor/usuarios.md) record.

<figure><picture><source srcset="/files/k4tIdAUuZthHjYYpPWtX" media="(prefers-color-scheme: dark)"><img src="https://3938213054-files.gitbook.io/~/files/v0/b/gitbook-x-prod.appspot.com/o/spaces%2FH2bFRBmIfyK3kwVKbldl%2Fuploads%2Fgit-blob-3627c448a1742786d51f7634320ad864ad6c802f%2Fpm-governanca-agendamentos-en.png?alt=media" alt="Schedules screen with filters, action bar, heatmap and scheduled entities table"></picture><figcaption><p>Governance › Operations › Schedules</p></figcaption></figure>

## What it is for

* **Finding peak times**: identifying when many refreshes and jobs fire at the same time and compete for the same capacity (for example, dozens of models at 08:00).
* **Redistributing loads**: moving schedules to idle times based on the heatmap.
* **Auditing the schedule**: seeing who owns each schedule, whether it is active or paused and in which time zone it was configured.
* **Operating schedules** (Administrators): creating, changing, pausing and deleting Fabric item schedules and adjusting semantic model refresh schedules, directly in Power BI/Fabric.
* **Investigating failed changes**: the action history also records the attempts that failed and the reason.
* **Seeing what actually ran**: the Timeline shows the start, end, duration and result of each refresh.

## Screen overview

**Schedules** (*Governance › Operations › Schedules*), from top to bottom:

1. **Header**: **Schedules** title with an information icon, subtitle, the **Hide data** button and the **Last collection** line.
2. **Filters**: **Workspace**, **Capacity**, **Item type**, **State**, **Search** and the **Clear filters** button.
3. **Collection** line (status of the last run and, for Administrators, the **View/manage collection →** link) and **action bar**: **Action history** and **Timeline**.
4. **Notices** (when applicable): result of a change or collection, incomplete collection coverage, loading error.
5. **Schedule Heatmap (UTC)**: grid of days of the week × hours.
6. **Monthly schedules notice** (when applicable).
7. **Scheduled Entities table**, with expandable rows, per-row actions and pagination (10 per page, adjustable in **Items per page**).

**Refresh Execution Timeline** (**Timeline** button):

1. **Action bar** with the **View/manage collection →** link (Administrators), which leads to the collection in Mapping.
2. **Filters**: **Day**, **Start Time**, **End Time**, **Semantic Model**, **Workspace**, **Capacity**, **Gateway**, **Connection** and **Clear filters**.
3. **Gantt chart** of the executions, with zoom and fullscreen.

## Features

### Header and Last collection

**What it is:** below the **Schedules** title, the subtitle summarizes the screen and the line **Last collection:&#x20;*****date and time*** reports when the schedules were last collected. The information icon next to the title reminds you that the heatmap is in UTC and the table is in each entity's time zone.

**What it is for:** knowing whether what you are seeing is recent. If you have just changed a schedule directly in Power BI/Fabric and the last collection is earlier than that, the screen does not yet reflect the change.

<figure><picture><source srcset="/files/QcJwewmFkEwsB21zBlpN" media="(prefers-color-scheme: dark)"><img src="https://3938213054-files.gitbook.io/~/files/v0/b/gitbook-x-prod.appspot.com/o/spaces%2FH2bFRBmIfyK3kwVKbldl%2Fuploads%2Fgit-blob-677b8b101e2d242e769f5957a2dfbcdc73a6ee51%2Fpm-governanca-agendamentos-filtros-en.png?alt=media" alt="Schedules screen header with Last collection and the filter row"></picture><figcaption><p>Header, Last collection and filters</p></figcaption></figure>

**How to use:**

1. Check the date and time in **Last collection** (displayed in your browser's time zone).
2. Hover over the information icon next to the title to read the screen's time zone rule.

**How it works:** schedule collection runs automatically **every 6 hours**; an administrator can bring it forward in Mapping (see [Collection](#collection)). Until a collection has run, the **Last collection** line is not displayed.

### Workspace, Capacity and Item type filters

**What it is:** three selectors that restrict **both** the heatmap and the table **at the same time**:

| Filter        | Options                                                                                        |
| ------------- | ---------------------------------------------------------------------------------------------- |
| **Workspace** | **All workspaces** or a specific workspace                                                     |
| **Capacity**  | **All capacities** or a specific capacity                                                      |
| **Item type** | **All types**, **Semantic Model**, **DataPipeline**, **CopyJob**, **Notebook** or **Dataflow** |

**What it is for:** analyzing the concentration of schedules on a single capacity (who competes for the same resources), in a project's workspace or of one item type (for example, only semantic model refreshes).

**How to use:**

1. In *Governance › Operations › Schedules*, choose an option in **Workspace**, **Capacity** and/or **Item type**.
2. The heatmap and the table reload immediately, and the table goes back to the first page.
3. To return to the default, choose **All...** in the same selector or click **Clear filters**.

**How it works:** the filters can be combined.

### State filter

**What it is:** the **State** selector defines whether the screen shows active schedules, paused schedules or both: **Active only (default)**, **Paused only** or **Active and paused**.

**What it is for:** by default the screen shows only what will actually fire. Change the filter to find schedules that someone paused and forgot, or to review the full schedule before a change.

<figure><picture><source srcset="/files/2lIJLpbACFlB0oUSlMcV" media="(prefers-color-scheme: dark)"><img src="https://3938213054-files.gitbook.io/~/files/v0/b/gitbook-x-prod.appspot.com/o/spaces%2FH2bFRBmIfyK3kwVKbldl%2Fuploads%2Fgit-blob-1c667c1db708de52c2a7429fcf600e4c16f2a84b%2Fpm-governanca-agendamentos-limpar-filtros-en.png?alt=media" alt="State filter set to Active and paused and the Clear filters button highlighted with the active filter counter"></picture><figcaption><p>State = Active and paused, with the counter on Clear filters</p></figcaption></figure>

**How to use:**

1. Click **State** and choose **Paused only** or **Active and paused**.
2. The heatmap and the table start considering the chosen state.

**How it works:** the heatmap and the table always use the same state filter, so that they refer to the same set of schedules. An item with some of its times paused appears with the **Partial** badge (see [State column](#state-column-active-paused-and-partial)).

### Search

**What it is:** the **Search** field (*Search by name or workspace...*) filters the table by free text.

**What it is for:** quickly finding the schedule for a specific model or pipeline, or listing everything that exists in workspaces with the same name prefix.

**How to use:**

1. Type part of the entity or workspace name in **Search**.
2. The table is filtered a few moments after you stop typing and goes back to the first page.
3. Delete the text to return to the full list.

**How it works:** the search filters **only the table**; the heatmap does not change with it.

### Clear filters

**What it is:** the **Clear filters** button, at the end of the filter row. When filters are active, it is highlighted and shows how many.

**What it is for:** returning to the default scope in one go after an investigation.

**How to use:**

1. Click **Clear filters**.
2. Workspace, capacity and type go back to **All**, **State** goes back to **Active only (default)**, the search is cleared and the cell selected in the heatmap is deselected.

**How it works:** the counter includes the cell selected in the heatmap. With no active filters, the button is disabled.

### Action history

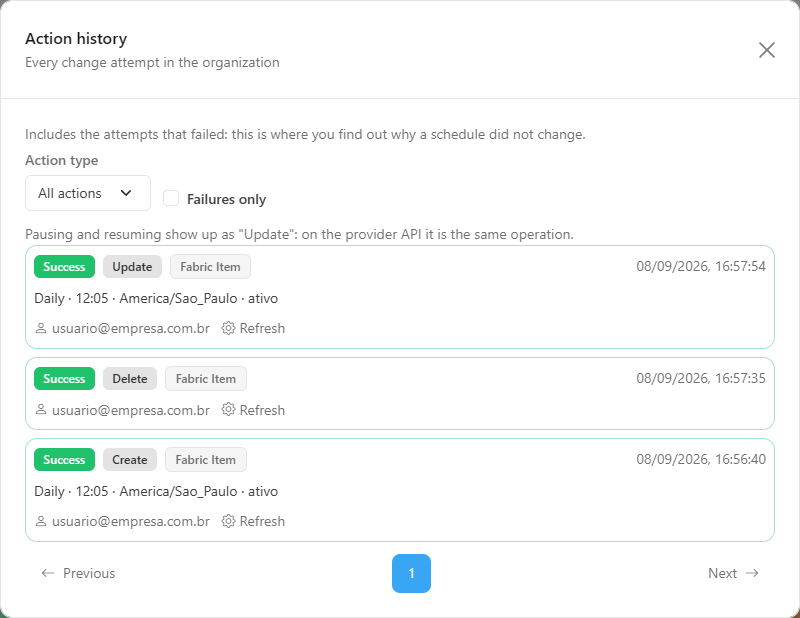
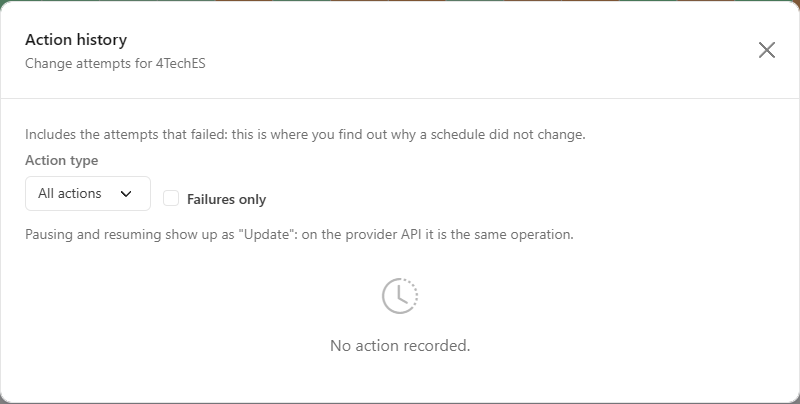
**What it is:** the **Action history** button, in the action bar, opens a window with **all attempts** to create, change and delete schedules made through Power Monitor in the organization, **including those that failed**. The same history, filtered by one entity, opens from the **View this entity's history** clock icon on each table row.

**What it is for:** auditing who changed what and when, and finding out **why a schedule did not change**: the Power BI/Fabric error message and code are recorded.

<figure><picture><source srcset="/files/D3W2i9DYAV6xQCAoA4wF" media="(prefers-color-scheme: dark)"><img src="https://3938213054-files.gitbook.io/~/files/v0/b/gitbook-x-prod.appspot.com/o/spaces%2FH2bFRBmIfyK3kwVKbldl%2Fuploads%2Fgit-blob-4303db5ca59bf537f857074885b5b88164815929%2Fpm-governanca-agendamentos-barra-acoes-en.png?alt=media" alt="Action bar with the Action history and Timeline buttons"></picture><figcaption><p>Action bar</p></figcaption></figure>

<figure><picture><source srcset="/files/SB5iiuJ08ZGjeCamYIvc" media="(prefers-color-scheme: dark)"><img src="https://3938213054-files.gitbook.io/~/files/v0/b/gitbook-x-prod.appspot.com/o/spaces%2FH2bFRBmIfyK3kwVKbldl%2Fuploads%2Fgit-blob-3d71a8a99edd30c966ddc53c01ae0d940aa254c2%2Fpm-governanca-agendamentos-historico-acoes-en.png?alt=media" alt="Schedule Action history window"></picture><figcaption><p>Organization action history, including failed attempts</p></figcaption></figure>

<figure><picture><source srcset="/files/SZcvBp35lARaFqiEDh04" media="(prefers-color-scheme: dark)"><img src="https://3938213054-files.gitbook.io/~/files/v0/b/gitbook-x-prod.appspot.com/o/spaces%2FH2bFRBmIfyK3kwVKbldl%2Fuploads%2Fgit-blob-c54c87e153fdc4a9fe3015599f4a65cb64a98cc1%2Fpm-governanca-agendamentos-historico-entidade-en.png?alt=media" alt="Action history filtered by one entity"></picture><figcaption><p>History of one entity (row clock icon)</p></figcaption></figure>

**How to use:**

1. Click **Action history** (whole organization) or the **View this entity's history** clock icon on a row (the subtitle becomes *Change attempts for "entity"*).
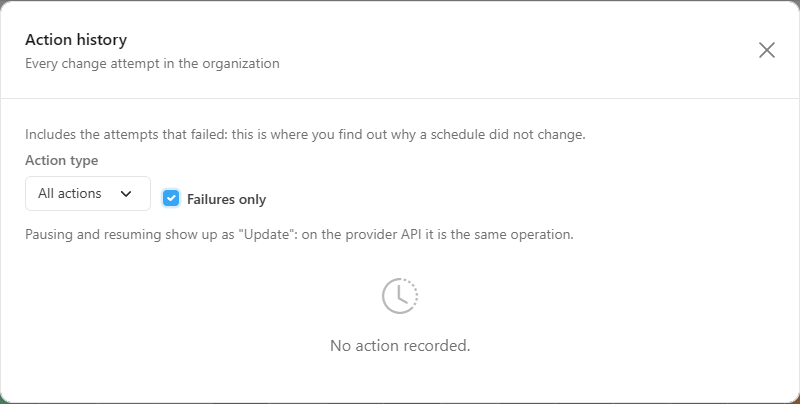
2. Filter by **Action type** (**All actions**, **Create**, **Update** or **Delete**) and check **Failures only** to see only the rejected attempts.
3. Read each record:
   * **Success** (green) or **Failure** (red) badge, action type and source (**Semantic Model** or **Fabric Item**);
   * date and time of the attempt;
   * summary of what was sent;
   * for failures, the provider's error message;
   * who performed it, the job type and, when applicable, the error code.
4. Use the pagination and the **Items per page** selector in the footer to see older records and close with the **X** (**Close history**) or by clicking outside the window.

<figure><picture><source srcset="/files/mjYOsdMAfPnditiECncp" media="(prefers-color-scheme: dark)"><img src="https://3938213054-files.gitbook.io/~/files/v0/b/gitbook-x-prod.appspot.com/o/spaces%2FH2bFRBmIfyK3kwVKbldl%2Fuploads%2Fgit-blob-4670d05aa2acb7cfa0c1f27da22e25fbce9e235a%2Fpm-governanca-agendamentos-historico-somente-falhas-en.png?alt=media" alt="Action history with the Failures only option checked"></picture><figcaption><p>History filtered by Failures only</p></figcaption></figure>

**How it works:** the history is read-only and available to all profiles. **Pausing and resuming appear as "Update"**, because on the provider's API they are the same operation. Changes made directly in Power BI/Fabric, outside Power Monitor, do not appear here.

### Collection

**What it is:** the **Collection** line, right above the action bar, which shows the status of the last schedule collection run (*last run on \[date]*, *running since \[date]*, *last run on \[date], failed* or *no run recorded*). For Administrators, it includes the **View/manage collection →** link.

**What it is for:** knowing whether the schedules shown are recent and going straight to the page that triggers the collection, for example right after creating or changing schedules directly in Power BI/Fabric, or when the organization has just been enabled and the first collection has not yet run.

**How to use:**

1. Click **View/manage collection →** (the same access appears in the empty table *"No schedule collected yet."*, for Administrators).
2. In [Mapping › Refreshes and Schedules](/en/power-monitor/mapeamento/atualizacoes-e-agendamentos.md), click **Run now** on the **Fabric Item Schedule** scan row.
3. When the run finishes, come back to this screen and reload the page.

**How it works:** only **Administrators** see the link and open the Mapping page; other profiles see only the status. The collection runs in the background, with the organization's Service Principal. This screen no longer has the collection button: it is on the Mapping page.

### Timeline

**What it is:** the **Timeline** button opens the **Refresh Execution Timeline** (*Governance › Operations › Schedules › Timeline*).

**What it is for:** comparing the schedule **configuration** (this screen) with the **actual executions** (the timeline): for example, confirming whether a peak time on the heatmap really causes overlapping or slower refreshes.

**How to use:** click **Timeline** and follow the *Timeline* features, described further below.

### Collection coverage notice

**What it is:** when, in the last collection, the organization's Service Principal did not have access to all monitored workspaces, the screen displays the yellow notice **"The collection did not cover every workspace"**, with how many workspaces are accessible, how many items were not read and the **Grant access to the service principal** button.

**What it is for:** avoiding the wrong conclusion that an item has no schedule. In this scenario, **there may be schedules that the screen does not show**.

<figure><picture><source srcset="/files/SPTeQJ4tqfo4t99bN8Ta" media="(prefers-color-scheme: dark)"><img src="https://3938213054-files.gitbook.io/~/files/v0/b/gitbook-x-prod.appspot.com/o/spaces%2FH2bFRBmIfyK3kwVKbldl%2Fuploads%2Fgit-blob-6f5099d5a5c547c3ccfe46995ece2481b64beae9%2Fpm-governanca-agendamentos-aviso-cobertura-en.png?alt=media" alt="The collection did not cover every workspace notice with the Grant access to the service principal button"></picture><figcaption><p>Incomplete coverage notice</p></figcaption></figure>

**How to use:**

1. Click **Show the N workspaces without access** to list the workspaces the Service Principal cannot see (**Hide the list** collapses it).
2. Click **Grant access to the service principal** to open the product's permission flow (the same as in [Workspaces](/en/power-monitor/governanca/workspaces.md)), or grant access manually on each workspace in Power BI/Fabric.
3. After granting access, an administrator clicks **Run now** in [Mapping › Refreshes and Schedules](/en/power-monitor/mapeamento/atualizacoes-e-agendamentos.md) and then reloads this screen.
4. To hide the notice for this visit, click the **X** (**Dismiss the warning**).

**How it works:** the notice disappears on its own when a collection covers all monitored workspaces. When Power Monitor could not verify which workspaces the Service Principal can see, another notice appears, in gray, stating that the collection swept all workspaces and that the coverage numbers for that cycle are not reliable. In the table rows, a yellow shield icon marks items from workspaces without access.

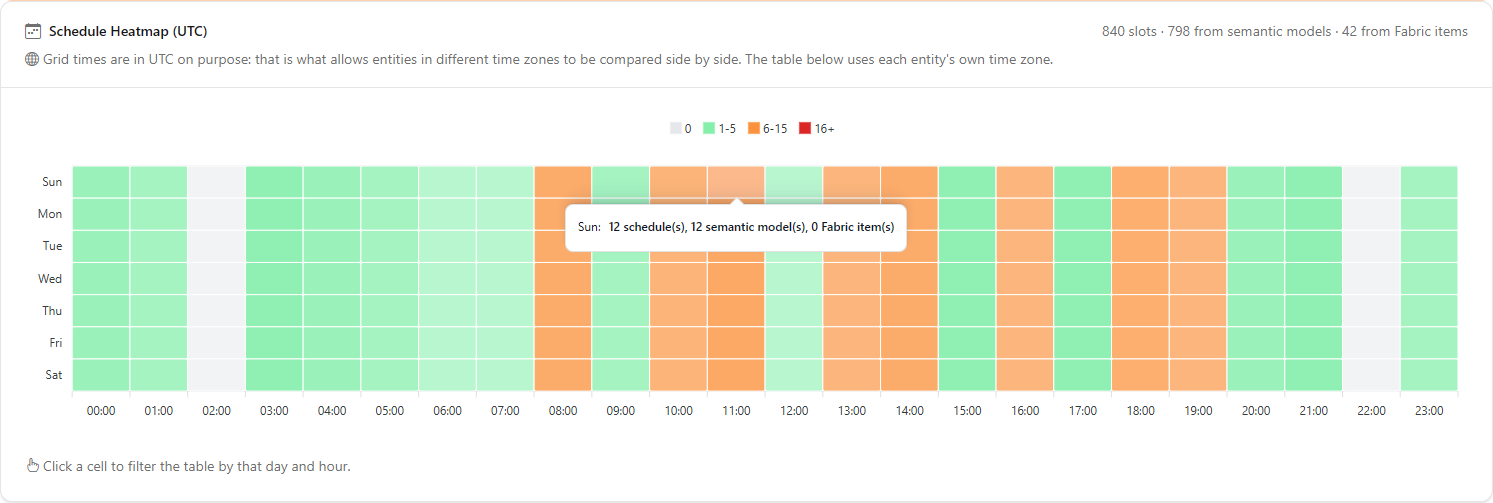
### Schedule Heatmap (UTC)

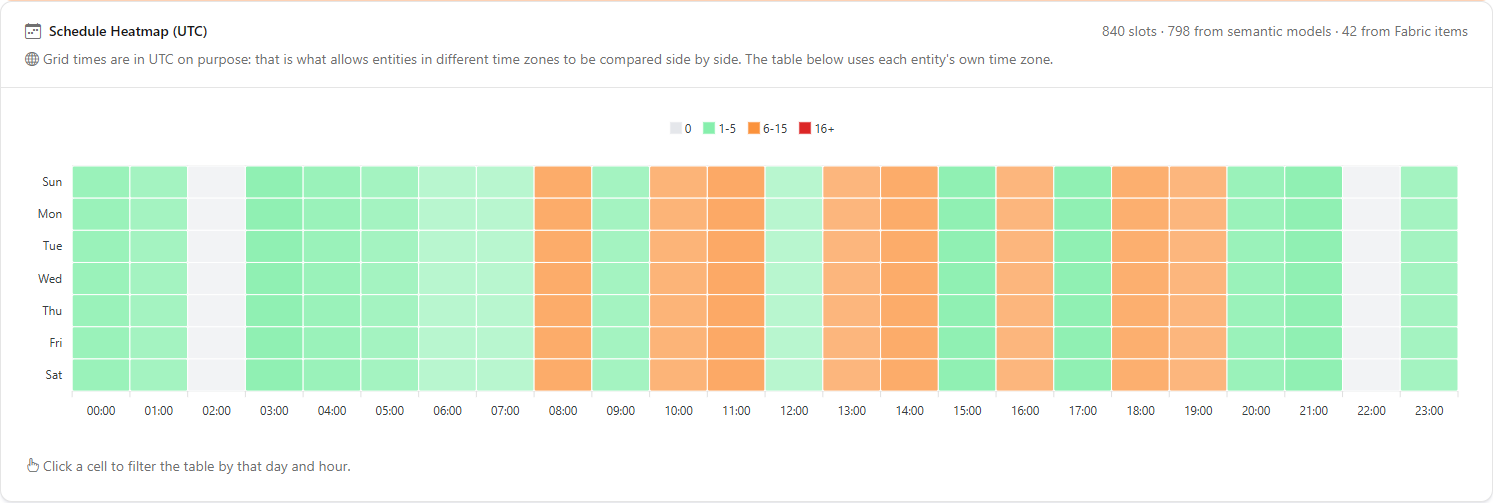
**What it is:** a grid of **days of the week × hours of the day (00:00 to 23:00)**. Each cell shows how many scheduled triggers fall on that day and hour. The card header shows the total *slots* (triggers), split between semantic models and Fabric items: for example, *"120 slots · 80 from semantic models · 40 from Fabric items"*.

**What it is for:** seeing at a glance the peak times, when many refreshes and jobs compete for the same capacity, and the idle times to which it is worth moving schedules.

<figure><picture><source srcset="/files/VyPQ918ppCGhBUDFqCU0" media="(prefers-color-scheme: dark)"><img src="https://3938213054-files.gitbook.io/~/files/v0/b/gitbook-x-prod.appspot.com/o/spaces%2FH2bFRBmIfyK3kwVKbldl%2Fuploads%2Fgit-blob-e4f0bc38c1799bb683f47c04f9f29894f0a51fba%2Fpm-governanca-agendamentos-mapa-de-calor-en.png?alt=media" alt="Schedule heatmap by day of the week and UTC hour"></picture><figcaption><p>Heatmap: concentration of triggers by day and hour (UTC)</p></figcaption></figure>

**How to use:**

1. Locate the hottest cells. The colors follow the number of triggers in the cell:

   | Color  | Triggers in the cell |
   | ------ | -------------------- |
   | Gray   | None                 |
   | Green  | 1 to 5               |
   | Orange | 6 to 15              |
   | Red    | 16 or more           |
2. Hover over a cell to see the breakdown, for example *"12 schedule(s), 9 semantic model(s), 3 Fabric item(s)"* (or *"No schedules"*).
3. Click the cell to list in the table who fires there (see the next feature).

<figure><picture><source srcset="/files/74BHhaqc9MbxFhayRa0X" media="(prefers-color-scheme: dark)"><img src="https://3938213054-files.gitbook.io/~/files/v0/b/gitbook-x-prod.appspot.com/o/spaces%2FH2bFRBmIfyK3kwVKbldl%2Fuploads%2Fgit-blob-d6116c3596722c32603ddfb8c147da138c9610f3%2Fpm-governanca-agendamentos-mapa-de-calor-tooltip-en.png?alt=media" alt="Tooltip of a heatmap cell with the total schedules, semantic models and Fabric items"></picture><figcaption><p>Cell breakdown on hover</p></figcaption></figure>

**How it works:**

* **The grid times are in UTC**, on purpose: this is what allows entities configured in different time zones to be compared side by side. A schedule at 08:00 Brasília time (UTC-3) appears in the 11:00 column.
* **Interval** schedules (every N minutes/hours) occupy all the hours in which they fire.
* The grid respects the **Workspace**, **Capacity**, **Item type** and **State** filters, but not **Search**.

### Filtering the table by day and hour

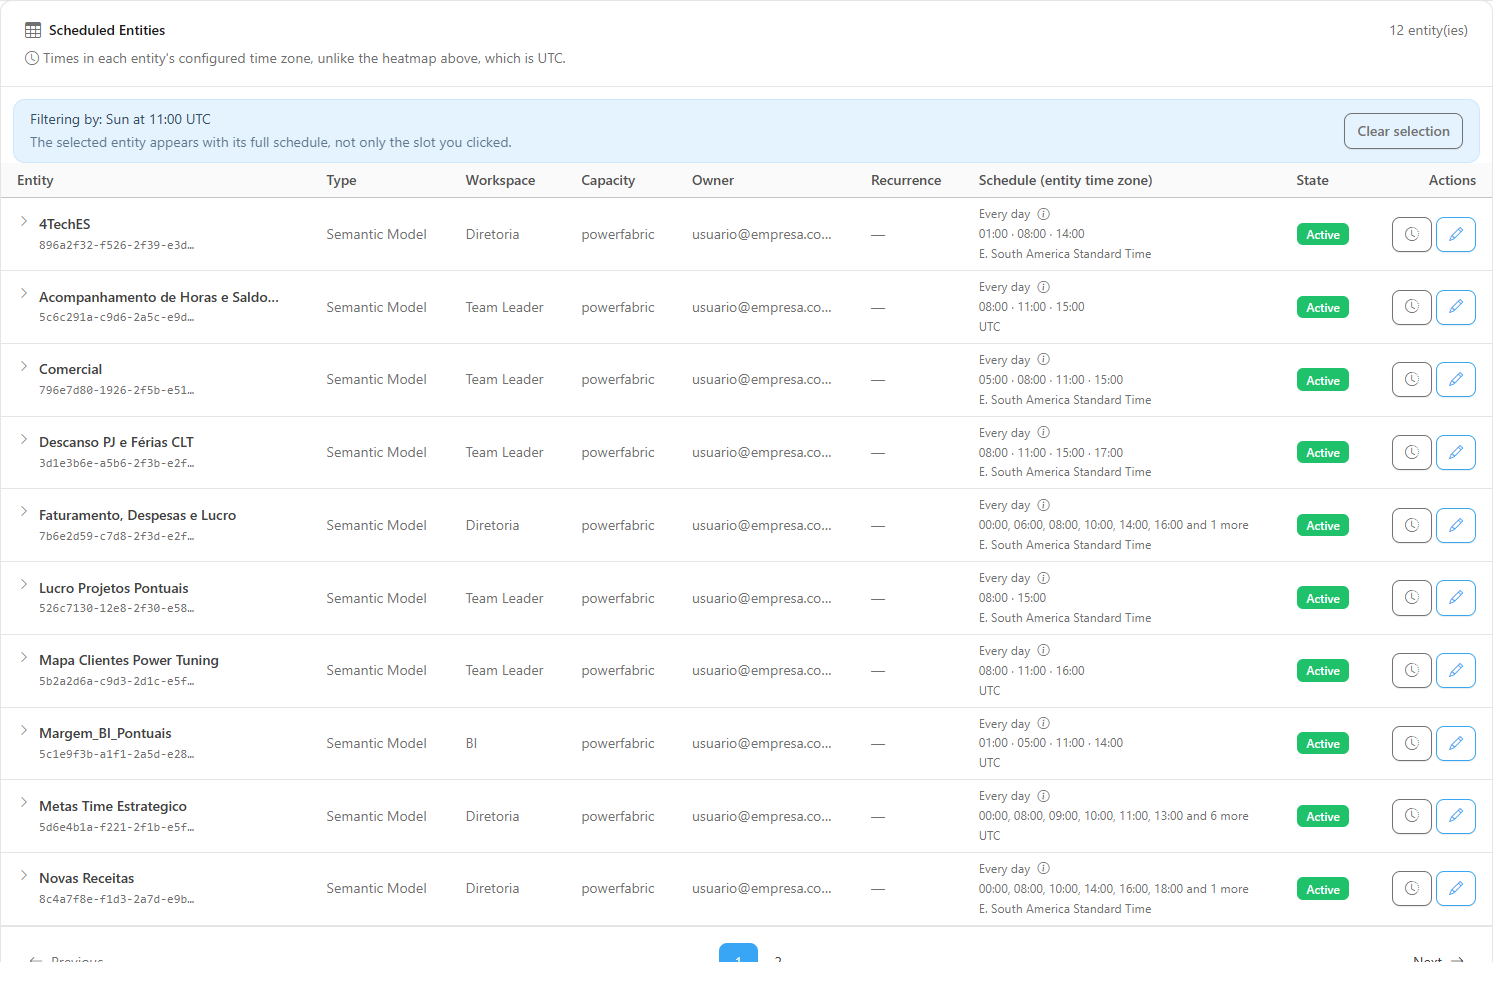
**What it is:** when you click a heatmap cell, the table shows only the entities that fire on that UTC day and hour, with the notice **"Filtering by:&#x20;*****day*****&#x20;at&#x20;*****hour*****&#x20;UTC"**.

**What it is for:** answering "who fires on Monday at 11:00 UTC?": the first step to relieving a peak time.

<figure><picture><source srcset="/files/c3faQoTCyDYvFPS5RYyB" media="(prefers-color-scheme: dark)"><img src="https://3938213054-files.gitbook.io/~/files/v0/b/gitbook-x-prod.appspot.com/o/spaces%2FH2bFRBmIfyK3kwVKbldl%2Fuploads%2Fgit-blob-d75c29d58e6766847a058b40e75979620cd79ea6%2Fpm-governanca-agendamentos-celula-selecionada-en.png?alt=media" alt="Scheduled Entities table filtered by a day and hour, with the Clear selection button"></picture><figcaption><p>Table filtered by the cell selected in the heatmap</p></figcaption></figure>

**How to use:**

1. Click the desired cell in the **Schedule Heatmap (UTC)**.
2. Check the entities found in the **Scheduled Entities** table.
3. Click **Clear selection** (or **Clear filters**) to return to the full list.

**How it works:** the selection filters **only the table**: the grid still shows the whole week. Each entity found appears with its **full schedule**, not just the clicked time, so you can see all its triggers before deciding what to move.

### Monthly schedules notice

**What it is:** the blue notice *"N monthly schedule(s) are not on the grid…"*, displayed below the heatmap when there are schedules with monthly recurrence.

**What it is for:** making it clear that these schedules have not disappeared: they simply have no fixed day of the week and therefore do not fit in the grid.

**How to use:** read the number in the notice and look for these schedules in the table, where the entity shows the **N monthly** badge and the day appears as **Monthly (no day of week)**.

### Scheduled Entities table

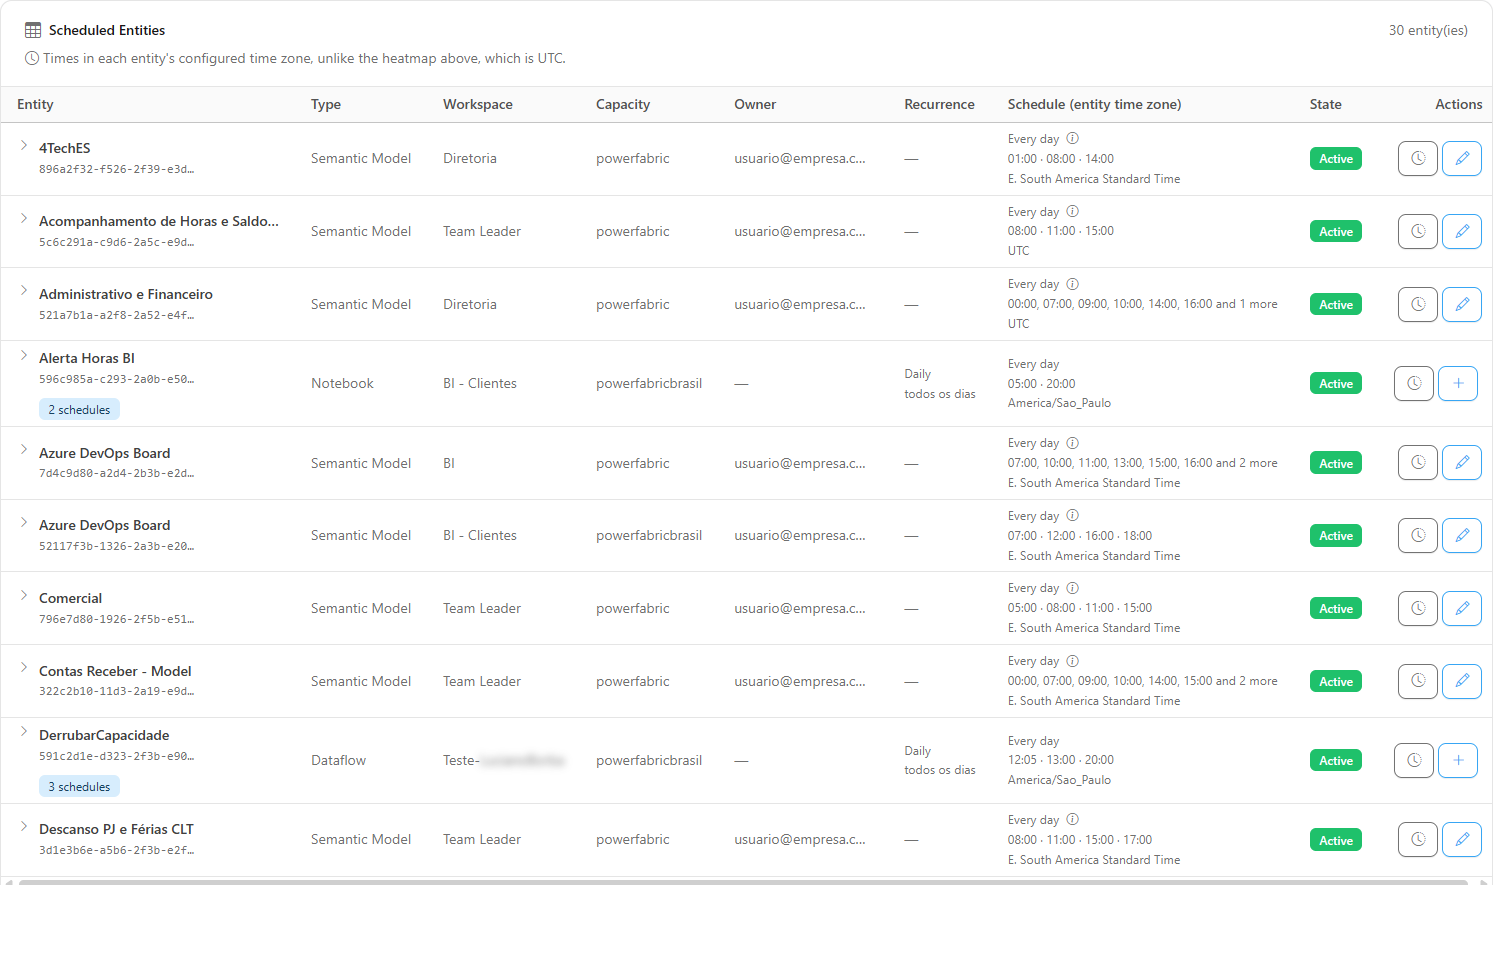
**What it is:** the list of entities (semantic models and Fabric items) that have at least one collected schedule, with the total number of entities in the header (*"N entity(ies)"*). **The table times are in the time zone configured for each entity**, unlike the heatmap.

**What it is for:** seeing, entity by entity, the configured schedule, the owner and the state, and acting on each schedule.

<figure><picture><source srcset="/files/XHpXiFvPeCaGhu3l3ZJD" media="(prefers-color-scheme: dark)"><img src="https://3938213054-files.gitbook.io/~/files/v0/b/gitbook-x-prod.appspot.com/o/spaces%2FH2bFRBmIfyK3kwVKbldl%2Fuploads%2Fgit-blob-6e9a0d9d447bf467a04250ab9a787d7cd14b212f%2Fpm-governanca-agendamentos-tabela-en.png?alt=media" alt="Scheduled Entities table with columns, state badges and action buttons"></picture><figcaption><p>Scheduled Entities table</p></figcaption></figure>

**How to use:** read the columns:

| Column                          | Description                                                                                                                                                                                                                                                                          |
| ------------------------------- | ------------------------------------------------------------------------------------------------------------------------------------------------------------------------------------------------------------------------------------------------------------------------------------ |
| **Entity**                      | Name of the semantic model or Fabric item and, below it, the ID. Badges and icons indicate special situations (see the next feature)                                                                                                                                                 |
| **Type**                        | **Semantic Model** or the Fabric item type (DataPipeline, CopyJob, Notebook, Dataflow)                                                                                                                                                                                               |
| **Workspace**                   | Entity's workspace                                                                                                                                                                                                                                                                   |
| **Capacity**                    | Workspace's capacity                                                                                                                                                                                                                                                                 |
| **Owner**                       | Owner of the schedule/entity. With **Hide data** on, the name is masked                                                                                                                                                                                                              |
| **Recurrence**                  | **Interval (cron)**, **Daily**, **Weekly** or **Monthly**, with the recurrence detail below (for example, the interval). It is empty when the item mixes schedules of different types                                                                                                |
| **Schedule (entity time zone)** | Trigger days (or **Every day**), times (up to six; beyond that, *"… and N more"*; intervals appear as *"Every N minutes/hours"*) and the time zone. Hover over the time zone to see *"Configured: … · Resolved: …"* when the configured time zone differs from the one actually used |
| **State**                       | **Active**, **Paused** or **Partial**                                                                                                                                                                                                                                                |
| **Actions**                     | Row buttons (see *Row actions*, below)                                                                                                                                                                                                                                               |

The table is paginated, with **10** entities per page by default; use the pagination and the **Items per page** selector (10, 25, 50 or 100) in the footer. Changing the page size returns to the first page and keeps the filters and the slot selected on the heat map.

**How it works:** only entities **with a schedule** appear. To create the **first** schedule for a Fabric item, use the **Schedules** tab of the item details modal in [Data Engineering](/en/power-monitor/governanca/dados-e-engenharia/engenharia-de-dados.md).

### Entity badges and icons

**What it is:** markers displayed next to the ID, in the **Entity** column:

| Marker                                | Meaning                                                                                                            |
| ------------------------------------- | ------------------------------------------------------------------------------------------------------------------ |
| **N schedules** badge (blue)          | The Fabric item has more than one schedule. Expand the row to view, edit or delete each one                        |
| **N monthly** badge (gray)            | The entity has monthly schedules, which do not appear on the heatmap                                               |
| **Scissors** icon (yellow)            | *"Very large schedule"*: the list shown is only part of the actual total of triggers                               |
| **Shield** icon (yellow)              | The Service Principal has no access to the item's workspace; a schedule cannot be created for it                   |
| **Information** icon next to the days | This source stores only the day in UTC; the day shown may differ from the local day when the time crosses midnight |

**What it is for:** drawing attention to situations that change how the row should be read (incomplete schedule, schedules outside the grid, lack of access).

**How to use:** hover over the badge or icon to read the full explanation.

### State column: Active, Paused and Partial

**What it is:** each entity's state badge: **Active** (green), **Paused** (gray) or **Partial** (yellow).

**What it is for:** identifying schedules that will not fire (paused) or that fire only at some of their times.

**How to use:** read the badge in the **State** column. For the detail per time, expand the row: each time in the full schedule has its own badge.

**How it works:** **Active** when all of the entity's times are active, **Paused** when all are paused, and **Partial** when some are paused: for example, an item with two schedules, one active and one paused. Paused schedules only appear in the list when the **State** filter includes them.

### Full schedule (expanded row)

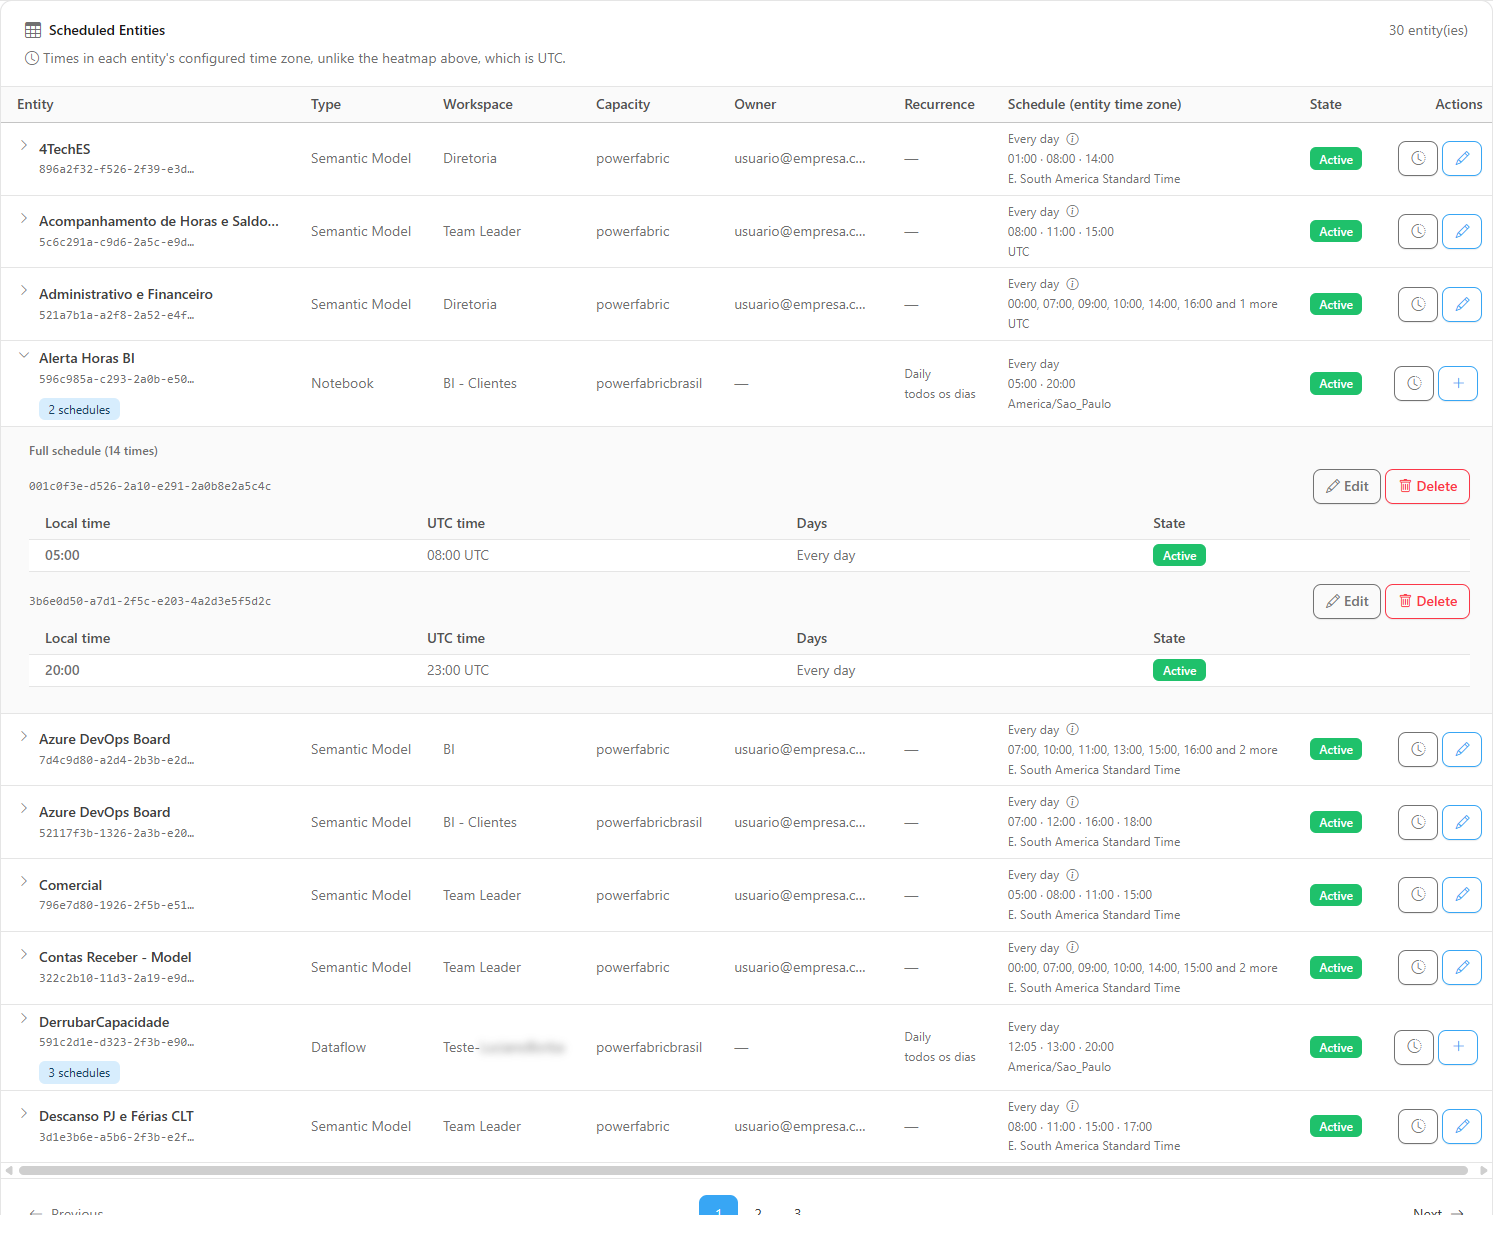
**What it is:** the arrow next to the entity name (**Show the N times**, or **View the N schedules** when the item has more than one) expands the row and shows the **Full schedule (N times)**.

**What it is for:** seeing all of the entity's triggers with the local time and the UTC time side by side, and reaching the **Edit** and **Delete** buttons for each Fabric item schedule.

<figure><picture><source srcset="/files/KYDjmuNdljglaMG2uJNr" media="(prefers-color-scheme: dark)"><img src="https://3938213054-files.gitbook.io/~/files/v0/b/gitbook-x-prod.appspot.com/o/spaces%2FH2bFRBmIfyK3kwVKbldl%2Fuploads%2Fgit-blob-c7bad347b5d18900fc6f3a52b6b5ed7cd138de59%2Fpm-governanca-agendamentos-agenda-completa-en.png?alt=media" alt="Expanded row with the full schedule: local time, UTC time, days and state, and the Edit and Delete buttons"></picture><figcaption><p>Full schedule of a Fabric item</p></figcaption></figure>

**How to use:**

1. Click the arrow next to the entity name.
2. For each schedule (identified by its ID; for semantic models, **Refresh schedule**), read the table **Local time**, **UTC time**, **Days** and **State**. Interval schedules appear as a summary: *"Every N minutes"*, the days covered (or *"From … to …"*, when the validity window is shorter than a day) and the state.
3. On Fabric items, Administrators see **Edit** and **Delete** next to the ID of each schedule.
4. Click the arrow again (**Hide times**) to collapse.

**How it works:** when you change page or filter, the expanded rows collapse again.

### Row actions

**What it is:** the icon buttons in the **Actions** column (the name of each one appears on hover):

| Button                                | Who sees it                     | What it does                                        |
| ------------------------------------- | ------------------------------- | --------------------------------------------------- |
| Clock: **View this entity's history** | Everyone                        | Opens the **Action history** filtered by the entity |
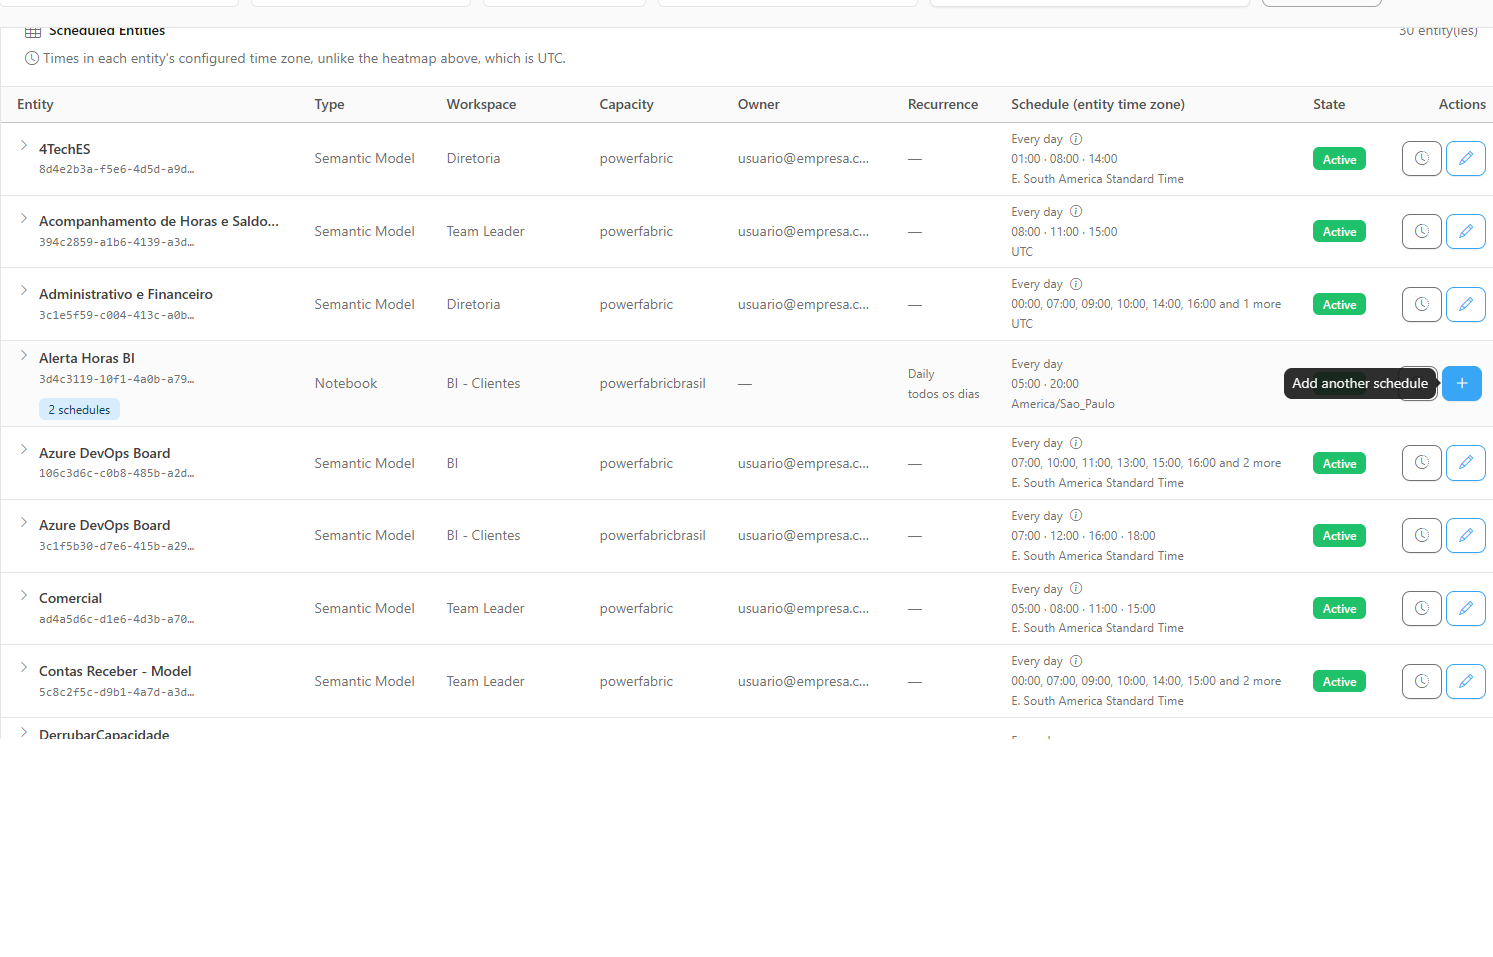
| **+**: **Add another schedule**       | Administrators, Fabric items    | Opens the **Add schedule** form                     |
| Pencil: **Edit refresh schedule**     | Administrators, semantic models | Opens the model's refresh schedule form             |

**What it is for:** acting on the entity without leaving the row.

<figure><picture><source srcset="/files/76yQtkdeTQKvrJMtezkp" media="(prefers-color-scheme: dark)"><img src="https://3938213054-files.gitbook.io/~/files/v0/b/gitbook-x-prod.appspot.com/o/spaces%2FH2bFRBmIfyK3kwVKbldl%2Fuploads%2Fgit-blob-4bbb4f757cc87ec4f5bba25f630b983a0a69816b%2Fpm-governanca-agendamentos-acao-adicionar-en.png?alt=media" alt="Add another schedule tooltip over the + button in the Actions column"></picture><figcaption><p>Add another schedule button</p></figcaption></figure>

**How to use:** hover over the button to confirm the action and click it.

**How it works:** the **+** is **disabled** when a schedule cannot be created for the item; the reason appears in the tooltip: for example, *"The service principal has no access to this item's workspace. Grant access to be able to create the schedule."*, an item with no identified workspace, or an item type that does not support scheduling through the Fabric API.

### Add another schedule (Fabric item)

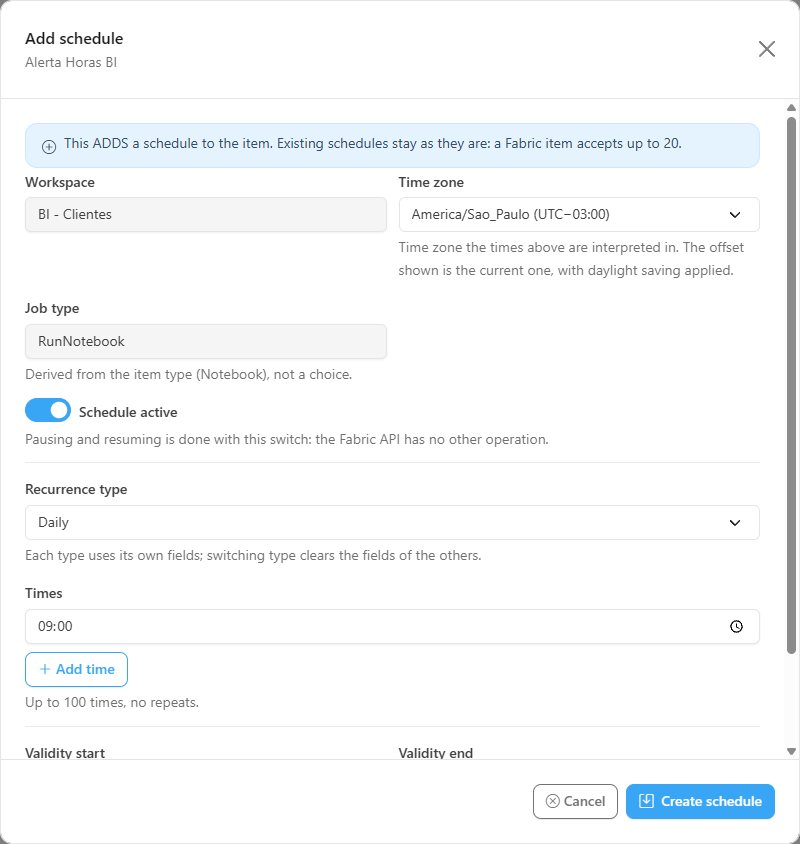
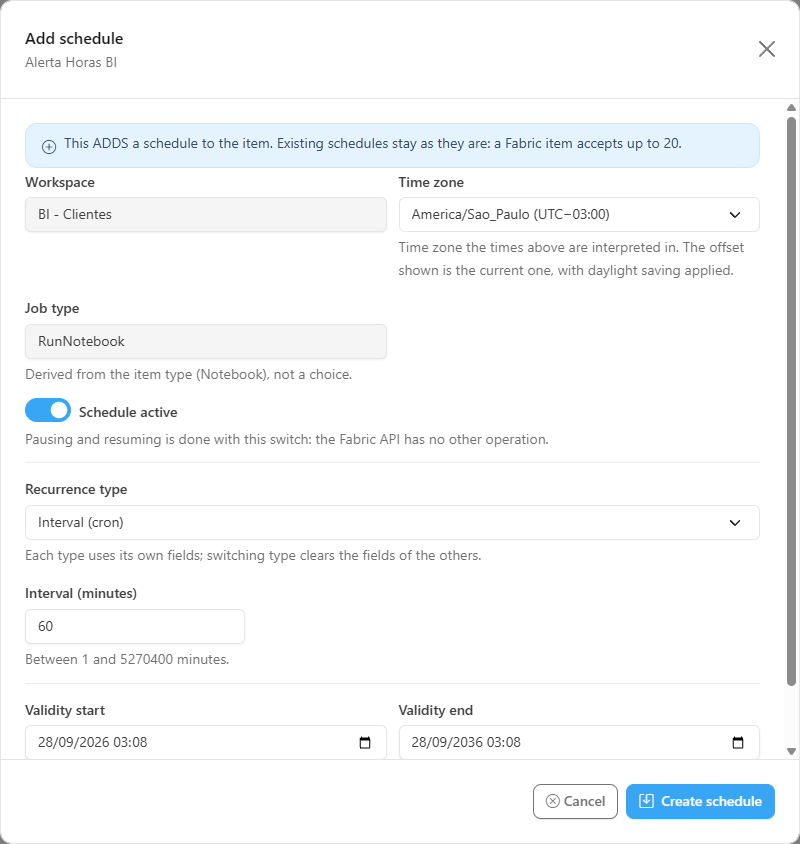
**What it is:** the **Add schedule** form, opened by the row's **+**, which **adds** a schedule to a Data Pipeline, Copy Job, Notebook or Dataflow that already has a schedule.

**What it is for:** creating a second time with a different rule (for example, a daily load at 06:00 and another weekly one on Sundays) without touching the existing schedules.

<figure><picture><source srcset="/files/D1t691HdBOW86eprEJ6D" media="(prefers-color-scheme: dark)"><img src="https://3938213054-files.gitbook.io/~/files/v0/b/gitbook-x-prod.appspot.com/o/spaces%2FH2bFRBmIfyK3kwVKbldl%2Fuploads%2Fgit-blob-0ad5248931c48336755920e60e07f04e479e4556%2Fpm-governanca-agendamentos-form-adicionar-en.png?alt=media" alt="Add schedule form with time zone, job type, Schedule active switch, Daily recurrence and validity"></picture><figcaption><p>Add schedule form</p></figcaption></figure>

**How to use:**

{% stepper %}
{% step %}

#### Open the form

On the item's row, click the **+** (**Add another schedule**). The modal shows the notice that the schedule will be **added** and that a Fabric item accepts up to 20 schedules.
{% endstep %}

{% step %}

#### Fill in the general fields

Check the **Workspace** (read-only) and choose the **Time zone** in which the times will be interpreted. The **Job type** is filled in automatically from the item type. Leave the switch on **Schedule active** or change it to **Schedule paused** to create it already paused.
{% endstep %}

{% step %}

#### Define the recurrence

Choose the **Recurrence type** and fill in its fields (see *Form recurrence types*, below). The form comes preset to **Daily** at 09:00.
{% endstep %}

{% step %}

#### Adjust the validity

Check **Validity start** and **Validity end** (both are required). The default is from now until 10 years from now.
{% endstep %}

{% step %}

#### Create

Click **Create schedule**. The modal closes, the table reloads and the item starts showing the **N schedules** badge. To give up, click **Cancel**.
{% endstep %}
{% endstepper %}

**How it works:**

* Requires the **Administrator** profile and Service Principal access to the item's workspace.
* Each Fabric item accepts **up to 20 schedules**. Beyond that, Fabric rejects the creation and the form instructs you to delete a schedule before creating another.
* Input errors appear at the top of the modal under **Fix before saving** (for example, *"There are repeated times."* or *"The validity end must be later than the start."*). Rejections from Power BI/Fabric appear under **The server rejected the change**, with the provider's message.

### Form recurrence types

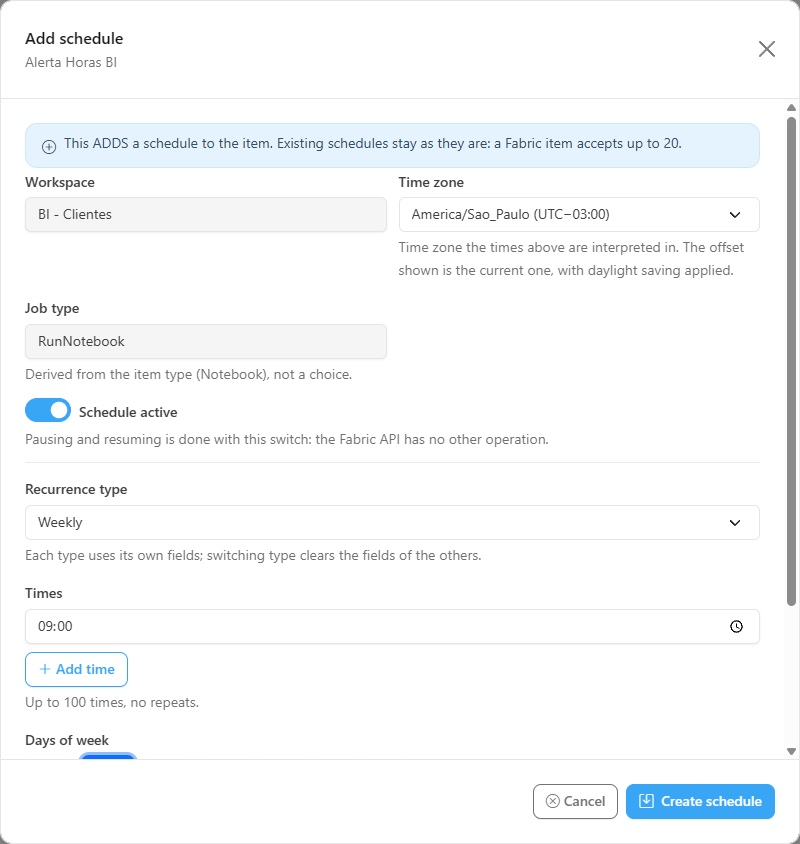
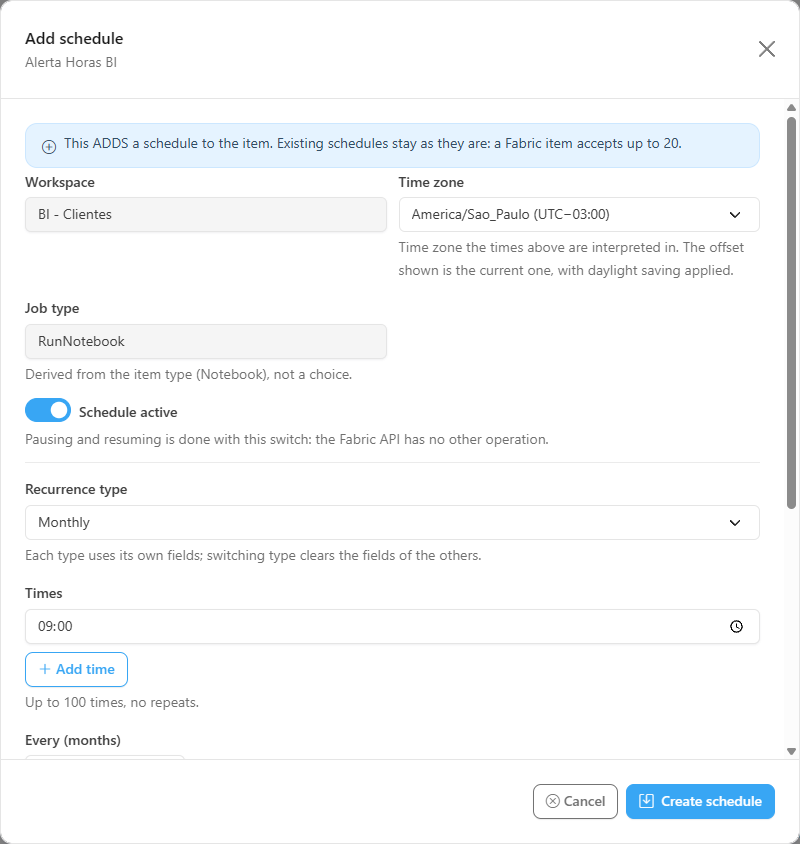
**What it is:** the **Recurrence type** field in the Fabric item forms, with four options, each with its own fields.

**What it is for:** reproducing any schedule supported by Fabric: every N minutes, every day, on days of the week or once a month.

<figure><picture><source srcset="/files/3YAep916irvuhxl9rZjQ" media="(prefers-color-scheme: dark)"><img src="https://3938213054-files.gitbook.io/~/files/v0/b/gitbook-x-prod.appspot.com/o/spaces%2FH2bFRBmIfyK3kwVKbldl%2Fuploads%2Fgit-blob-94dbbdd856010a0df0ddfaf4812965c271662bc2%2Fpm-governanca-agendamentos-form-semanal-en.png?alt=media" alt="Form with Weekly recurrence: days of week and times"></picture><figcaption><p>Weekly recurrence</p></figcaption></figure>

<figure><picture><source srcset="/files/IeP7gVM00alQIsvH9XT4" media="(prefers-color-scheme: dark)"><img src="https://3938213054-files.gitbook.io/~/files/v0/b/gitbook-x-prod.appspot.com/o/spaces%2FH2bFRBmIfyK3kwVKbldl%2Fuploads%2Fgit-blob-f77d1d028fdb733207c64ccd46ce7ccaec1d8282%2Fpm-governanca-agendamentos-form-mensal-en.png?alt=media" alt="Form with Monthly recurrence: Every (months), How the day is chosen and times"></picture><figcaption><p>Monthly recurrence</p></figcaption></figure>

<figure><picture><source srcset="/files/5971EQ7oDiaANF3kQ8lE" media="(prefers-color-scheme: dark)"><img src="https://3938213054-files.gitbook.io/~/files/v0/b/gitbook-x-prod.appspot.com/o/spaces%2FH2bFRBmIfyK3kwVKbldl%2Fuploads%2Fgit-blob-754f8cabd15121fe2499276aa8742b84f4965021%2Fpm-governanca-agendamentos-form-intervalo-en.png?alt=media" alt="Form with Interval (cron) recurrence: Interval (minutes)"></picture><figcaption><p>Interval (cron) recurrence</p></figcaption></figure>

**How to use:** choose the type and fill in:

| Type                | Fields                                                                                                                                                                                                                                          |
| ------------------- | ----------------------------------------------------------------------------------------------------------------------------------------------------------------------------------------------------------------------------------------------- |
| **Interval (cron)** | **Interval (minutes)**: whole number between 1 and 5,270,400                                                                                                                                                                                    |
| **Daily**           | **Times** (hh:mm): up to 100, no repeats. Use **Add time** and **Remove time**                                                                                                                                                                  |
| **Weekly**          | **Days of week** (at least one) and **Times**                                                                                                                                                                                                   |
| **Monthly**         | **Every (months)** (1 to 12); **How the day is chosen**: **Fixed day of month** (**Day of month**, 1 to 31) or **Ordinal weekday** (**Week** (First to Fifth) and **Day of week**, for example, the second Tuesday of the month); and **Times** |

**How it works:** changing the type clears the fields of the other types. A monthly schedule with no day defined never fires, so the form requires you to choose the day.

### Editing a Fabric item schedule

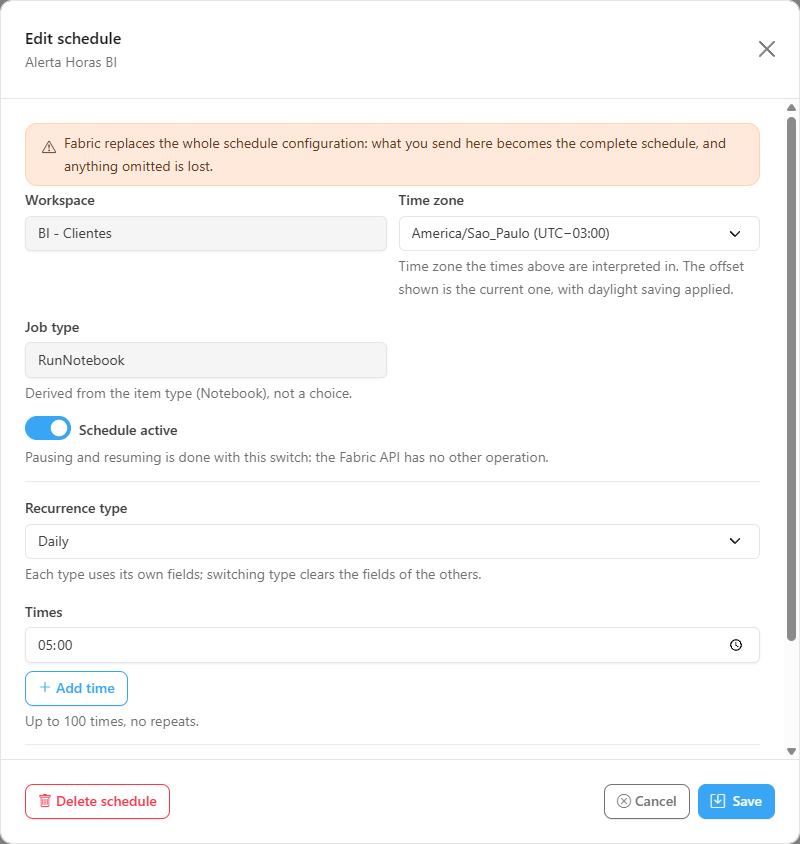
**What it is:** the **Edit schedule** form, opened by the **Edit** button of a schedule in the item's expanded row.

**What it is for:** changing the times, days, recurrence, time zone or validity of **one** of the item's schedules, without affecting the others: for example, moving a pipeline from 08:00 to 05:00 to avoid a peak.

<figure><picture><source srcset="/files/vCa1eVwRSTtKLLR2vEUw" media="(prefers-color-scheme: dark)"><img src="https://3938213054-files.gitbook.io/~/files/v0/b/gitbook-x-prod.appspot.com/o/spaces%2FH2bFRBmIfyK3kwVKbldl%2Fuploads%2Fgit-blob-d92de69a2293a460fb606d1c73f105fff2fead33%2Fpm-governanca-agendamentos-form-editar-en.png?alt=media" alt="Edit schedule form with the notice that the entire configuration is replaced"></picture><figcaption><p>Editing a Fabric item schedule</p></figcaption></figure>

**How to use:**

1. Expand the item's row and, in the block of the desired schedule (identified by its ID), click **Edit**.
2. The modal opens with the current configuration. Adjust the fields.
3. Click **Save** (or **Cancel** to give up).

**How it works:**

* Requires the **Administrator** profile.
* Editing **replaces the entire configuration** of that schedule: what you send becomes the full schedule, and anything omitted is lost. The modal reminds you of this in a yellow notice.
* When the current configuration cannot be rebuilt from the collected data, the modal warns you and shows the recorded **Current configuration**; check all fields before saving.
* The same modal has the **Delete schedule** button (see [Delete a Fabric item schedule](#delete-a-fabric-item-schedule)).

### Pausing or resuming a schedule

**What it is:** the **Schedule active / Schedule paused** switch in the forms. There is no separate pause button: in the Fabric API, pausing and resuming is this same switch.

**What it is for:** temporarily suspending triggers (for example, during data source maintenance) without losing the configuration.

**How to use:**

1. Open the schedule form: **Edit** (Fabric item, in the expanded row) or the **Edit refresh schedule** pencil (semantic model).
2. Click the switch so that it changes to **Schedule paused** (or the reverse, to resume).
3. Click **Save**.

**How it works:** requires the **Administrator** profile. The schedule starts displaying the **Paused** badge (or **Partial**, when only some of the entity's times are paused) and only appears in the list when the **State** filter includes paused schedules. In the action history, the operation appears as **Update**.

### Delete a Fabric item schedule

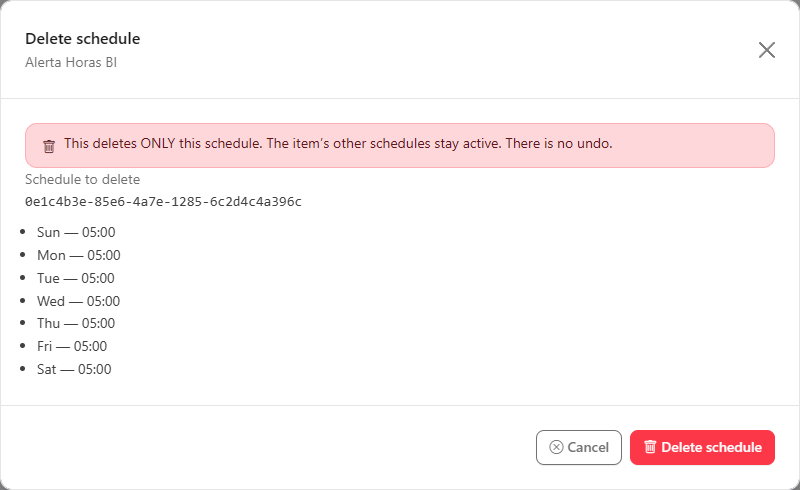
**What it is:** the **Delete** button of a schedule, in the item's expanded row, opens the **Delete schedule** modal.

**What it is for:** removing a schedule that is no longer needed, or freeing up space when the item has reached the limit of 20 schedules.

<figure><picture><source srcset="/files/lQ6FSNU4JA0uAwUYhseN" media="(prefers-color-scheme: dark)"><img src="https://3938213054-files.gitbook.io/~/files/v0/b/gitbook-x-prod.appspot.com/o/spaces%2FH2bFRBmIfyK3kwVKbldl%2Fuploads%2Fgit-blob-e0fd34d032c29eaaef81ef899f97252aaf5c3a42%2Fpm-governanca-agendamentos-form-excluir-en.png?alt=media" alt="Delete schedule modal with the notice that only this schedule is deleted and the list of times that will be removed"></picture><figcaption><p>Confirming the deletion of a schedule</p></figcaption></figure>

**How to use:**

1. Expand the item's row and, in the schedule block, click **Delete**.
2. Read the notice *"This deletes ONLY this schedule. The item's other schedules stay active. There is no undo."* and check, under **Schedule to delete**, the ID and the times that will be removed.
3. Click **Delete schedule** to confirm, or **Cancel** to give up.

It is also possible to delete from the **Edit schedule** modal: click **Delete schedule**; the modal asks **Delete permanently?** and you confirm with **Delete** or go back with **Cancel**.

**How it works:** requires the **Administrator** profile and **cannot be undone**. Semantic models do not have deletion (see the next feature).

### Editing a semantic model refresh schedule

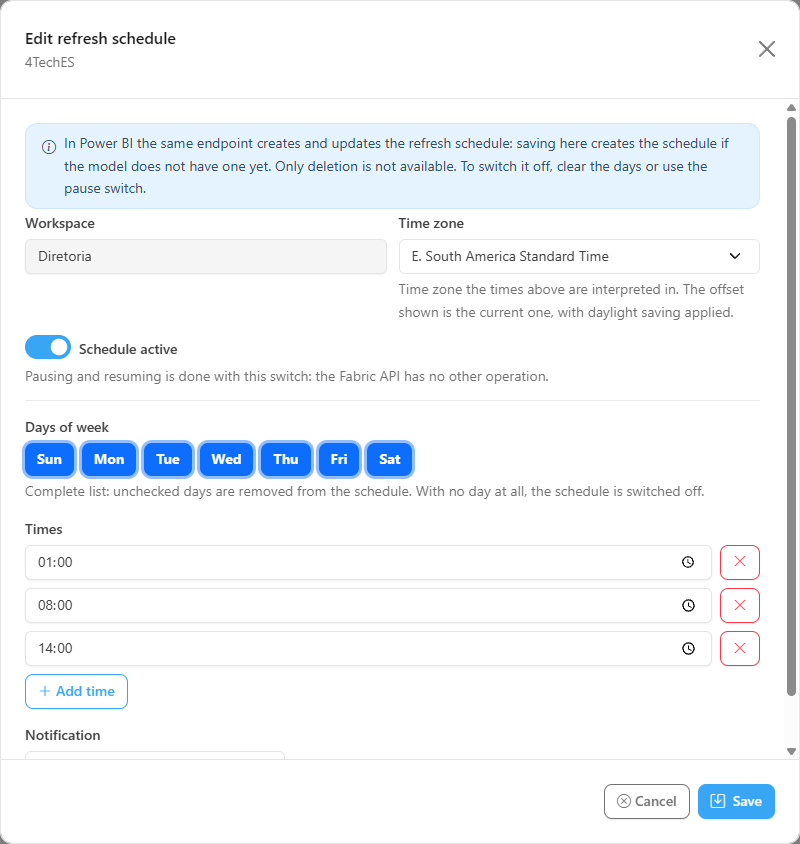
**What it is:** the **Edit refresh schedule** form, opened by the pencil on a semantic model's row.

**What it is for:** adjusting the days, times, time zone, state and notification of a semantic model's scheduled refresh without opening Power BI.

<figure><picture><source srcset="/files/EASXRqjyh8HIF0jRpoXS" media="(prefers-color-scheme: dark)"><img src="https://3938213054-files.gitbook.io/~/files/v0/b/gitbook-x-prod.appspot.com/o/spaces%2FH2bFRBmIfyK3kwVKbldl%2Fuploads%2Fgit-blob-ff77c9435aafb61c5c5101623edf44a063ab1da2%2Fpm-governanca-agendamentos-form-modelo-semantico-en.png?alt=media" alt="Edit refresh schedule form for a semantic model with days of week, times and notification"></picture><figcaption><p>Semantic model refresh schedule</p></figcaption></figure>

**How to use:**

{% stepper %}
{% step %}

#### Open the form

On the semantic model's row, click the **Edit refresh schedule** pencil.
{% endstep %}

{% step %}

#### Adjust the fields

* **Time zone** and the **Schedule active / Schedule paused** switch;
* **Days of week**: click each day to check or uncheck it;
* **Times**: use **Add time** and **Remove time**;
* **Notification**: **Keep what is configured**, **E-mail on failure** or **No notification**.
  {% endstep %}

{% step %}

#### Save

Click **Save**. The screen shows the notice that a collection was queued; after about a minute, click **Refresh now** to see the new schedule.
{% endstep %}
{% endstepper %}

**How it works:**

* Requires the **Administrator** profile.
* In Power BI each model has **one** refresh schedule, and the same command creates and changes it. There is no deletion: to turn it off, uncheck all days or pause it.
* The **Days of week** list is complete: unchecked days are removed from the schedule. With no day at all, the schedule is turned off.

### Notice after saving: Refresh now and Dismiss

**What it is:** the notice displayed at the top of the screen after a change or an on-demand collection, with the **Refresh now** and **Dismiss** buttons.

**What it is for:** stating clearly whether the screen already shows the change or whether it will still converge.

**How to use:** read the message; when it indicates that a collection was queued, wait and click **Refresh now**. Use **Dismiss** to close the notice.

**How it works:**

* **Fabric items:** Power Monitor rereads the item in Fabric right after saving, and the table and heatmap are already reloaded with the new schedule: in this case, no notice is displayed.
* When this reread is not possible (always, for **semantic models**; or, for Fabric items, due to lack of access, throttling etc.), the message *"Schedule changed. A collection was queued: the grid and the table should reflect the change in about a minute."* appears.
* If even the immediate collection cannot be queued, the (yellow) notice reports that the change only appears in the **next scheduled collection**. The change itself was saved successfully.

{% hint style="warning" %}
If Power BI/Fabric rejects a change, the form shows the provider's message. **Do not repeat the operation before applying the indicated fix**, to avoid creating a duplicate schedule.
{% endhint %}

### Timeline: execution chart

**What it is:** the **Refresh Execution Timeline** screen shows the **actual executions** of semantic model refreshes in a Gantt chart: when each refresh started, when it ended, how long it took and whether it failed. It complements the Schedules screen, which shows the recurrence **configuration**.

**What it is for:** seeing what actually ran on a day, identifying refreshes that overlap, take longer than usual or failed.

<figure><picture><source srcset="/files/V6ZPZiUD8OAyLUqxXtYE" media="(prefers-color-scheme: dark)"><img src="https://3938213054-files.gitbook.io/~/files/v0/b/gitbook-x-prod.appspot.com/o/spaces%2FH2bFRBmIfyK3kwVKbldl%2Fuploads%2Fgit-blob-854b3b8cdb6b7259929d4a0745d826efc7140f41%2Fpm-governanca-agendamentos-linha-do-tempo-en.png?alt=media" alt="Refresh Execution Timeline in Gantt format"></picture><figcaption><p>Governance › Operations › Schedules › Timeline</p></figcaption></figure>

**How to use:**

1. In *Governance › Operations › Schedules*, click **Timeline**.
2. Each row of the chart is a semantic model (label *"model · workspace"*); several executions on the same day appear as several bars on the same row.
3. Read the color of each bar:

   | Color | Result                                                 |
   | ----- | ------------------------------------------------------ |
   | Green | Updated (success)                                      |
   | Red   | Failed                                                 |
   | Blue  | **In progress**: the bar extends to the current moment |
   | Gray  | Other states (for example, cancelled)                  |

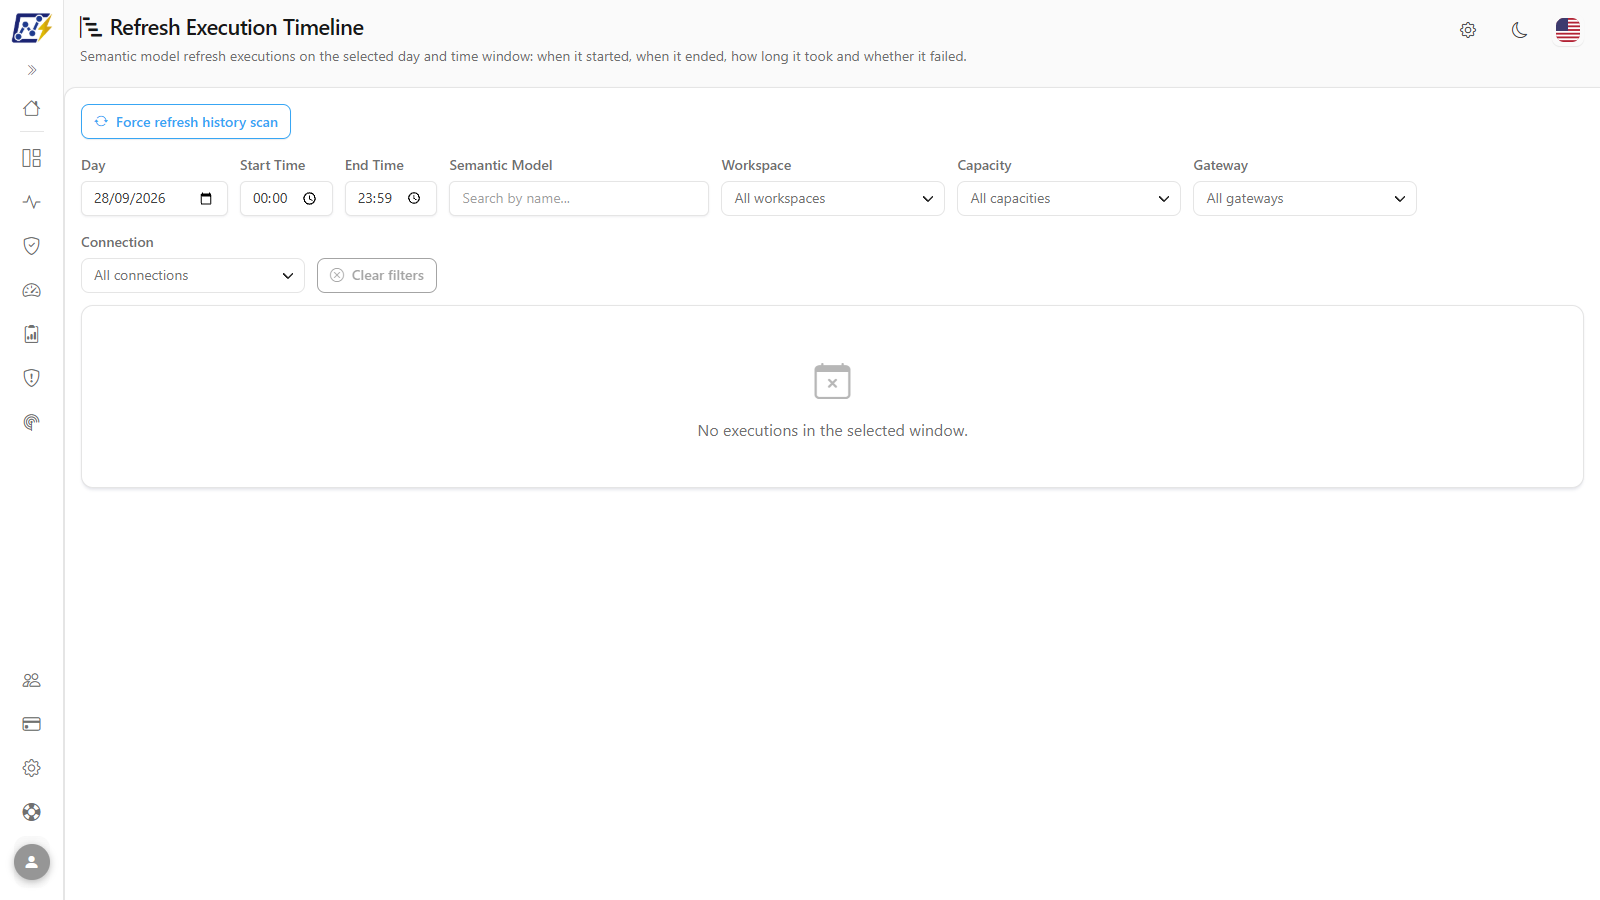
**How it works:** the time axis and tooltips use your browser's time zone. Executions with no start time are not drawn. When there are no executions in the period, the message *"No executions in the selected window."* appears.

### Timeline: day and time window

**What it is:** the **Day** (default: today), **Start Time** (default: 00:00) and **End Time** (default: 23:59) filters.

**What it is for:** focusing on a specific window: for example, the early hours of yesterday, when a load was delayed.

<figure><picture><source srcset="/files/Hp39EixsVY14cdMXrV6a" media="(prefers-color-scheme: dark)"><img src="https://3938213054-files.gitbook.io/~/files/v0/b/gitbook-x-prod.appspot.com/o/spaces%2FH2bFRBmIfyK3kwVKbldl%2Fuploads%2Fgit-blob-e242973f658b284e09c29775771c37962deba6d9%2Fpm-governanca-agendamentos-linha-do-tempo-filtros-en.png?alt=media" alt="Timeline filters: Day, Start Time, End Time, Semantic Model, Workspace, Capacity, Gateway, Connection and Clear filters"></picture><figcaption><p>Timeline filters</p></figcaption></figure>

**How to use:**

1. Choose the **Day**.
2. Adjust **Start Time** and **End Time**.
3. The chart reloads with each change.

**How it works:** the filter's day and times are interpreted in the **time zone configured for the organization**.

### Timeline: model, workspace, capacity, gateway and connection filters

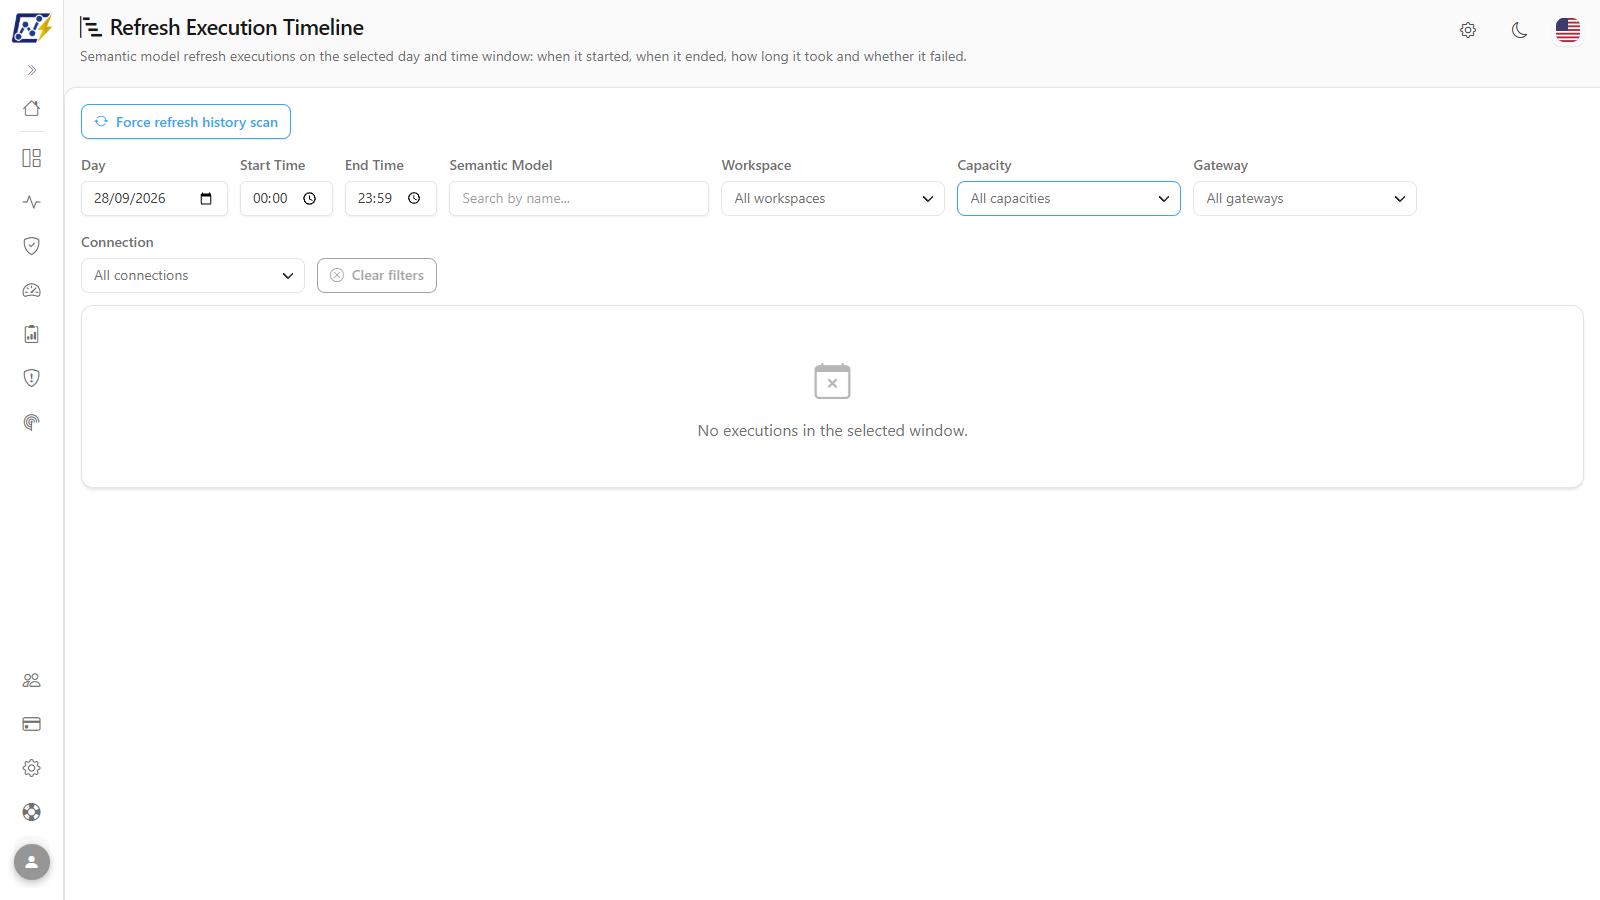
**What it is:** the **Semantic Model** (search by name), **Workspace**, **Capacity**, **Gateway** and **Connection** filters (the last four with multiple selection and search) and the **Clear filters** button.

**What it is for:** isolating the refreshes of a project, a capacity or a data source: for example, checking whether all models that read through the same gateway failed at the same time.

<figure><picture><source srcset="/files/OFM01kYRLWqyMRVpJUD8" media="(prefers-color-scheme: dark)"><img src="https://3938213054-files.gitbook.io/~/files/v0/b/gitbook-x-prod.appspot.com/o/spaces%2FH2bFRBmIfyK3kwVKbldl%2Fuploads%2Fgit-blob-bbb114fbf10e33ff01dbe6d5b114bfc71fbda02e%2Fpm-governanca-agendamentos-linha-do-tempo-filtro-capacidade-en.png?alt=media" alt="Timeline Capacity filter open, with search and the No capacity option"></picture><figcaption><p>Capacity filter (multiple selection)</p></figcaption></figure>

**How to use:**

1. Type part of the name in **Semantic Model** (*Search by name...*); the chart is filtered a few moments after you stop typing.
2. Click **Workspace**, **Capacity**, **Gateway** or **Connection**, search and check one or more options. In **Capacity**, the **No capacity** option shows models from workspaces with no assigned capacity.
3. Use the **x** inside a filter to clear it, or **Clear filters** (with the active filter counter) to return everything to the default, including day and times.

**How it works:** **Gateway** and **Connection** show only the models that read through the chosen gateway or connection. The filters can be combined.

### Timeline: execution details (tooltip)

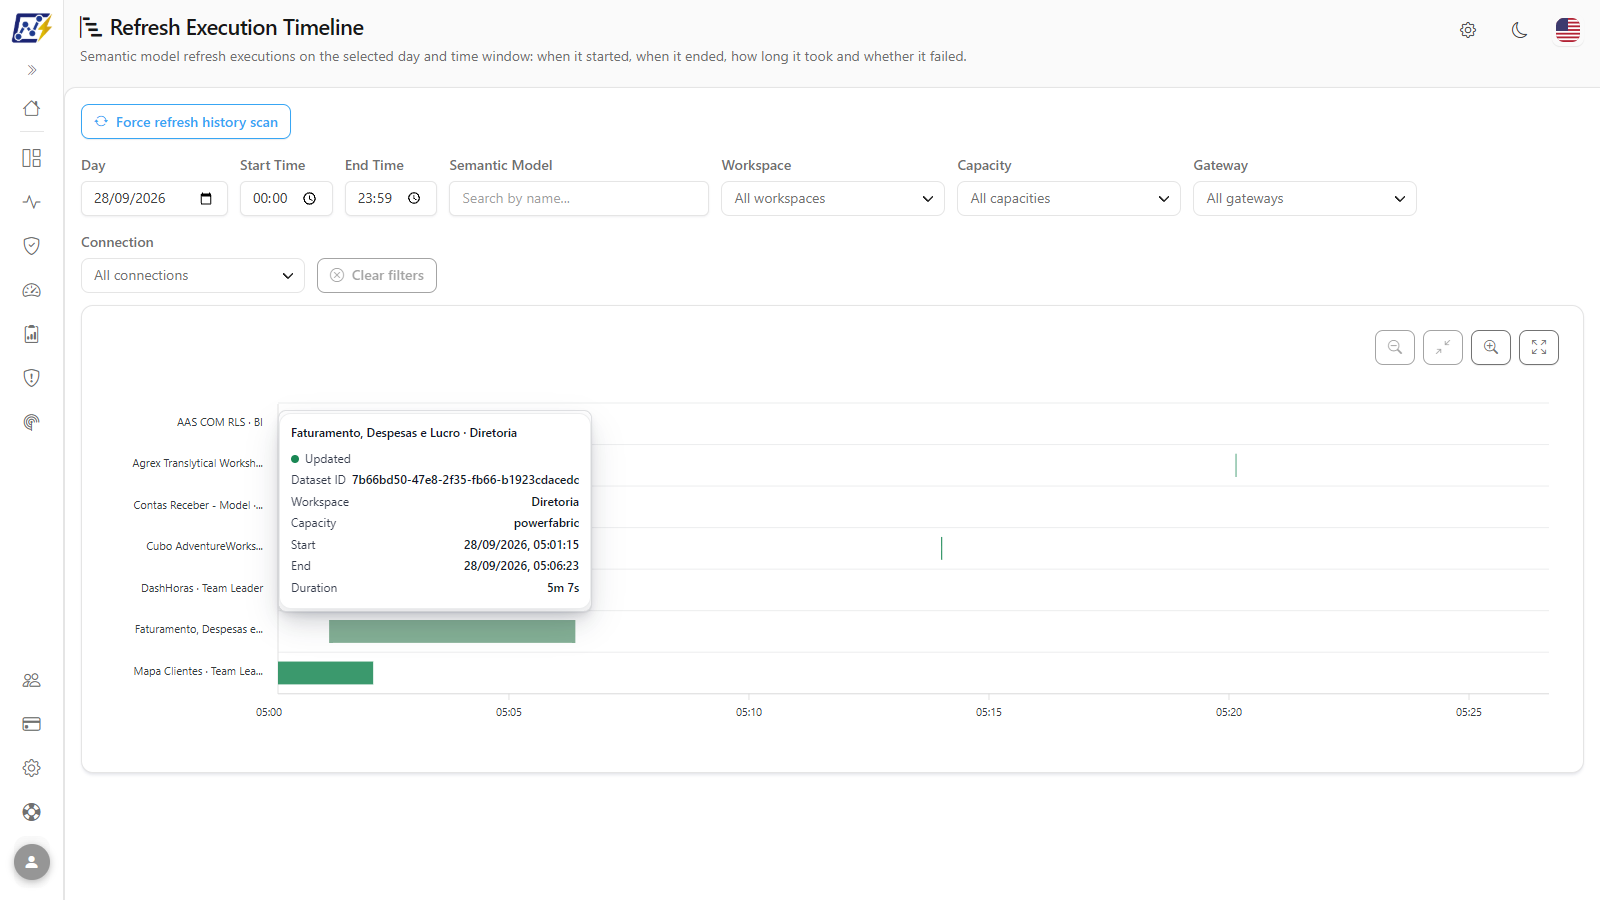
**What it is:** the box displayed when you hover over a bar.

**What it is for:** getting the exact data of an execution: including the dataset ID, to locate it in Power BI.

<figure><picture><source srcset="/files/LbFTsRXEJFxsgZ7yKdw0" media="(prefers-color-scheme: dark)"><img src="https://3938213054-files.gitbook.io/~/files/v0/b/gitbook-x-prod.appspot.com/o/spaces%2FH2bFRBmIfyK3kwVKbldl%2Fuploads%2Fgit-blob-fed4fea7deeebb1eaf41df35fc29028fa28bad06%2Fpm-governanca-agendamentos-linha-do-tempo-tooltip-en.png?alt=media" alt="Tooltip of a Timeline bar with name, status, Dataset ID, workspace, capacity, start, end and duration"></picture><figcaption><p>Details of an execution</p></figcaption></figure>

**How to use:** hover over a bar and read: full model name, status (**Updated**, **Failed**, **In progress**, **Cancelled**…), **Dataset ID**, **Workspace**, **Capacity**, **Start**, **End** and **Duration**.

### Timeline: zoom and fullscreen

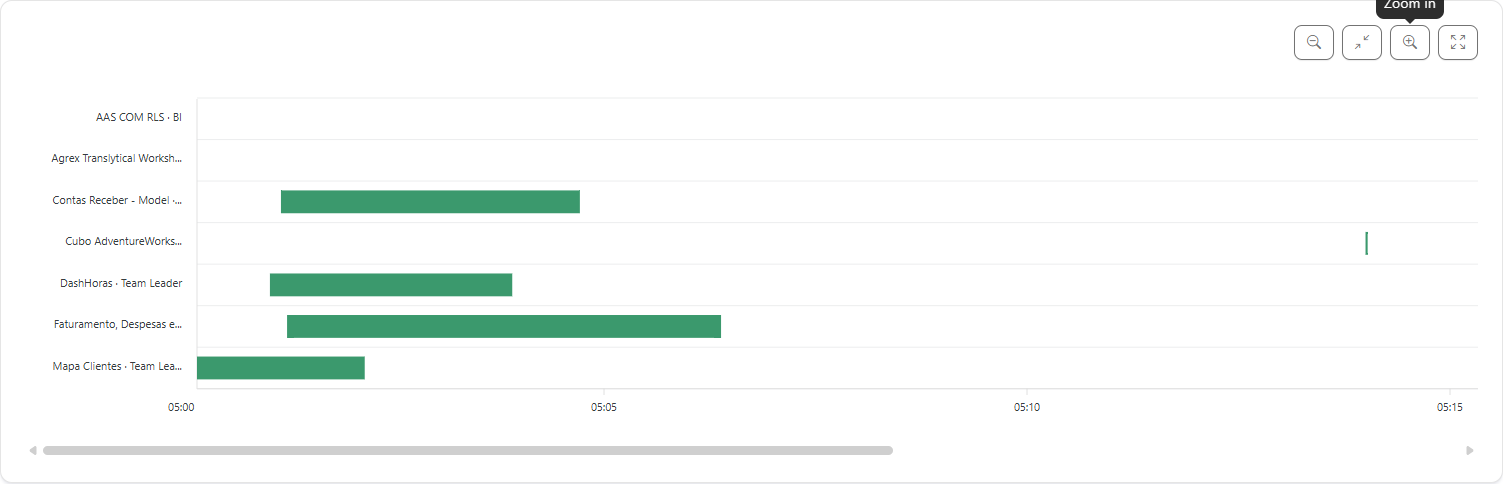
**What it is:** the buttons above the chart: **Zoom out**, **Fit to full range (100%)**, **Zoom in** and **Fullscreen**.

**What it is for:** visually separating short executions that are close to each other, or enlarging the chart when there are many models.

<figure><picture><source srcset="/files/Kf1mbwkFqIjufQd1cfdI" media="(prefers-color-scheme: dark)"><img src="https://3938213054-files.gitbook.io/~/files/v0/b/gitbook-x-prod.appspot.com/o/spaces%2FH2bFRBmIfyK3kwVKbldl%2Fuploads%2Fgit-blob-ae648bc0ea63d21f016461fc64b4f5eb26a97587%2Fpm-governanca-agendamentos-linha-do-tempo-zoom-en.png?alt=media" alt="Timeline chart with zoom applied and the zoom and fullscreen buttons"></picture><figcaption><p>Zoom applied to the chart</p></figcaption></figure>

**How to use:**

1. Click **Zoom in** or **Zoom out** to move the time axis closer or farther.
2. Click **Fit to full range (100%)** to return to the initial range.
3. Click **Fullscreen** to enlarge the chart; use **Exit fullscreen** (or Esc) to go back.

**How it works:** zoom starts from the actual range of the loaded executions, not the whole day. The buttons are disabled when there is nothing more to zoom in or out.

### Timeline: refreshes stuck as In progress

**What it is:** blue bars on the Timeline that stay **In progress** for hours, even though the refresh has already finished in Power BI.

**What it is for:** fixing these cases by reconciling the refresh with the actual Power BI refresh history, model by model.

**How to use:** an administrator clicks **View/manage collection →** in the Timeline action bar and, in [Mapping › Refreshes and Schedules](/en/power-monitor/mapeamento/atualizacoes-e-agendamentos.md), uses the **Force refresh history scan** button in the **Refresh history** card. When the reconciliation finishes, reload the Timeline.

**How it works:** only **Administrators** see the link. The reconciliation uses the organization's Service Principal credentials; the result and error messages appear on the Mapping page.

## How to use: common tasks

### How to find and relieve a peak time

{% stepper %}
{% step %}

#### Identify the peak

In the **Schedule Heatmap (UTC)**, locate the orange and red cells. If you want to analyze a specific capacity, choose it first in **Capacity**.
{% endstep %}

{% step %}

#### See who fires there

Click the cell. The table shows only the entities that fire on that UTC day and hour, each with its full schedule.
{% endstep %}

{% step %}

#### Check the actual execution

Open the **Timeline** on the same day and see whether the refreshes at that time overlap or take longer than usual. Remember that the Timeline is not in UTC.
{% endstep %}

{% step %}

#### Redistribute (Administrators)

Use **Edit** (Fabric items) or **Edit refresh schedule** (semantic models) to move some of the entities to less busy times. After saving, check the heatmap (for semantic models, click **Refresh now** when the notice indicates).
{% endstep %}
{% endstepper %}

### How to find out why a schedule change did not go through

{% stepper %}
{% step %}

#### Open the entity's history

On the entity's row, click the **View this entity's history** clock icon.
{% endstep %}

{% step %}

#### Filter the failures

Check **Failures only** and read the error message and code returned by the provider.
{% endstep %}

{% step %}

#### Fix before repeating

Apply the indicated fix (for example, granting access to the Service Principal or deleting a schedule when the item already has 20) and only then repeat the operation, to avoid creating a duplicate schedule.
{% endstep %}
{% endstepper %}

### How to make sure the screen shows all schedules

1. Check the **Last collection** in the header. If it is old, an administrator clicks **Run now** in [Mapping › Refreshes and Schedules](/en/power-monitor/mapeamento/atualizacoes-e-agendamentos.md) and, after a few minutes, reloads this screen.
2. If the notice **"The collection did not cover every workspace"** appears, grant access to the Service Principal with the **Grant access to the service principal** button and collect again.
3. Change **State** to **Active and paused** to include paused schedules.
4. Click **Clear filters** to remove any other scope.

### How to create the first schedule for a Fabric item

The Schedules screen lists only entities that already have a schedule. For an item with none:

1. Open [Data Engineering](/en/power-monitor/governanca/dados-e-engenharia/engenharia-de-dados.md) and the item details modal.
2. Go to the **Schedules** tab and click **Add schedule**.
3. Fill in the same form described in [Add another schedule](#add-another-schedule-fabric-item). After the next collection, the item starts appearing on this screen.

## Rules and behavior

* **Collection:** Fabric item schedules are collected **every 6 hours** (or on demand, by an administrator, in [Mapping › Refreshes and Schedules](/en/power-monitor/mapeamento/atualizacoes-e-agendamentos.md)) by the organization's Service Principal, in the monitored workspaces. Semantic model refresh schedules come from the Power BI admin API.
* **Only entities with a schedule** appear in the table. The first schedule for a Fabric item is created through the **Schedules** tab of the details modal in [Data Engineering](/en/power-monitor/governanca/dados-e-engenharia/engenharia-de-dados.md), which reads the item's schedule directly from Fabric at query time.
* **A paused schedule is a valid state**, displayed with the **Paused** badge, and only appears in the list when the **State** filter includes paused schedules.
* **Time zones:** the heatmap is always in **UTC**; the table and forms use **each entity's time zone**; the Timeline filters by the **organization's** time zone and displays in **your browser's** time zone. Some sources store only the day in UTC; in those cases an icon warns that the displayed day may differ from the local day when the time crosses midnight.
* **Monthly schedules** do not appear on the heatmap (they have no fixed day of the week), but remain in the table.
* **Workspace scope:** if your user has visibility restricted to some workspaces, you will see only their schedules.
* **Writing through the provider:** every creation, change and deletion is performed directly on the Power BI/Fabric API with the organization's Service Principal, which needs access to the item's workspace. Only **Administrators** can write.
* **Fabric limits:** up to **20 schedules per item**; up to 100 times per schedule; interval between 1 and 5,270,400 minutes; monthly recurrence every 1 to 12 months; validity start and end are required.
* **Empty table states:** the table explains why it is empty:

  | Message                                                | Meaning                                                                                                                                                                                                                                      |
  | ------------------------------------------------------ | -------------------------------------------------------------------------------------------------------------------------------------------------------------------------------------------------------------------------------------------- |
  | **No schedule matches the filters.**                   | There are schedules, but none meet the current filters. Adjust or clear the filters                                                                                                                                                          |
  | **No schedule collected yet.**                         | The collection has not run yet (it runs every 6 hours). Administrators see the **View/manage collection →** button, which leads to the collection in Mapping; other profiles see the notice that an administrator can trigger the collection |
  | **Nothing collected, and the coverage is incomplete.** | The Service Principal cannot see some of the monitored workspaces. Use **Grant access to the service principal** and collect again before concluding that there are no schedules                                                             |
  | **No schedule found.**                                 | The collection went through all accessible workspaces and found no semantic model or Fabric item schedules                                                                                                                                   |
* **Loading error:** if the heatmap or table cannot be loaded, the screen shows *"Could not load the schedules."* with the **Try again** button. On the Timeline, the message is *"Could not load the executions."*.

## Frequently asked questions

<details>

<summary>The screen is empty. Is there no schedule at all?</summary>

Read the table message: it distinguishes between "the collection has not run yet", "the coverage is incomplete" (the Service Principal cannot see some of the workspaces) and "no schedule found" (the collection covered everything and found nothing). Only in the last case does the organization really have no schedules in the monitored workspaces. Also check that the **State** filter is not hiding paused schedules.

</details>

<details>

<summary>Why is the time on the heatmap different from the time in the table?</summary>

The heatmap uses **UTC** to allow comparing entities in different time zones. The table uses the **time zone configured for each entity**. A schedule at 08:00 in Brasília (UTC-3) appears at 11:00 on the heatmap. In the table's expanded row, the **Local time** and **UTC time** columns show both side by side.

</details>

<details>

<summary>I edited a schedule and the table is still the same.</summary>

The change is saved immediately in Power BI/Fabric. For Fabric items, the screen is usually already reloaded with the new schedule; when that is not possible (always, for semantic models), Power Monitor queues a new collection and shows a notice. Wait about a minute and click **Refresh now**. If the notice says the immediate collection was not queued, the change appears in the next scheduled collection (every 6 hours).

</details>

<details>

<summary>Why can't I delete a semantic model's schedule?</summary>

Power BI does not offer deletion of the refresh schedule. To turn it off, uncheck all days or pause the schedule in the form.

</details>

<details>

<summary>Why is the + (Add another schedule) button disabled?</summary>

Hover over it to see the reason. The most common one is that the Service Principal has no access to the item's workspace; grant access and collect again. The button is also disabled for items with no identified workspace or of a type that does not support scheduling through the Fabric API.

</details>

<details>

<summary>I don't see the Edit, Delete or + buttons.</summary>

These buttons are exclusive to **Administrators**. Other profiles can view the screen and the action history, but cannot change schedules.

</details>

<details>

<summary>A refresh has been showing "In progress" for hours on the Timeline.</summary>

An administrator can use **Force refresh history scan** in [Mapping › Refreshes and Schedules](/en/power-monitor/mapeamento/atualizacoes-e-agendamentos.md) to reconcile the execution with the actual Power BI history.

</details>

## Related pages

* [Data Engineering](/en/power-monitor/governanca/dados-e-engenharia/engenharia-de-dados.md) (**Schedules** tab of the item details modal)
* [Semantic Models](/en/power-monitor/governanca/modelos-semanticos.md)
* [Workspaces](/en/power-monitor/governanca/workspaces.md) (Service Principal permission)
* [Mapping › Refreshes and Schedules](/en/power-monitor/mapeamento/atualizacoes-e-agendamentos.md) (manual collection and history reconciliation)
* [Capacities](/en/power-monitor/governanca/infraestrutura/capacidades.md) (capacity pause/resume and SKU schedules)
* [Gateways](/en/power-monitor/governanca/infraestrutura/gateways.md) and [Connections](/en/power-monitor/governanca/infraestrutura/conexoes.md)
* [Monitoring › Semantic Models](/en/power-monitor/monitoramento/modelos-semanticos.md)


---

# Agent Instructions
This documentation is published with GitBook. GitBook is the documentation platform designed so that both humans and AI agents can read, navigate, and reason over technical content effectively. Learn more at gitbook.com.

## Querying This Documentation
If you need additional information that is not directly available in this page, you can query the documentation by asking a question.

Perform an HTTP GET request on the following URL with the `ask` and `goal` query parameters:

```
GET https://docs.powermonitor.com.br/en/power-monitor/governanca/operacao/agendamentos.md?ask=<question>&goal=<user_goal>
```

`ask` is the immediate question: it should be specific, self-contained, and written in natural language.
`goal` is what the user is ultimately trying to achieve, the reason they need the answer. Sharing it helps GitBook give you a better, more relevant answer. A goal is most helpful when it describes the outcome the user wants rather than restating the question. For example, with `ask=how do I create an API token`, a goal like `automate deployments from our CI pipeline` lets GitBook tailor the answer to that use case.

The response will contain a direct answer to the question and relevant excerpts and sources from the documentation.

Use this mechanism when the answer is not explicitly present in the current page, you need clarification or additional context, or you want to retrieve related documentation sections.