> For the complete documentation index, see [llms.txt](https://docs.powermonitor.com.br/llms.txt). Markdown versions of documentation pages are available by appending `.md` to page URLs; this page is available as [Markdown](https://docs.powermonitor.com.br/en/power-monitor/governanca/operacao/artefatos-excluidos.md).

# Deleted Artifacts

List of the artifacts that no longer exist in your Fabric/Power BI environment, with the date on which Power Monitor detected the deletion.

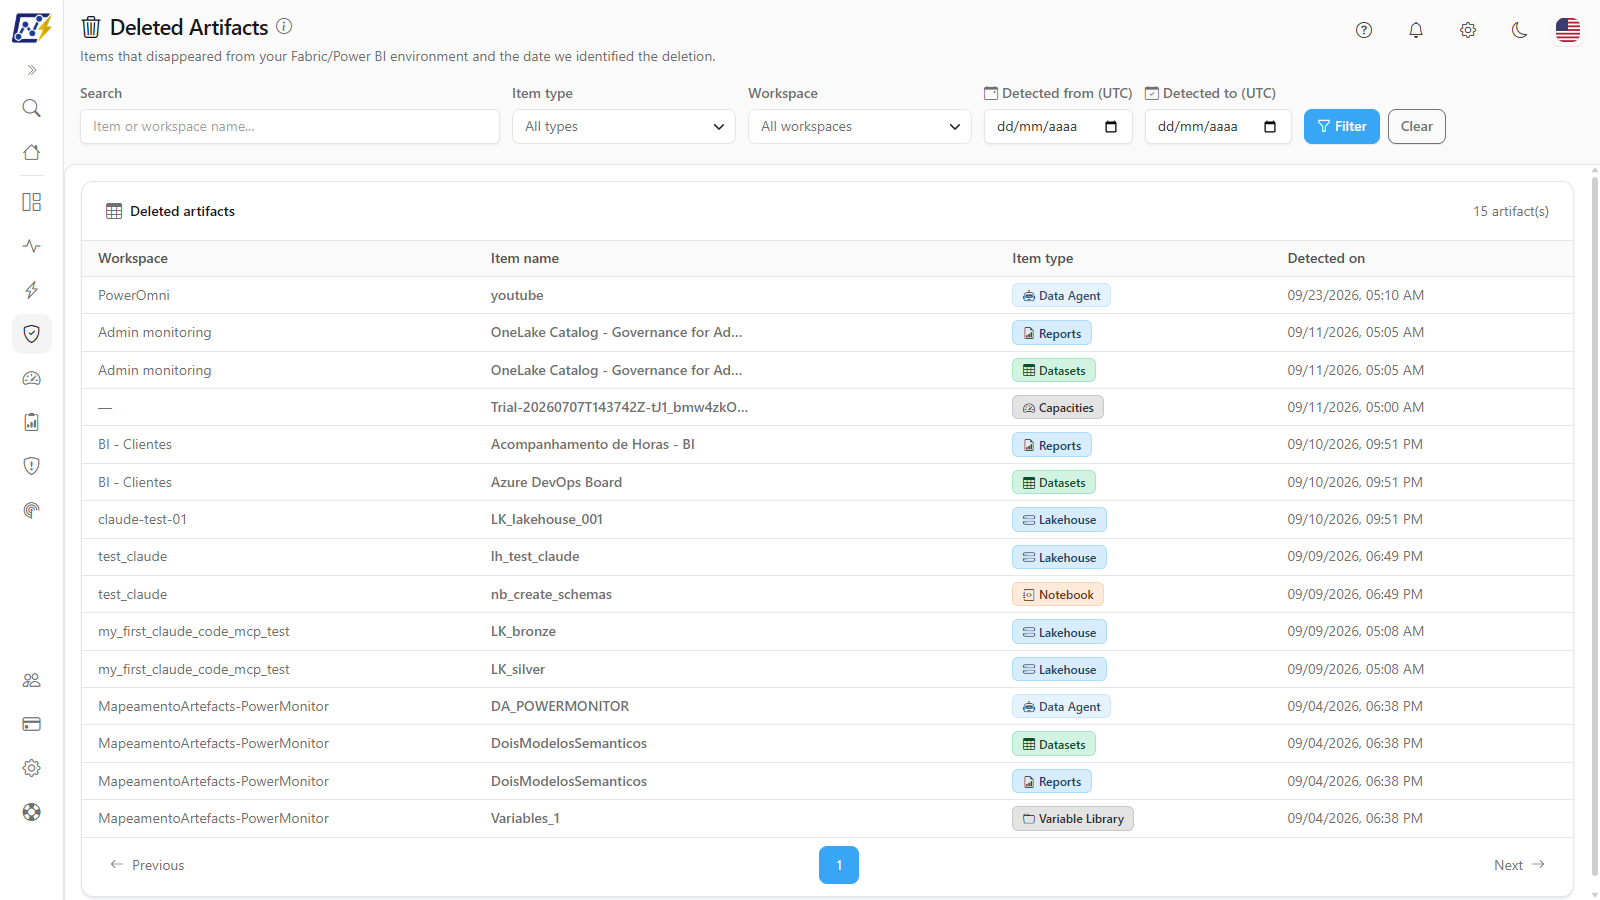
The **Deleted Artifacts** screen lists the items that disappeared from your Microsoft Fabric/Power BI environment (reports, semantic models, lakehouses, pipelines, workspaces, gateways, connections and other inventoried types) and the **date on which Power Monitor detected the deletion**. It is the only screen in the product where these items appear: on all other inventory screens and in the counts, they are no longer displayed.

**How to access:** menu *Governance › Operations › Deleted Artifacts* (last item of the Operations group). The screen is read-only and is available to all user profiles.

<figure><picture><source srcset="/files/reDpETwNhoc70Mkss3iO" media="(prefers-color-scheme: dark)"><img src="https://3938213054-files.gitbook.io/~/files/v0/b/gitbook-x-prod.appspot.com/o/spaces%2FH2bFRBmIfyK3kwVKbldl%2Fuploads%2Fgit-blob-ee9dbe5ebd02dea764f8097d0ae436c1484d57e8%2Fpm-governanca-artefatos-excluidos-en.png?alt=media" alt="Deleted Artifacts screen with filters and the table of deleted items"></picture><figcaption><p>Governance › Operations › Deleted Artifacts</p></figcaption></figure>

## What it is for

* **Explaining count variations**: understanding why the number of reports, models or workspaces decreased on the other screens and dashboards.
* **Auditing removals**: knowing what was removed from the tenant and when this was noticed, for example after a workspace cleanup.
* **Investigating incidents**: confirming whether a report that "disappeared" for users was actually deleted and which workspace it was in.
* **Supporting invoice verification**: deleted items no longer count toward the base of monitored artifacts.

## Screen overview

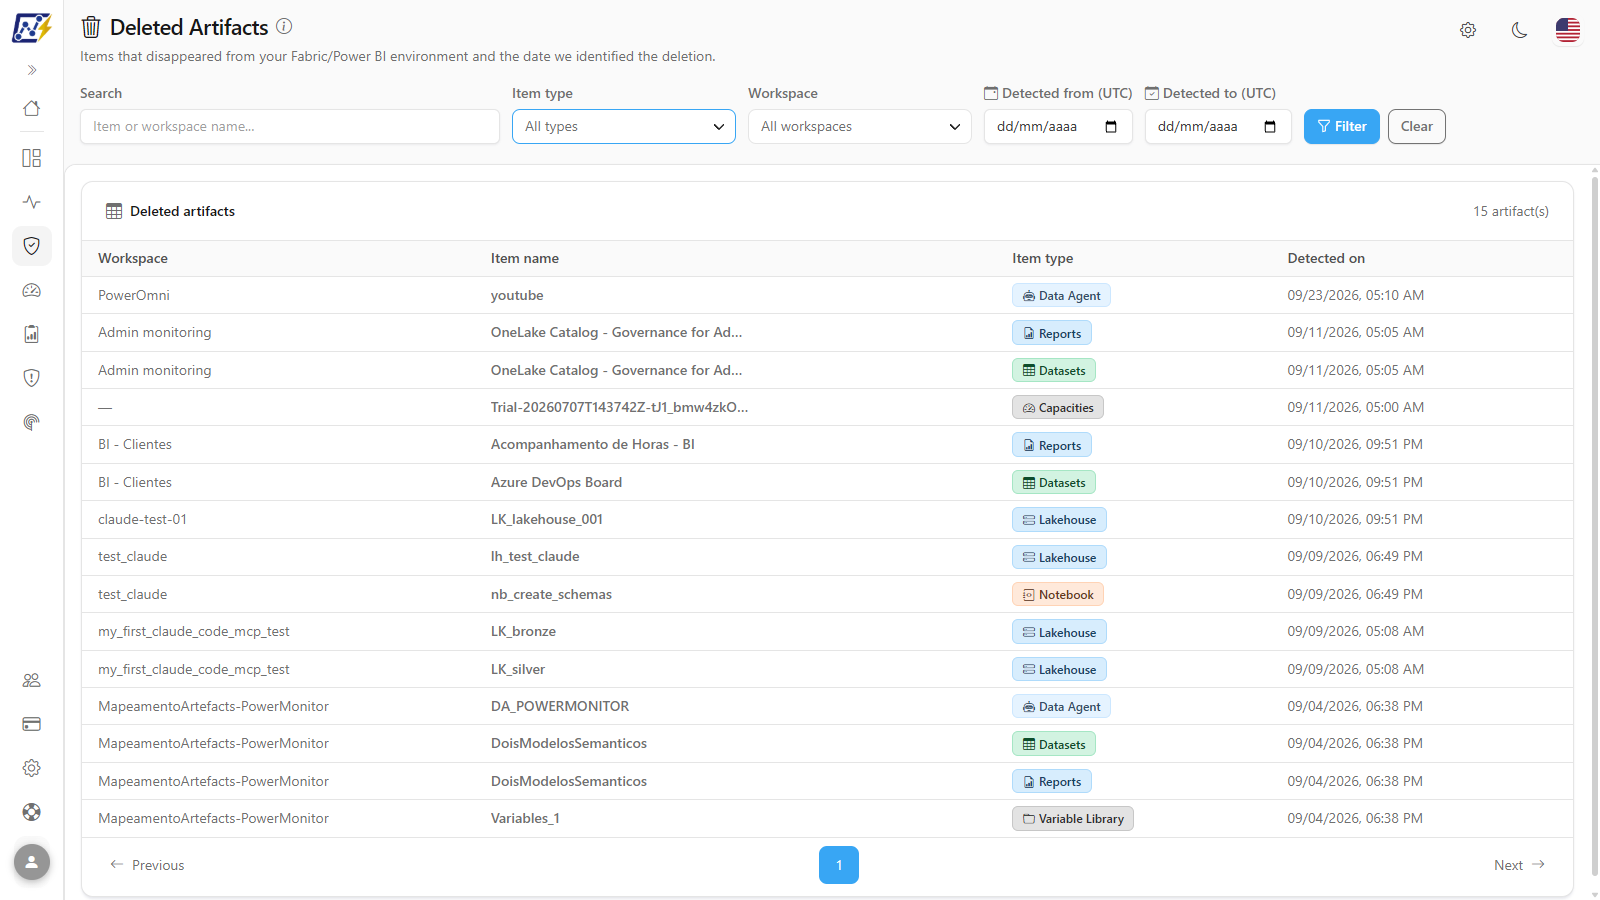
1. **Header** with the **Deleted Artifacts** title, an information icon (**i**) and the subtitle *Items that disappeared from your Fabric/Power BI environment and the date we identified the deletion.*
2. **Filter bar**: **Search**, **Item type**, **Workspace**, **Detected from (UTC)**, **Detected to (UTC)** and the **Filter** and **Clear** buttons.
3. **Showing:** line with the filters actually applied.
4. **Deleted artifacts table**, with the total number of results and pagination.

{% hint style="info" %}
On this screen the filters are **not** applied while you type or select: fill in the fields you want and click **Filter** (or press **Enter** in the **Search** field).
{% endhint %}

## Features

### Information icon: how deletion is detected

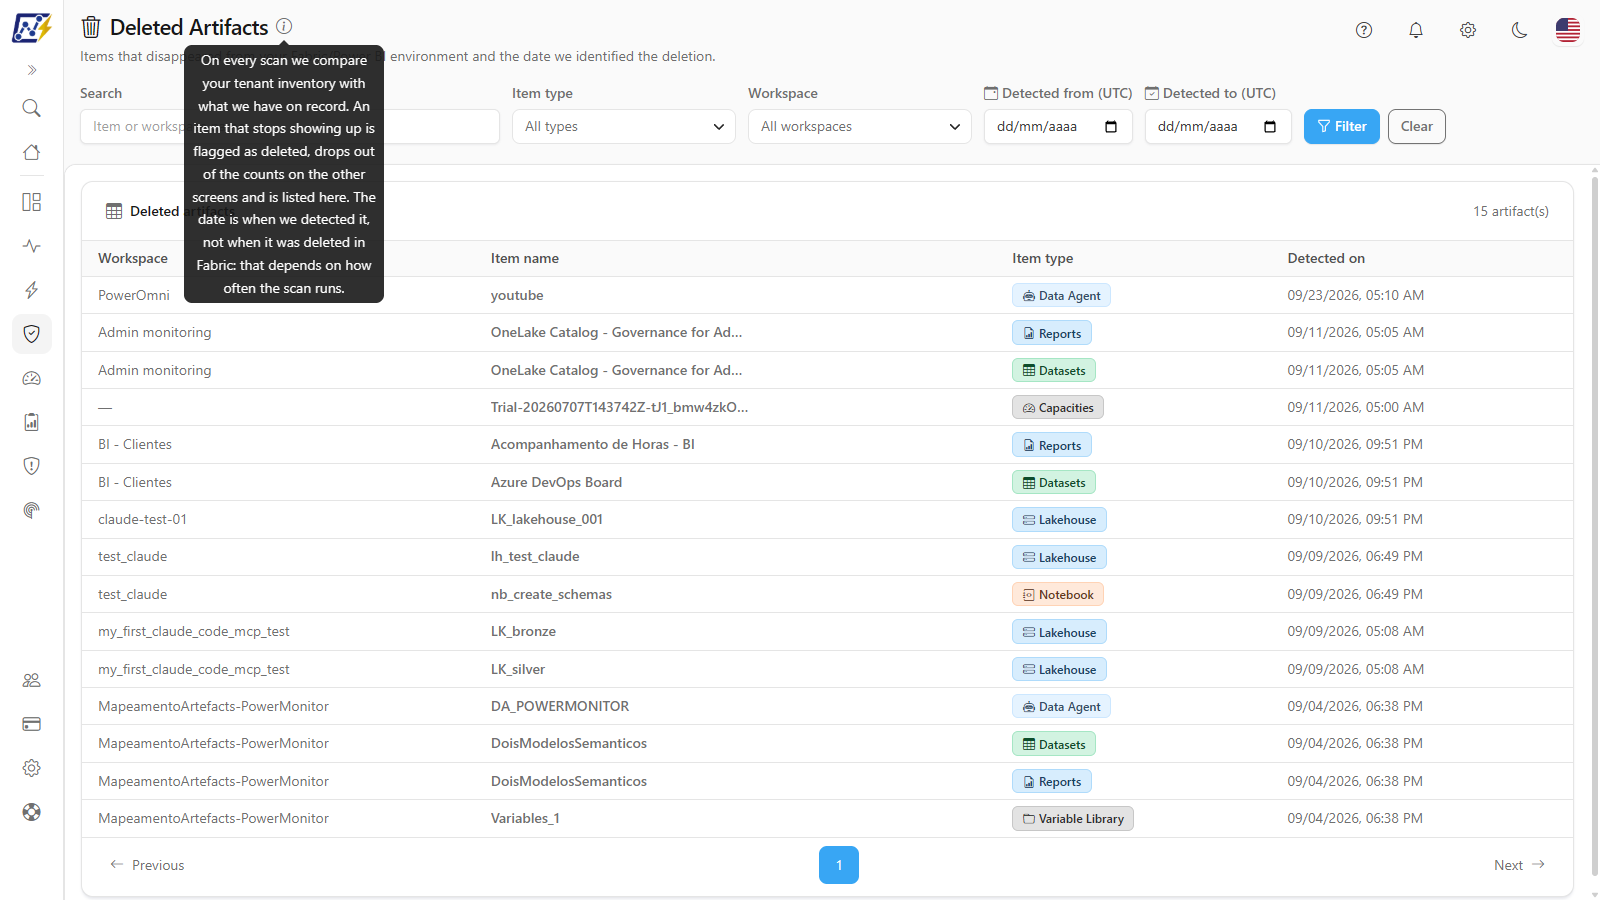
**What it is:** the **i** icon next to the title. On hover, it explains how the screen works: at each collection, Power Monitor compares the tenant inventory with what it has on record; an item that no longer appears is marked as deleted, leaves the counts on the other screens and starts being listed here.

**What it is for:** reminding you that the date displayed is the date of **detection** by Power Monitor, not of the deletion in Fabric.

<figure><picture><source srcset="/files/l7Sr8vm8MI3l2LSGAhpk" media="(prefers-color-scheme: dark)"><img src="https://3938213054-files.gitbook.io/~/files/v0/b/gitbook-x-prod.appspot.com/o/spaces%2FH2bFRBmIfyK3kwVKbldl%2Fuploads%2Fgit-blob-e81f53d5cfc794aa1647a99b1f0afdf4bea9da90%2Fpm-governanca-artefatos-excluidos-info-en.png?alt=media" alt="Information icon tooltip explaining how deletion is detected"></picture><figcaption><p>Explanation displayed by the information icon</p></figcaption></figure>

**How to use:** hover over the **i** icon next to the **Deleted Artifacts** title.

### Search

**What it is:** a free-text field (*Item or workspace name...*) that searches by item or workspace name.

**What it is for:** quickly confirming whether a report, model or workspace that "disappeared" for users was actually deleted.

<figure><picture><source srcset="/files/3gusKMqZjWSbreEVcM4h" media="(prefers-color-scheme: dark)"><img src="https://3938213054-files.gitbook.io/~/files/v0/b/gitbook-x-prod.appspot.com/o/spaces%2FH2bFRBmIfyK3kwVKbldl%2Fuploads%2Fgit-blob-a988c45ff0499bb26f4b805a138e384d9ba473d8%2Fpm-governanca-artefatos-excluidos-filtros-en.png?alt=media" alt="Filter bar with Search, Item type, Workspace, detection period and the Filter and Clear buttons"></picture><figcaption><p>Filter bar</p></figcaption></figure>

**How to use:**

1. In *Governance › Operations › Deleted Artifacts*, type part of the item or workspace name in **Search**.
2. Press **Enter** or click **Filter**.
3. The table shows the items found and the total (*N artifact(s)*). If nothing is found, the message *No deleted artifacts found for this filter.* appears.

### Item type filter

**What it is:** a multiple selection, with search, of artifact types (placeholder *All types*).

**What it is for:** restricting the list to one type (for example, only reports or only lakehouses) when auditing a cleanup.

<figure><picture><source srcset="/files/B6Thzf6ZXW3tlplg2j01" media="(prefers-color-scheme: dark)"><img src="https://3938213054-files.gitbook.io/~/files/v0/b/gitbook-x-prod.appspot.com/o/spaces%2FH2bFRBmIfyK3kwVKbldl%2Fuploads%2Fgit-blob-00f2b80ca90deddd45d35ebeaa2f4c55cbbafd2f%2Fpm-governanca-artefatos-excluidos-filtro-tipo-en.png?alt=media" alt="Item type multiple selection list open with the search and the artifact types"></picture><figcaption><p>Item type filter open</p></figcaption></figure>

**How to use:**

1. Click **Item type** and, if you want, type in the list's own search.
2. Check one or more types.
3. Click **Filter**.

**How it works:** artifact types appear with the Fabric/Power BI technical name (for example, **Reports**, **Datasets**, **Lakehouse**, **Data Pipeline**, **Notebook**), in alphabetical order; organization-level items appear with Power Monitor names (**Apps**, **Gateways**, **Capacities**, **Connections**, **Semantic Model Connections**, **Data Sources**), interleaved in the same order.

### Workspace filter

**What it is:** a multiple selection of workspaces (placeholder *All workspaces*).

**What it is for:** seeing what was removed from a specific workspace: for example, after a team reorganized its environment.

**How to use:**

1. Click **Workspace** and check one or more workspaces (the list has search).
2. Click **Filter**.

**How it works:** items that do not belong to a workspace (gateways, capacities, connections, data sources, apps) do not appear when a workspace is selected. If the workspace list cannot be loaded, the filter is empty, but the table keeps working.

### Detection period (Detected from / Detected to)

**What it is:** two date fields, **Detected from (UTC)** and **Detected to (UTC)**, that filter by the date on which Power Monitor detected the deletion.

**What it is for:** answering "what disappeared from the tenant this week/this month?".

<figure><picture><source srcset="/files/N849k87FTBvkDjMUo87s" media="(prefers-color-scheme: dark)"><img src="https://3938213054-files.gitbook.io/~/files/v0/b/gitbook-x-prod.appspot.com/o/spaces%2FH2bFRBmIfyK3kwVKbldl%2Fuploads%2Fgit-blob-c38ed7668427e269b4197dc5b34a5799850ff5c7%2Fpm-governanca-artefatos-excluidos-periodo-invalido-en.png?alt=media" alt="Date fields in red with the message The start date cannot be later than the end date"></picture><figcaption><p>Detection period validation</p></figcaption></figure>

**How to use:**

1. Fill in **Detected from (UTC)** and/or **Detected to (UTC)**. You can enter just one of the dates.
2. Click **Filter**.

**How it works:** the dates are in **UTC**. If the start date is later than the end date, both fields turn red, the message *The start date cannot be later than the end date.* is displayed and the **Filter** button is disabled until you correct the period.

### Filter and Clear buttons

**What it is:** **Filter** applies all filled-in filters; **Clear** returns all fields to the default and reloads the full list.

**What it is for:** building the query calmly (several filters) and applying it at once.

**How to use:**

1. Fill in the desired filters and click **Filter**. The query goes back to the first page.
2. To start over, click **Clear**: empty search, all types, all workspaces, no period, first page.

**How it works:** while the query is in progress, the fields and buttons are disabled and the table shows a loading indicator.

### Showing: line

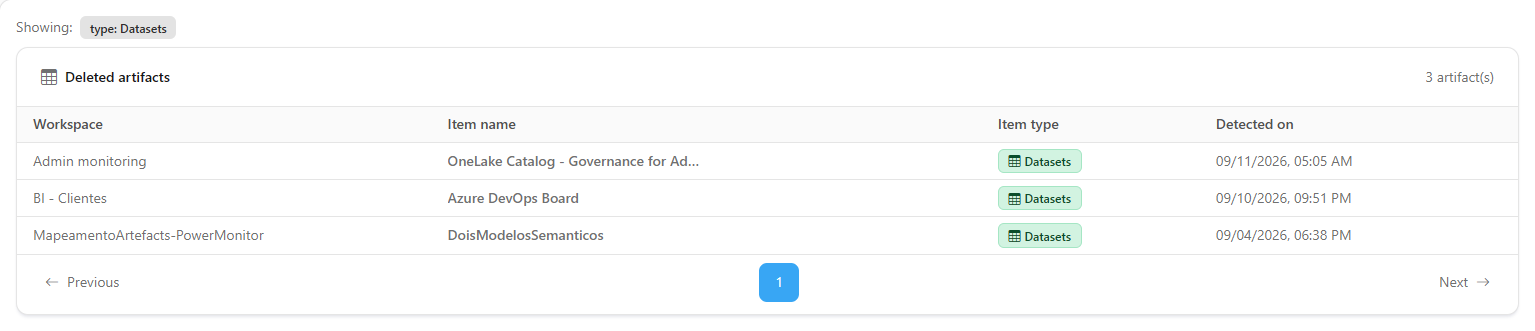
**What it is:** above the table, the **Showing:** line displays one badge per filter **actually applied** to the result: *search: term*, *type: …*, *workspace: …*, *from date* and *to date*.

**What it is for:** avoiding confusion between what is filled in the fields and what actually produced the displayed list (for example, if you changed a field and have not yet clicked **Filter**).

<figure><picture><source srcset="/files/PnHTYNY0GJWY38tB4Zg0" media="(prefers-color-scheme: dark)"><img src="https://3938213054-files.gitbook.io/~/files/v0/b/gitbook-x-prod.appspot.com/o/spaces%2FH2bFRBmIfyK3kwVKbldl%2Fuploads%2Fgit-blob-1950d9bcc012cddba69958061206d6a5989b06c8%2Fpm-governanca-artefatos-excluidos-mostrando-en.png?alt=media" alt="Showing line with the applied type badge above the deleted artifacts table"></picture><figcaption><p>Summary of applied filters</p></figcaption></figure>

**How it works:** the line only appears when a filter is applied and disappears after **Clear**.

### Deleted artifacts table

**What it is:** the **Deleted artifacts** table, with the total number of results (*N artifact(s)*) in the upper right corner.

**What it is for:** knowing what was removed, from where and when the absence was noticed.

| Column          | Description                                                                                                                                           |
| --------------- | ----------------------------------------------------------------------------------------------------------------------------------------------------- |
| **Workspace**   | Workspace the item was in. For items that do not belong to a workspace (gateways, capacities, connections, data sources, apps), the cell shows a dash |
| **Item name**   | Name of the artifact at the time it was last seen (long names are truncated; hover to see the full name)                                              |
| **Item type**   | Badge with the type's icon and color                                                                                                                  |
| **Detected on** | Date and time at which Power Monitor identified the deletion                                                                                          |

**How to use:**

1. Read the list from top to bottom: it is sorted from the **most recent** detection to the oldest.
2. Use the page controls below the table to navigate. By default **20 items per page** are displayed; the **Items per page** selector (10, 25, 50 or 100) changes the size, returns to the first page and keeps the applied filters.

**How it works:** the columns cannot be sorted manually and there is no export on this screen. The **⋮** button on each row (**More actions**), or a right-click, opens **View details** (see below).

### Deleted artifact details

**What it is:** the modal of a removed artifact, opened by **⋮ › View details**, with the **Overview** and **Dependents** tabs.

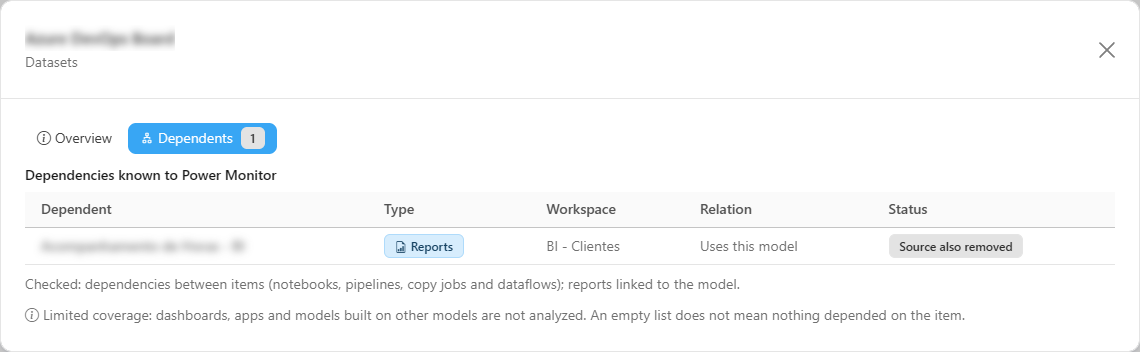
**What it is for:** before restoring or closing the case, knowing what may have broken with the removal: which pipelines, notebooks, reports and other items depended on the artifact and still exist.

<figure><picture><source srcset="/files/saQoRXCzbyq7aE7Fy5aW" media="(prefers-color-scheme: dark)"><img src="https://3938213054-files.gitbook.io/~/files/v0/b/gitbook-x-prod.appspot.com/o/spaces%2FH2bFRBmIfyK3kwVKbldl%2Fuploads%2Fgit-blob-04c93be4646eaac9ef1eaad708c74376aa1f9129%2Fpm-governanca-artefatos-excluidos-modal-dependentes-en.png?alt=media" alt="Dependents tab of a deleted artifact&#x27;s modal, with the count of dependents that may break and the table with the May break and Source also removed statuses"></picture><figcaption><p>Dependents of a deleted artifact</p></figcaption></figure>

**How to use:**

1. Click the row's **⋮** button (or right-click the row) and choose **View details**.
2. Read the **Overview** tab: the **Item type** and **Detected on** indicators and the **Removed item** section (workspace, name, type, detection date, item remote ID and workspace ID, with a copy button).
3. Click the **Dependents** tab and start with the **May break** rows.

**How it works:**

* The **Dependents** tab (*Dependencies known to Power Monitor*) is loaded the first time you open it and lists **Dependent**, **Type**, **Workspace**, **Relation** (*Reads the item*, *Writes to the item*, *Orchestrates the item* or *Uses this model*) and **Status**.

| Status                  | Meaning                                                                                                                                             |
| ----------------------- | --------------------------------------------------------------------------------------------------------------------------------------------------- |
| **May break**           | The dependent still exists and has lost its source item. It is highlighted, and the total appears above the table (*N still exist and may break.*). |
| **Source also removed** | The dependent was also removed.                                                                                                                     |

* **Limited coverage:** the lookup uses the dependencies between items (notebooks, pipelines, copy jobs and dataflows) and the reports linked to a model; the *Checked:* line states what was verified. Dashboards, apps and models built on other models are not analyzed, so an empty list ("No dependents known to Power Monitor.") does not guarantee that nothing depended on the item.
* The **Detected on** date is when Power Monitor noticed the removal, not when the item was deleted.

### Empty and error states

**What it is:** messages displayed in place of the table.

| Message                                       | Meaning                                                                                                      |
| --------------------------------------------- | ------------------------------------------------------------------------------------------------------------ |
| *No deleted artifacts found for this filter.* | There are no deleted items that match the applied filters (or no item was detected as deleted in your scope) |
| *Could not load the deleted artifacts.*       | The query failed. Click **Try again**                                                                        |

## How to use: common tasks

### How to check whether a report was deleted

{% stepper %}
{% step %}

#### Search by name

Type the name of the report (or the workspace) in **Search**.
{% endstep %}

{% step %}

#### Restrict the type

In **Item type**, select the desired type (for Power BI reports, **Reports**) and click **Filter**.
{% endstep %}

{% step %}

#### Check the date

The **Detected on** column indicates when the absence was noticed. To find out who deleted it, check the Power BI audit events for the period.
{% endstep %}
{% endstepper %}

### How to list what was deleted in a period

{% stepper %}
{% step %}

#### Enter the period

Fill in **Detected from (UTC)** and **Detected to (UTC)**.
{% endstep %}

{% step %}

#### Refine (optional)

Select types in **Item type** and/or workspaces in **Workspace**.
{% endstep %}

{% step %}

#### Apply and check

Click **Filter**. Check the applied filters in the **Showing:** line and, in the corner of the table, the total number of artifacts.
{% endstep %}
{% endstepper %}

## Rules and behavior

* **How deletion is detected:** at each collection, Power Monitor compares the tenant inventory with what it has on record. An item that no longer appears is marked as deleted, leaves the counts on the other screens and starts being listed here.
* **The date is of detection, not of deletion in Fabric.** It depends on the collection frequency: an item deleted in Fabric appears here after the next collection that notices its absence.
* **Conservative detection:** Power Monitor only marks an item as deleted when the read of that scope was **complete**. Collection failures, partial reads of a workspace, workspaces outside monitoring or incremental scans do **not** generate a mark, to avoid false positives.
* **Deleted workspace:** when a workspace is deleted, its items are also considered deleted.
* **Items that come back** (for example, restored from the Fabric recycle bin) have the mark removed at the next collection and no longer appear here, returning to the inventory screens.
* **Workspace scope:** if your user has visibility restricted to some workspaces, you will see only the items in those workspaces.

{% hint style="info" %}
The [Connections](/en/power-monitor/governanca/infraestrutura/conexoes.md) screen is a partial exception: it keeps listing connections and data sources detected as deleted, with a trash icon and the detection date, to make auditing easier.
{% endhint %}

## Frequently asked questions

<details>

<summary>I deleted an item in Fabric and it does not appear here yet.</summary>

The deletion is only detected at the next complete inventory collection. Until then the item remains on the other screens. See *Mapping › Inventory* ([Inventory](/en/power-monitor/mapeamento/inventarios.md)) to see when the next cycle is scheduled.

</details>

<details>

<summary>Is the "Detected on" date the date on which the item was deleted?</summary>

No. It is the date on which Power Monitor noticed the item's absence, which depends on the collection frequency.

</details>

<details>

<summary>Can I restore an item from this screen?</summary>

No. The screen is read-only. Restoration, when possible, is done in Fabric/Power BI itself; after the next collection the item returns to the inventory screens.

</details>

<details>

<summary>A workspace is no longer monitored. Do its items appear here?</summary>

No. Stopping monitoring a workspace is a decision of your organization, not a deletion in the tenant, and therefore does not generate a deleted artifact mark.

</details>

## Related pages

* [Workspaces](/en/power-monitor/governanca/workspaces.md)
* [Connections](/en/power-monitor/governanca/infraestrutura/conexoes.md)
* [Mapping › Inventory](/en/power-monitor/mapeamento/inventarios.md)
* [Audit › Events Overview](/en/power-monitor/auditoria/geral-de-eventos.md)


---

# Agent Instructions
This documentation is published with GitBook. GitBook is the documentation platform designed so that both humans and AI agents can read, navigate, and reason over technical content effectively. Learn more at gitbook.com.

## Querying This Documentation
If you need additional information that is not directly available in this page, you can query the documentation by asking a question.

Perform an HTTP GET request on the following URL with the `ask` and `goal` query parameters:

```
GET https://docs.powermonitor.com.br/en/power-monitor/governanca/operacao/artefatos-excluidos.md?ask=<question>&goal=<user_goal>
```

`ask` is the immediate question: it should be specific, self-contained, and written in natural language.
`goal` is what the user is ultimately trying to achieve, the reason they need the answer. Sharing it helps GitBook give you a better, more relevant answer. A goal is most helpful when it describes the outcome the user wants rather than restating the question. For example, with `ask=how do I create an API token`, a goal like `automate deployments from our CI pipeline` lets GitBook tailor the answer to that use case.

The response will contain a direct answer to the question and relevant excerpts and sources from the documentation.

Use this mechanism when the answer is not explicitly present in the current page, you need clarification or additional context, or you want to retrieve related documentation sections.