> For the complete documentation index, see [llms.txt](https://docs.powermonitor.com.br/llms.txt). Markdown versions of documentation pages are available by appending `.md` to page URLs; this page is available as [Markdown](https://docs.powermonitor.com.br/en/power-monitor/governanca/operacao/git-dos-workspaces.md).
# Workspace Git
See which workspaces are connected to Git, where there are uncommitted changes or conflicts and which workspaces could not be read. Automatic collection every 6 hours.
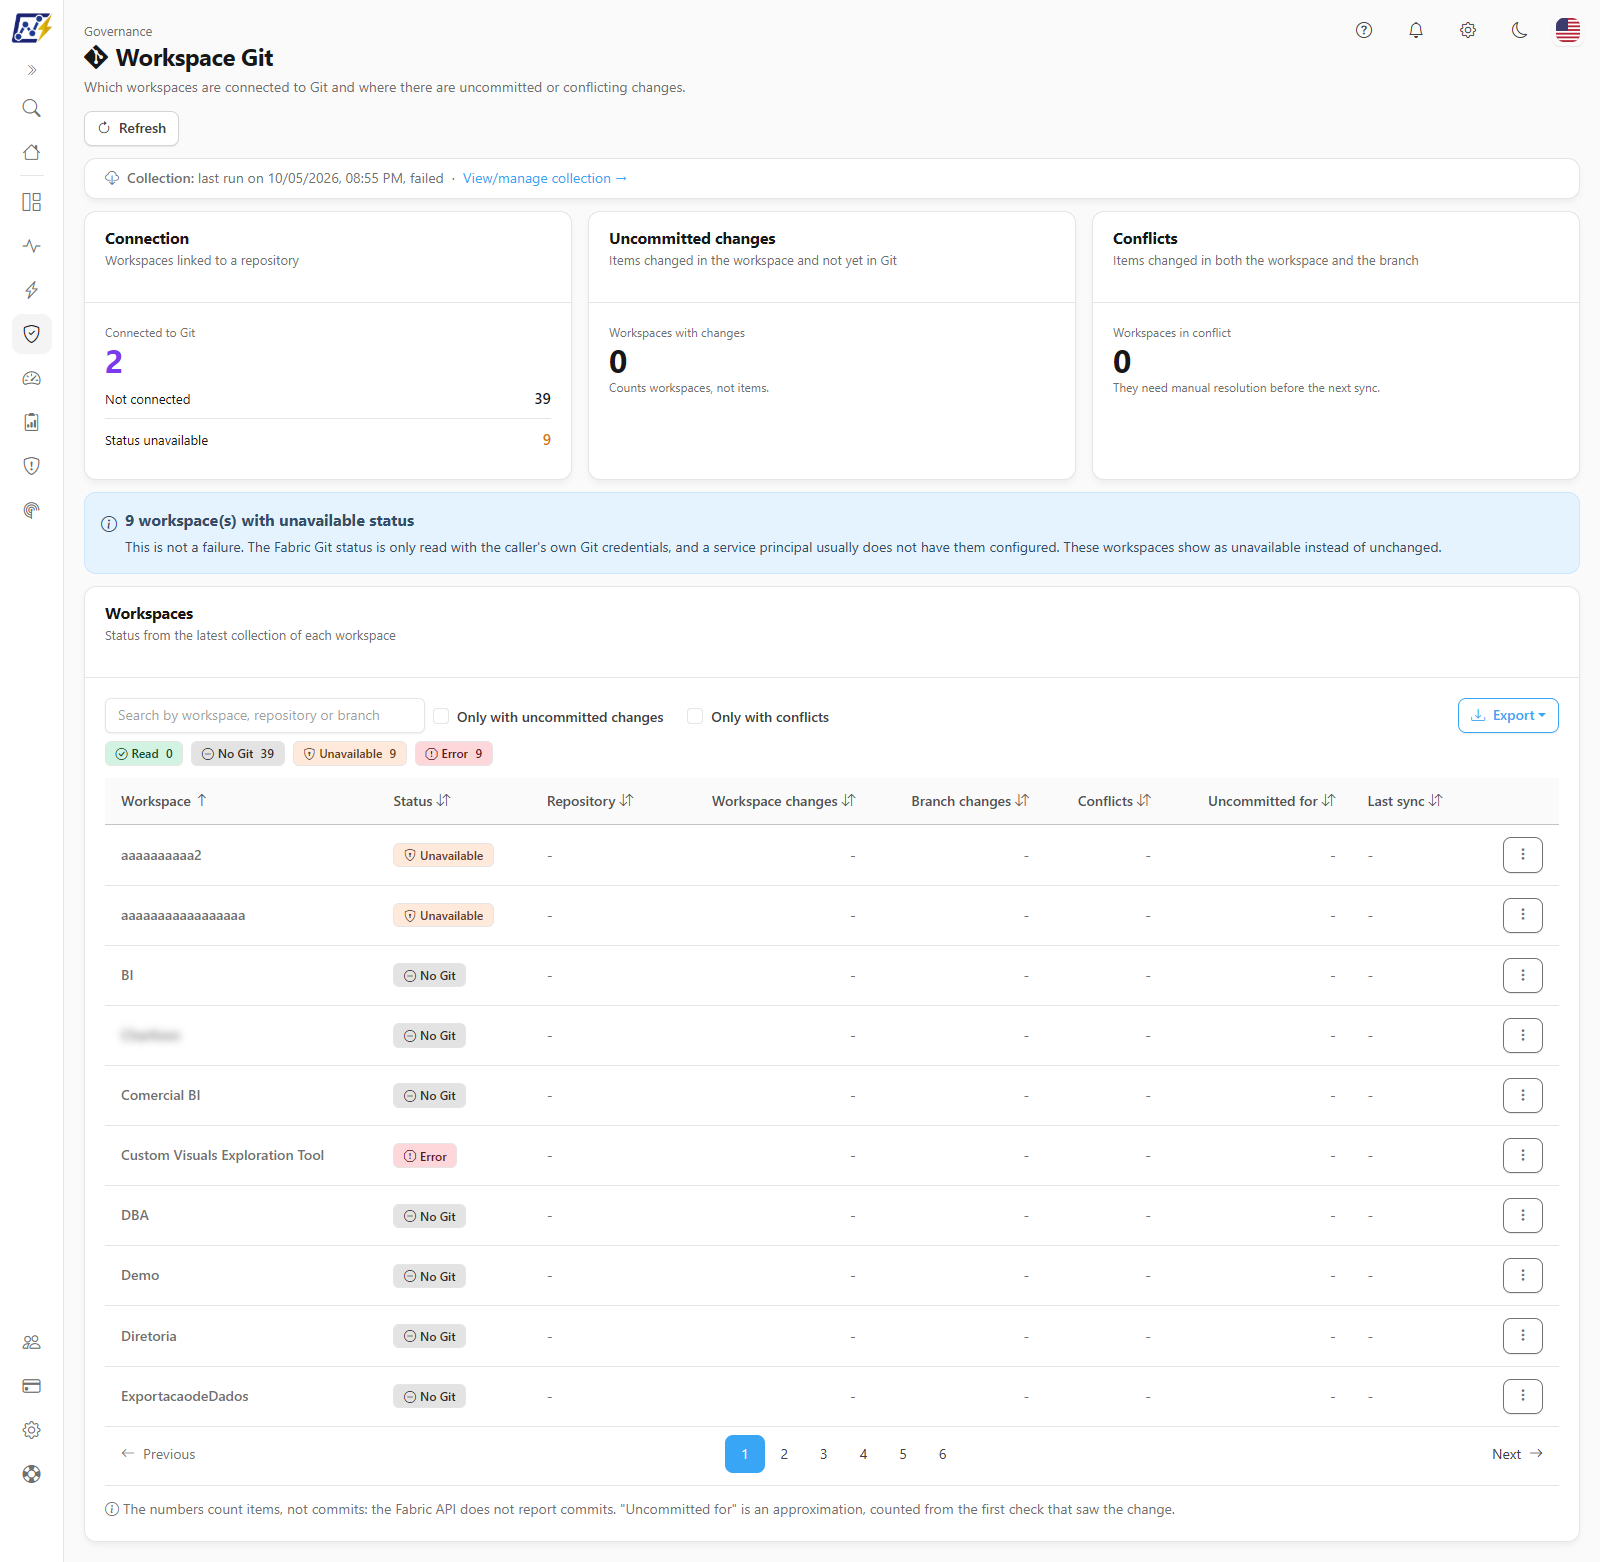
The **Workspace Git** screen shows, for each workspace, whether it is **connected to a Git repository** (Microsoft Fabric Git integration), to which repository and branch, and whether there are **uncommitted changes** or **conflicts** between the workspace and the branch.
**How to access:** menu *Governance › Operations › Workspace Git*.
**Who can use it:** the screen is read-only and open to **all profiles**, within each user's **workspace scope**. An administrator can block it for specific users in [Users](/en/power-monitor/usuarios.md). The **collection** itself is managed by Administrators in [*Mapping › Workspace Git*](/en/power-monitor/mapeamento/git-dos-workspaces.md) (see [Rules and behavior](#rules-and-behavior)).
Governance › Operations › Workspace Git
## What it is for
* **Measure adoption** of version control: how many workspaces are linked to Git and how many are not.
* **Find forgotten work**: workspaces with changes that have not been committed yet, and for how many days.
* **Anticipate problems**: workspaces in **conflict**, which require manual resolution before the next sync.
## Screen components
### Header and collection line
The **Refresh** button in the header reloads the list. Right below it is the **Collection** line, which reports the status of the last run (*last run on \[date]*, *running since \[date]*, *last run on \[date], failed* or *no run recorded*) and, for Administrators, the **View/manage collection →** link to [Mapping › Workspace Git](/en/power-monitor/mapeamento/git-dos-workspaces.md).
### KPI cards
| Card | What it shows |
| ----------------------------------------------------------------------------- | ---------------------------------------------------------------------------- |
| **Connection** (*Workspaces linked to a repository*) | **Connected to Git**, with **Not connected** and **Status unavailable** |
| **Uncommitted changes** (*Items changed in the workspace and not yet in Git*) | **Workspaces with changes**. Counts workspaces, not items |
| **Conflicts** (*Items changed in both the workspace and the branch*) | **Workspaces in conflict**. They need manual resolution before the next sync |
### Unavailable status notice
When there are workspaces with unavailable status, the notice **N workspace(s) with unavailable status** appears. **This is not a failure:** the Fabric Git status is only read with the caller's own Git credentials, and a Service Principal usually does not have them configured. These workspaces show as unavailable instead of unchanged.
### List of workspaces
The **Workspaces** list (*Status from the latest collection of each workspace*) has the filters **Search by workspace, repository or branch**, **Only with uncommitted changes** and **Only with conflicts**, plus four status buttons (**Read**, **No Git**, **Unavailable** and **Error**, each with its workspace count) that work as a filter: click to filter and click again to undo. **Clear filters** appears when any filter is active. The filters combine, and changing one goes back to the first page.
| Status | Meaning |
| --------------- | ------------------------------------------------------------------------------------- |
| **Read** | The Git status was read successfully |
| **No Git** | The workspace is not connected to a Git repository |
| **Unavailable** | The Service Principal cannot read the status of this workspace. This is not a failure |
| **Error** | The collection failed for this workspace |
| Column | Content |
| --------------------- | ------------------------------------------------------ |
| **Workspace** | Workspace name |
| **Status** | Result of the last collection (see above) |
| **Repository** | Connected repository and branch |
| **Workspace changes** | Items changed in the workspace and not yet in Git |
| **Branch changes** | Items changed in the branch |
| **Conflicts** | Items in conflict |
| **Uncommitted for** | For how many days there has been an uncommitted change |
| **Last sync** | When the workspace was last synced with Git |
In **Repository**, the second line shows the provider and the branch. The counters (**Workspace changes**, **Branch changes** and **Conflicts**) only exist when the status was **Read**; otherwise a dash is shown. Hovering the **Status** badge shows the explanation of the result and, when available, the error detail. The columns are sortable (the initial order is **Workspace**, A to Z; empty values always go last), the table is paginated 10 at a time with the **Items per page** selector, and **Conflicts** appears in red when there are items in conflict.
The **More actions** menu of each row (or right-click) offers **View details** (see below), **Open workspace in Power BI** and **Copy workspace name** (the screen confirms with *Name copied.*). The **Export** button generates CSV or JSON respecting the filters (it includes provider, branch, days uncommitted and last checked).
{% hint style="info" %}
The numbers **count items, not commits**: the Fabric API does not report commits. **Uncommitted for** is an approximation, counted from the first check that saw the change.
{% endhint %}
### Workspace details
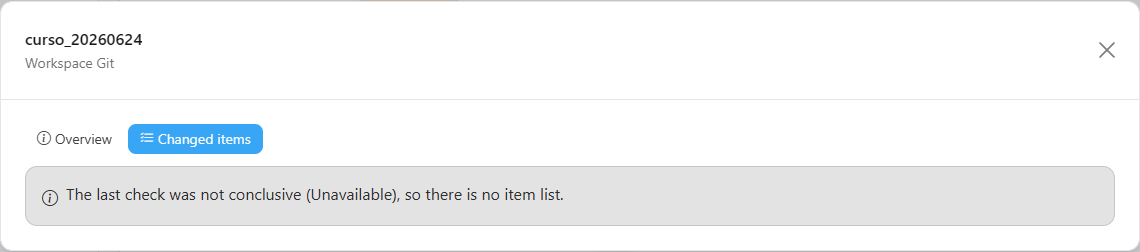
The **View details** item of the **More actions** menu opens the Git status modal of a workspace, with the **Overview** and **Changed items** tabs. Use it to know exactly which items are out of sync with Git before committing or updating the workspace.
Changed items of a workspace connected to Git
* **Overview:** follows the [common structure](/en/power-monitor/governanca/relatorios.md#the-overview-tab). The **Workspace changes**, **Branch changes**, **Conflicts** and **Uncommitted for** indicators appear when there is data. The sections are **Git connection** (Provider, Repository, Branch, Connection state), **Synchronization** (Last sync, Last check, Uncommitted change since) and **Collection result** (Status, What it means and, when available, the error Detail).
* **Changed items:** loaded the first time you open the tab. It lists **Item**, **Type**, **In the workspace** and **In the branch** (*Added*, *Modified*, *Deleted* or *No change*) and **Conflict** (*Conflict*, *Same changes* or *No conflict*), with the check date above the table (*Items from the check of date.*).
* The **Changed items** tab distinguishes the cases: "not collected yet" (wait for the next collection, every 6 hours), "the last check was not conclusive" (no item list) and "No changed items in the last check.". They are always items, never commits.
## Rules and behavior
* **Frequency:** the collection runs **every 6 hours**. If Fabric has not been collected yet, the screen shows *No workspace collected yet. Run the collection in Mapping.*
* **Manual collection:** an Administrator can run the collection right away in *Mapping › Workspace Git* (**Run now** button). The collection can be turned on or off, and its frequency adjusted, in *Settings › Monitoring* (**Workspace Git status**).
* **Where the data comes from:** the Fabric API (Git status of each workspace). Power Monitor only reads; it never commits, syncs or changes the Git connection.
* **Limit:** the list loads up to 5,000 workspaces (the screen warns *Showing N of M workspaces. Use the search to find a specific one.* when it shows only part). The indicators and the status button counts are computed over the loaded workspaces.
* **Scope:** users with visibility restricted to some workspaces only see their own.
## Step by step
### How to find workspaces with uncommitted work
1. Open *Governance › Operations › Workspace Git*.
2. Turn on **Only with uncommitted changes**.
3. Read the **Uncommitted for** column to prioritize the oldest.
4. Use **Open workspace in Power BI** to handle each case with the responsible team.
## Frequently asked questions
Why do so many workspaces appear as "Unavailable"?
Fabric only reports the Git status with the Git credentials of whoever queries, and the Power Monitor Service Principal normally does not have them. It is not a failure: the workspace shows as unavailable, never as "unchanged".
Does the screen show the number of pending commits?
No. The Fabric API does not report commits; the numbers are counts of items.
Can I fix a conflict through Power Monitor?
No. The screen is read-only. Conflicts are resolved in the workspace's own Git integration, in Fabric.
## Related pages
* [Operations](/en/power-monitor/governanca/operacao.md): Governance menu group
* [Deployment history](/en/power-monitor/governanca/operacao/historico-de-deploys.md)
* [Deployment Pipelines](/en/power-monitor/governanca/operacao/pipelines-de-implantacao.md)
* [Workspaces](/en/power-monitor/governanca/workspaces.md)
* [Settings › Monitoring](/en/power-monitor/configuracoes/monitoramento.md)
---
# Agent Instructions
This documentation is published with GitBook. GitBook is the documentation platform designed so that both humans and AI agents can read, navigate, and reason over technical content effectively. Learn more at gitbook.com.
## Querying This Documentation
If you need additional information that is not directly available in this page, you can query the documentation by asking a question.
Perform an HTTP GET request on the following URL with the `ask` and `goal` query parameters:
```
GET https://docs.powermonitor.com.br/en/power-monitor/governanca/operacao/git-dos-workspaces.md?ask=&goal=
```
`ask` is the immediate question: it should be specific, self-contained, and written in natural language.
`goal` is what the user is ultimately trying to achieve, the reason they need the answer. Sharing it helps GitBook give you a better, more relevant answer. A goal is most helpful when it describes the outcome the user wants rather than restating the question. For example, with `ask=how do I create an API token`, a goal like `automate deployments from our CI pipeline` lets GitBook tailor the answer to that use case.
The response will contain a direct answer to the question and relevant excerpts and sources from the documentation.
Use this mechanism when the answer is not explicitly present in the current page, you need clarification or additional context, or you want to retrieve related documentation sections.