> For the complete documentation index, see [llms.txt](https://docs.powermonitor.com.br/llms.txt). Markdown versions of documentation pages are available by appending `.md` to page URLs; this page is available as [Markdown](https://docs.powermonitor.com.br/en/power-monitor/governanca/operacao/historico-de-deploys.md).
# Deployment history
See who ran each deployment between the stages of deployment pipelines, when, what changed and whether it worked. History accumulated by a daily collection, for up to 180 days.
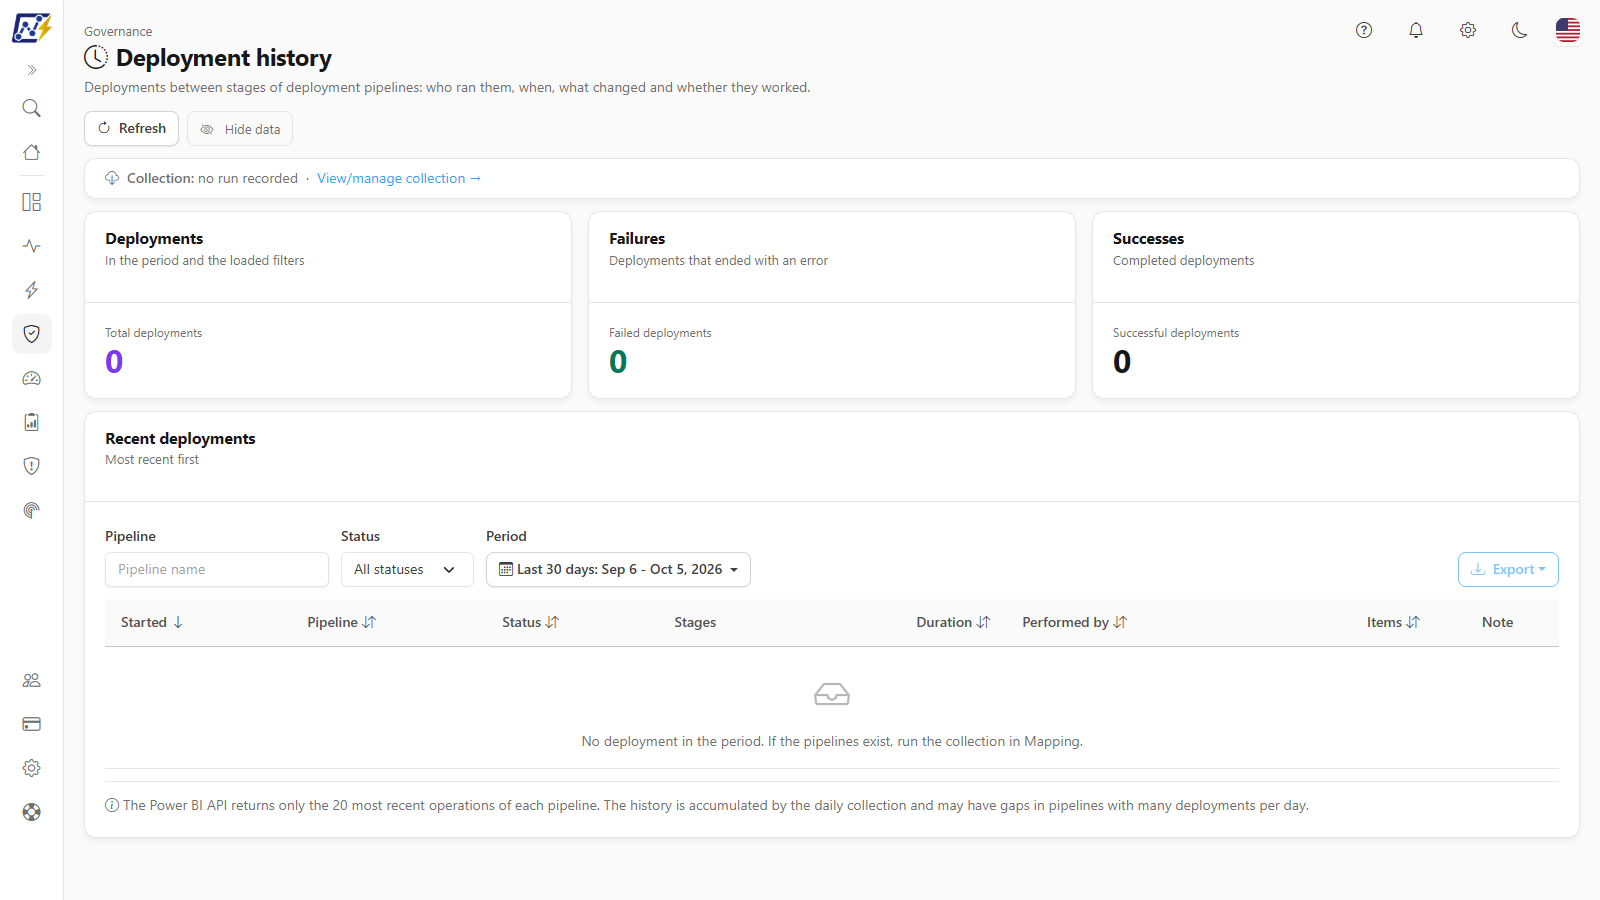
The **Deployment history** screen lists the **deployment operations** (deployments between stages) of the tenant's **deployment pipelines**: from which stage to which, who ran it, when it started, how long it took, how many items were affected and whether it ended successfully.
**How to access:** menu *Governance › Operations › Deployment history*.
**Who can use it:** the screen is read-only and open to **all profiles**, within each user's **workspace scope**. An administrator can block it for specific users in [Users](/en/power-monitor/usuarios.md). The collection is managed by Administrators in [*Mapping › Deployment operations*](/en/power-monitor/mapeamento/operacoes-de-deploy.md).
Governance › Operations › Deployment history
## What it is for
* **Trace changes in production:** who deployed what, from which stage to which and when.
* **Investigate deployment failures** and measure the duration of deployments.
* **Audit the ALM process** (lifecycle), complementing the inventory in [Deployment Pipelines](/en/power-monitor/governanca/operacao/pipelines-de-implantacao.md).
## Screen components
### Header and collection line
The header has the **Refresh** button and the **Hide data** button. Below it is the **Collection** line, with the status of the last run (*last run on \[date]*, *running since \[date]*, *last run on \[date], failed* or *no run recorded*) and, for Administrators, the **View/manage collection →** link.
### KPI cards
| Card | What it shows |
| -------------------------------------------------------- | ------------------------------------------------------------------------------------------------ |
| **Deployments** (*In the period and the loaded filters*) | **Total deployments** |
| **Failures** (*Deployments that ended with an error*) | **Failed deployments**. The card turns red when there are failures and green when there are none |
| **Successes** (*Completed deployments*) | **Successful deployments** |
The three cards count the deployments already loaded on screen (the chosen period and **Status** filter); the **Pipeline** filter does not change the card counts.
### Recent deployments
The **Recent deployments** list (*Most recent first*) has the filters **Pipeline** (search by part of the name, applied instantly to the loaded deployments), **Status** (**All statuses**, **Failed**, **Executing**, **Not started**, **Succeeded**) and **Period** (7, 14, 30, 60, 90 or 180 days, or a custom range of up to 180 days; the default is 30 days). **Status** and **Period** query the server, which delivers the deployments in batches of 100 with the **Load more** button (*N of M*). On screen, the table is paginated 10 at a time, with the **Items per page** selector. The **View deployment history** button on each pipeline in [Deployment Pipelines](/en/power-monitor/governanca/operacao/pipelines-de-implantacao.md) opens this screen already filtered by the pipeline.
| Column | Content |
| ---------------- | ------------------------------------------------------------------------------------------------------------------------------------------------------------------------------------------------------------------------------- |
| **Started** | When the deployment began |
| **Pipeline** | Pipeline name |
| **Status** | **Succeeded**, **Failed**, **Executing** or **Not started** |
| **Stages** | From which stage to which (**Development**, **Test**, **Production**) |
| **Duration** | Deployment time |
| **Performed by** | Who ran it. It is an identity: it respects the **Hide data** button; apps and groups stay readable |
| **Items** | Three colored counts: **+N** new items, **\~N** different and **=N** identical to the target stage; the hint details them (*N new, N different, N identical to the target stage*). A dash when the deployment reported no items |
| **Note** | A comment icon, with the note recorded on the deployment in the hint (*note truncated* when too long); a dash when there is no note |
The table comes sorted by **Started**, from newest to oldest. The **Started**, **Pipeline**, **Status**, **Duration**, **Performed by** and **Items** columns can be sorted; **Stages** and **Note** cannot. **Duration** appears as *N s*, *N min N s* or *N h N min* and shows a dash while the deployment is running.
In **Performed by**, the **Hide data** button masks the person's name on screen and in exports; apps and groups stay readable.
The **Export** button generates CSV or JSON of the displayed deployments (respecting the pipeline filter and **Hide data**), with start, end, pipeline, status, source and target stage, duration in seconds, performed by, counts of new, different and identical items, and the note.
At the bottom of the list, a fixed note reminds you of the source limit: the Power BI API returns only the 20 most recent operations of each pipeline. With no results, the screen shows *No deployment in the period...* (nothing collected) or *No deployment matches the filters.*
## Rules and behavior
* **Frequency:** the collection runs **once a day**. If there is no data yet, the screen guides you: *No deployment in the period. If the pipelines exist, run the collection in Mapping.*
* **Retention:** the history is kept for **180 days**.
* **Source limit (best effort):** the Power BI API returns only the **20 most recent operations of each pipeline**. The history is accumulated by the daily collection and **may have gaps** in pipelines with many deployments per day.
* **Manual collection and configuration:** in *Mapping › Deployment operations* (**Run now**) and in *Settings › Monitoring* (**Pipeline deployment operations**).
* Power Monitor only reads: it never runs or undoes deployments.
## Step by step
### How to investigate a deployment failure
{% stepper %}
{% step %}
### Filter the failures
In *Governance › Operations › Deployment history*, choose **Status › Failed** and the period.
{% endstep %}
{% step %}
### Identify the deployment
See the **Pipeline**, the **Stages**, **Performed by** and the **Note**.
{% endstep %}
{% step %}
### Dig deeper
Open the pipeline in Power BI to read the error message and rerun the deployment.
{% endstep %}
{% endstepper %}
## Frequently asked questions
Why does an old deployment not appear?
The Power BI API only reports the 20 most recent operations per pipeline, and the history is built by the daily collection. Deployments made between two collections, beyond those 20, cannot be recovered.
Can I see the content of each deployment?
You see the item counts (new, different and identical), but not the list of items.
## Related pages
* [Operations](/en/power-monitor/governanca/operacao.md): Governance menu group
* [Deployment Pipelines](/en/power-monitor/governanca/operacao/pipelines-de-implantacao.md)
* [Workspace Git](/en/power-monitor/governanca/operacao/git-dos-workspaces.md)
* [Model History](/en/power-monitor/governanca/operacao/historico-de-modelos.md)
* [Settings › Monitoring](/en/power-monitor/configuracoes/monitoramento.md)
---
# Agent Instructions
This documentation is published with GitBook. GitBook is the documentation platform designed so that both humans and AI agents can read, navigate, and reason over technical content effectively. Learn more at gitbook.com.
## Querying This Documentation
If you need additional information that is not directly available in this page, you can query the documentation by asking a question.
Perform an HTTP GET request on the following URL with the `ask` and `goal` query parameters:
```
GET https://docs.powermonitor.com.br/en/power-monitor/governanca/operacao/historico-de-deploys.md?ask=&goal=
```
`ask` is the immediate question: it should be specific, self-contained, and written in natural language.
`goal` is what the user is ultimately trying to achieve, the reason they need the answer. Sharing it helps GitBook give you a better, more relevant answer. A goal is most helpful when it describes the outcome the user wants rather than restating the question. For example, with `ask=how do I create an API token`, a goal like `automate deployments from our CI pipeline` lets GitBook tailor the answer to that use case.
The response will contain a direct answer to the question and relevant excerpts and sources from the documentation.
Use this mechanism when the answer is not explicitly present in the current page, you need clarification or additional context, or you want to retrieve related documentation sections.