> For the complete documentation index, see [llms.txt](https://docs.powermonitor.com.br/llms.txt). Markdown versions of documentation pages are available by appending `.md` to page URLs; this page is available as [Markdown](https://docs.powermonitor.com.br/en/power-monitor/governanca/operacao/historico-de-modelos.md).
# Model History
Track structural changes in semantic models (tables, columns, measures and relationships), compare versions and, if you want, get an alert when a change breaks compatibility.
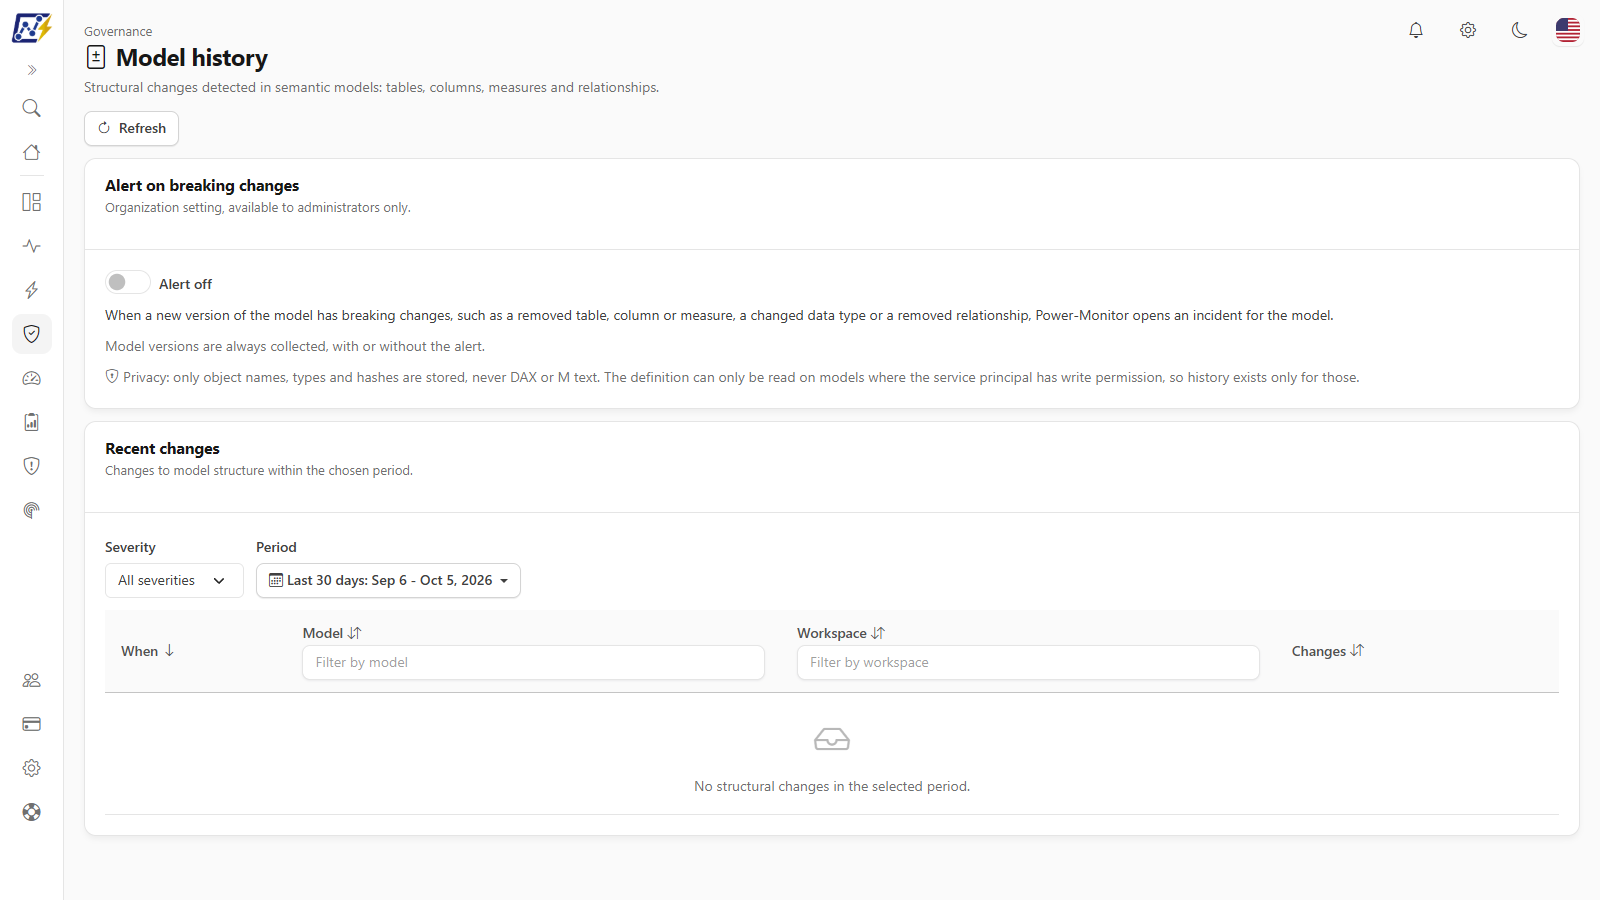
The **Model History** screen shows the **structural changes** detected in semantic models: tables, columns, measures, relationships, hierarchies, security roles and other objects that were added, removed or changed. Each change gets a **severity** (**Breaking**, **Additive** or **Cosmetic**) and you can compare two captured versions of the same model.
**How to access:** menu *Governance › Operations › Model History*. You can also open the history of a specific model from the **⋮** menu of the Governance [Semantic Models](/en/power-monitor/governanca/modelos-semanticos.md) screen, with the **View change history** action.
**Who can use it:** reading is open to **all profiles**, within each user's **workspace scope**. Only **Administrators** see and change the breaking-change alert card. An administrator can block the page for specific users in [Users](/en/power-monitor/usuarios.md).
Governance › Operations › Model History
## What it is for
* **Find out what changed** in a model before a report breaks: a removed table, column or measure, a changed data type or a removed relationship.
* **Audit** the evolution of the structure of models and see the version history.
* **Be notified** (optionally) of changes that break compatibility.
## Screen components
### "Alert on breaking changes" card (Administrator)
An organization setting, available only to Administrators (**Alert on** / **Alert off**). When on, a new version of the model with a breaking change (removed table, column or measure, changed data type, removed relationship) opens an **incident** for the model, handled like the other Power Monitor alerts (e-mail, channels and [Alerts](/en/power-monitor/monitoramento/alertas.md)). The incident is resolved when the next version no longer has breaking changes or after 7 days. The same change never alerts twice.
Model versions are collected **always**, with or without the alert. The option can also be turned on in *Settings › Monitoring*, in the **Audit, security and compliance** section (**Model History: breaking change alert**).
### Recent changes
The **Recent changes** feed (*Changes to model structure within the chosen period*) has these filters:
| Filter | Options |
| --------------------------------------------- | ----------------------------------------------------------------- |
| **Severity** | **All severities**, **Breaking**, **Additive** or **Cosmetic** |
| **Period** | 7, 14, 30, 60, 90 or 180 days, or a custom range (up to 365 days) |
| **Filter by model** / **Filter by workspace** | Text search |
And the columns **When**, **Model**, **Workspace** and **Changes** (badges with the number of changes of each severity, with an icon and a hover tooltip). The list comes sorted by **When**, from newest to oldest, and the columns can be re-sorted by clicking the header. The *Filter by model* and *Filter by workspace* fields sit in the headers of the **Model** and **Workspace** columns. The **Refresh** button in the header reloads the feed.
The server delivers the changes in batches of 100, with the **Load more** button (*N of M*); on screen the table is paginated 10 at a time, with the **Items per page** selector. Clicking a row opens **View changes**. The **More actions** menu of each row (also with right-click) offers:
* **View changes:** opens the **Changes in** *model* window, with the capture date and time, the workspace and what changed in that capture, grouped by severity (object type, name and what changed: *added*, *removed*, *changed*, *visibility changed*, *data type changed*, *definition changed*, *partition mode changed* etc.). If the record has many changes, the window shows only the first ones and a notice with a **View model history** button for the full list;
* **View model history:** opens the model's full history.
### Severity of changes
| Severity | When |
| ------------ | ---------------------------------------------------------------------------------------------------------------------------------------------------- |
| **Breaking** | Table, column or measure removed, column data type changed or relationship removed |
| **Additive** | Items added, measure expression or column definition changed, partition mode or source, relationships changed, security roles and shared expressions |
| **Cosmetic** | Visibility of tables, columns and measures, hierarchies, perspectives, cultures and partition count |
Renaming an object cannot be told apart from removing and adding: it appears as a removal (**Breaking**) plus an addition.
### Model history
The **History of** *model* window (with a **Refresh** button in the header) also opens from *Governance › Semantic Models*, with the **View change history** action of the row menu. It shows:
* **Captured versions** (*N versions, newest first*), each with the counts of **Tables**, **Columns**, **Measures** and **Relationships**. The first capture is the **Baseline** (*there is no earlier version to compare with*); the newest carries the **Latest** badge. A **Breaking alert open** badge indicates versions with an open incident.
* **Differences between versions:** choose **Older version** and **Newer version** (or use **Compare with previous**) to see what changed, from most to least severe. Two identical versions cannot be compared, and neither can versions generated by different versions of the analyzer (the window explains why).
## Rules and behavior
* **How it is captured:** the model structure is read together with the model definition during the model mapping collection (once a day) and inventory ingestion. A new version is only stored **when the structure changes**.
* **Which models have history:** only models whose definition the Power Monitor Service Principal can read, which requires **write** permission on the model. Models without that permission have no history (the window shows *History only exists for models whose definition Power-Monitor can read*).
* **Privacy:** only **names, types and hashes** of objects are stored. **Never** DAX or M text, RLS filters or data source details. Formatting-only edits do not count as a change.
* **Retention:** up to 50 versions per model; the oldest are discarded.
* **Microsoft standard artifacts:** do not apply to this screen.
## Step by step
### How to investigate a change that broke a report
{% stepper %}
{% step %}
### Filter the breaks
In *Governance › Operations › Model History*, choose **Severity › Breaking** and the desired period.
{% endstep %}
{% step %}
### See what changed
Click **View changes** on the model's row to see the removed or changed objects.
{% endstep %}
{% step %}
### Compare versions
Open **View model history** and compare the previous version with the latest.
{% endstep %}
{% step %}
### Fix it
Restore the object in the model or adjust the reports that depended on it.
{% endstep %}
{% endstepper %}
### How to be notified of breaks (Administrator)
1. On the screen itself, turn on the switch of the **Alert on breaking changes** card.
2. Check the recipients in [Settings › Notifications](/en/power-monitor/configuracoes/notificacoes.md).
## Frequently asked questions
A model has no history. Why?
Power Monitor can only read the definition of models on which the Service Principal has write permission. Without it, there are no captured versions.
Does Power Monitor store the text of my DAX measures?
No. Only names, types and hashes. You can tell that a measure changed, but not the content of the expression.
Is the date of the change the real date of the change?
It is the date of the capture that noticed the change, not necessarily the exact moment the model was changed.
## Related pages
* [Operations](/en/power-monitor/governanca/operacao.md): Governance menu group
* [Semantic Models](/en/power-monitor/governanca/modelos-semanticos.md)
* [Alerts](/en/power-monitor/monitoramento/alertas.md)
* [Model Mapping](/en/power-monitor/mapeamento/mapeamento-de-modelos.md)
* [Settings › Monitoring](/en/power-monitor/configuracoes/monitoramento.md)
---
# Agent Instructions
This documentation is published with GitBook. GitBook is the documentation platform designed so that both humans and AI agents can read, navigate, and reason over technical content effectively. Learn more at gitbook.com.
## Querying This Documentation
If you need additional information that is not directly available in this page, you can query the documentation by asking a question.
Perform an HTTP GET request on the following URL with the `ask` and `goal` query parameters:
```
GET https://docs.powermonitor.com.br/en/power-monitor/governanca/operacao/historico-de-modelos.md?ask=&goal=
```
`ask` is the immediate question: it should be specific, self-contained, and written in natural language.
`goal` is what the user is ultimately trying to achieve, the reason they need the answer. Sharing it helps GitBook give you a better, more relevant answer. A goal is most helpful when it describes the outcome the user wants rather than restating the question. For example, with `ask=how do I create an API token`, a goal like `automate deployments from our CI pipeline` lets GitBook tailor the answer to that use case.
The response will contain a direct answer to the question and relevant excerpts and sources from the documentation.
Use this mechanism when the answer is not explicitly present in the current page, you need clarification or additional context, or you want to retrieve related documentation sections.