> For the complete documentation index, see [llms.txt](https://docs.powermonitor.com.br/llms.txt). Markdown versions of documentation pages are available by appending `.md` to page URLs; this page is available as [Markdown](https://docs.powermonitor.com.br/en/power-monitor/governanca/operacao/pipelines-de-implantacao.md).
# Deployment Pipelines
Inventory of the tenant's deployment pipelines, queried live in Power BI, with stages, assigned workspaces and administrators, highlighting orphaned pipelines and empty stages.
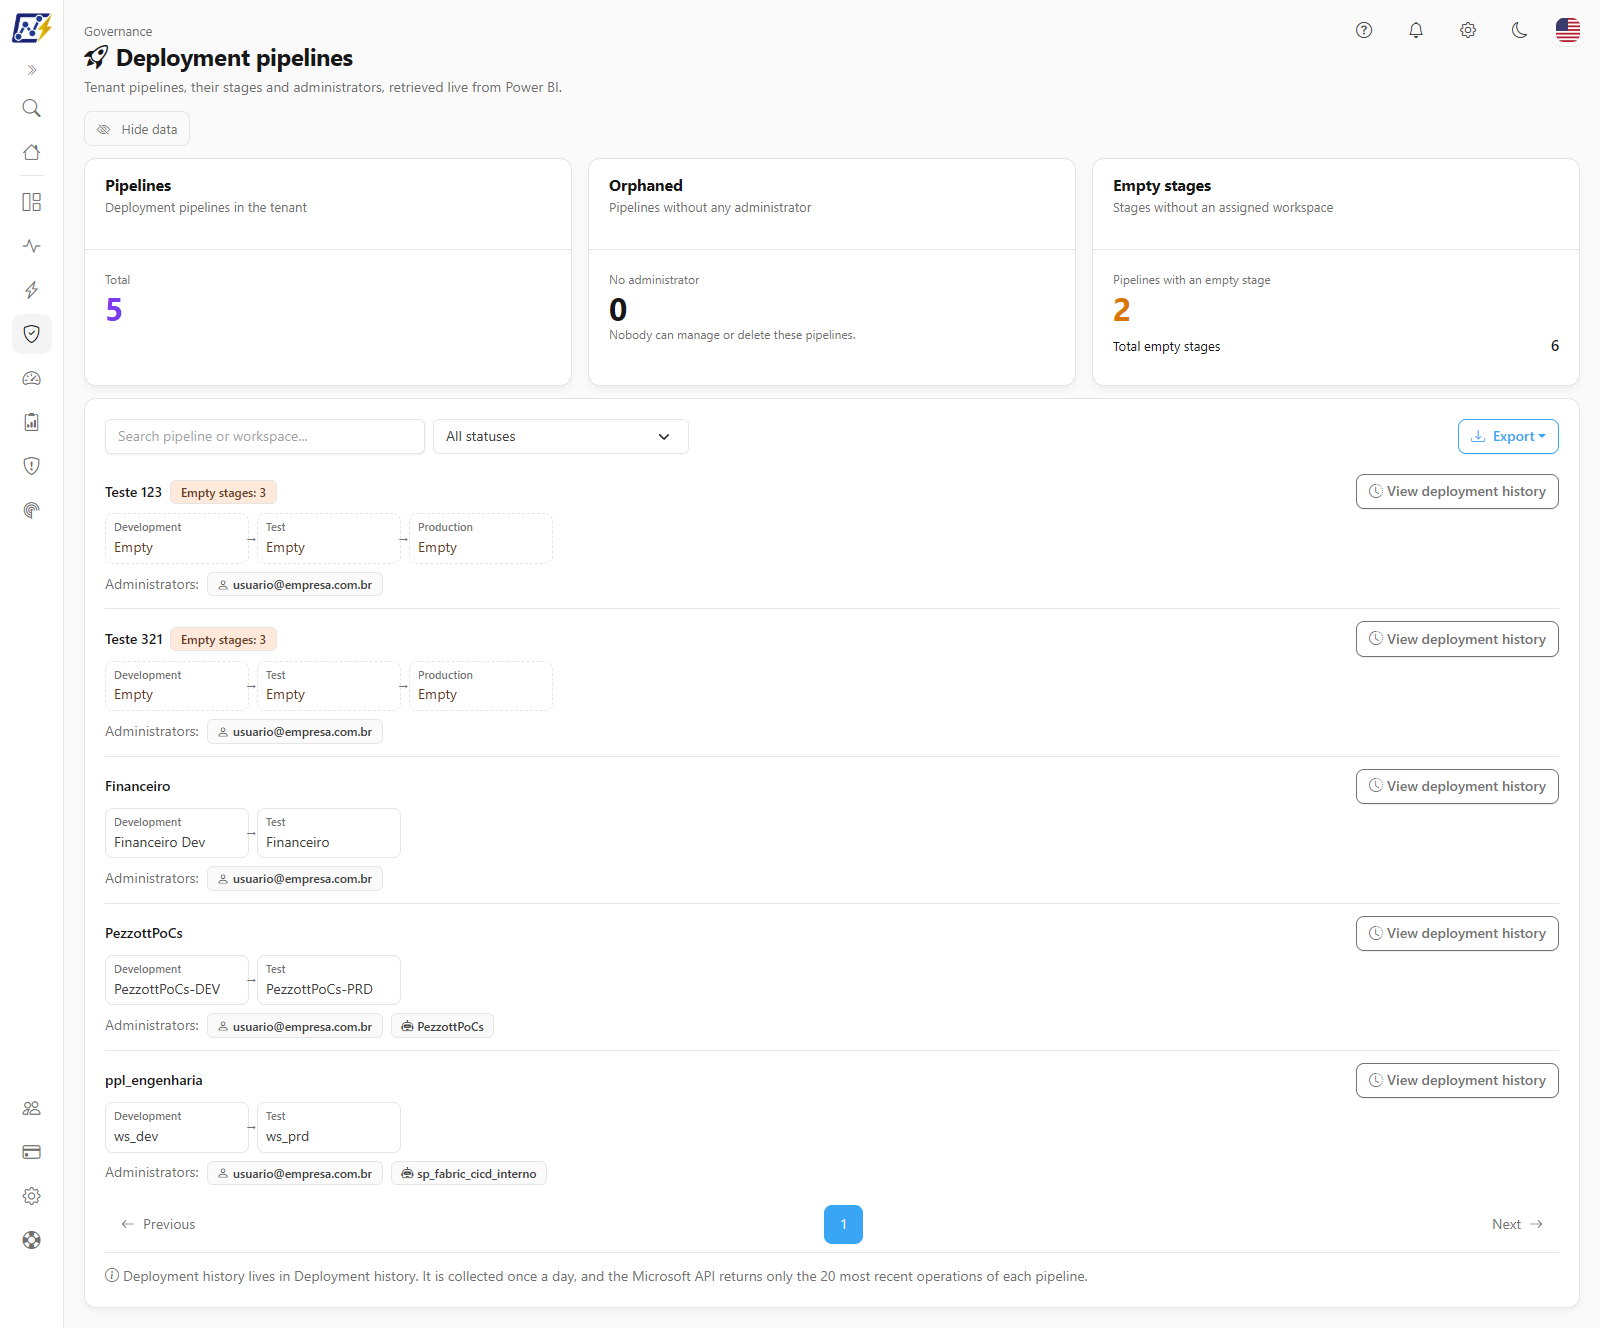
The **Deployment Pipelines** screen lists all the **deployment pipelines** of the Power BI/Fabric tenant, with the stage track of each one (for example, *Development → Test → Production*), the workspace assigned to each stage and who administers the pipeline. The data is **queried live** in Power BI every time the screen is opened.
The screen highlights two governance findings:
* **Orphaned pipelines**: pipelines without any administrator. Nobody can manage, deploy or delete these pipelines.
* **Empty stages**: stages without an assigned workspace, which indicate an incomplete or abandoned promotion flow.
**How to access:** menu *Governance › Operations › Deployment Pipelines*.
**Who can use it:** the screen is read-only and is available to **all profiles** (User and Administrator). It respects each user's **workspace scope** (see [Rules and behavior](#rules-and-behavior)) and can be hidden for specific users by the administrator, on the **Page access** tab of the [Users](/en/power-monitor/usuarios.md) record.
Governance › Operations › Deployment Pipelines
## What it is for
* **Inventory the lifecycle (ALM)**: know how many deployment pipelines exist in the tenant and which workspaces are part of each promotion flow.
* **Find orphaned pipelines**: identify pipelines left without an administrator (for example, when the only administrator left the company or was removed) and that, therefore, can no longer be managed by anyone through the Power BI interface.
* **Find incomplete flows**: locate pipelines with stages without a workspace, such as a pipeline created only with the Development stage and never completed.
* **Review who administers each pipeline**: check whether the administrators are people, groups or Service Principals and whether access is concentrated in a single account.
* **Find out which pipeline a workspace belongs to**: the search also looks for the names of the workspaces assigned to the stages.
* **Take the list elsewhere**: export the inventory to CSV or JSON for audits and action plans.
## Screen overview
From top to bottom, the screen has:
1. **Header** with the title **Deployment pipelines**, the subtitle *"Tenant pipelines, their stages and administrators, retrieved live from Power BI."* and the **Hide data** button.
2. **KPI cards**: **Pipelines**, **Orphaned** and **Empty stages**.
3. **Toolbar**: **Search pipeline or workspace...** search, **Status** selector and **Export** button.
4. **List of pipelines**, one block per pipeline, with badges, stage track and administrators, paginated 10 at a time.
5. **Footnote** that points to the [Deployment history](/en/power-monitor/governanca/operacao/historico-de-deploys.md).
## Features
### Pipelines card
**What it is:** the **Pipelines** card shows, in the **Total** indicator, how many deployment pipelines exist in the tenant and are visible to you.
**What it is for:** it gives the extent of ALM (application lifecycle management) usage in the tenant, for example, to track the adoption of pipelines in BI projects or to size a review.
KPI cards of the Deployment Pipelines screen
**How to use:**
1. Open *Governance › Operations › Deployment Pipelines* and wait for the Power BI query to finish (the cards show a loading indicator in the meantime).
2. Read the number in **Total**.
**How it works:** the three cards consider **all the pipelines you can see**, they **do not change** with the search or with the **Status** filter. Users with a restricted workspace scope see only the count of the pipelines in their scope.
### Orphaned card
**What it is:** the **Orphaned** card counts, in the **No administrator** indicator, the pipelines that do not have any administrator. The footer reminds you: *"Nobody can manage or delete these pipelines."*
**What it is for:** it is the most serious finding on the screen. An orphaned pipeline cannot be deployed, reconfigured or deleted through the Power BI interface, usually because the only administrator left the company or was removed.
**How to use:**
1. Check the number in **No administrator**. The card turns **red** when it is greater than zero; with zero, there are no pending issues of this type.
2. To see which ones they are, use the **Status › Orphaned (no administrator)** filter.
**How it works:** a pipeline is considered orphaned when Power BI reports that it **does not have any user, group or Service Principal** with administrator access.
### Empty stages card
**What it is:** the **Empty stages** card shows, in the **Pipelines with an empty stage** indicator, how many pipelines have at least one stage without an assigned workspace. The **Total empty stages** line adds up all the empty stages of all pipelines.
**What it is for:** it reveals incomplete or abandoned promotion flows, for example, a pipeline with Development configured and without Test or Production.
**How to use:**
1. Check the two numbers on the card. It turns **yellow** when there is at least one pipeline with an empty stage.
2. To list these pipelines, use **Status › With empty stage**.
**How it works:** an empty stage is a stage that has no workspace assigned in Power BI.
### Search by pipeline or workspace
**What it is:** the **Search pipeline or workspace...** field filters the list by free text.
**What it is for:** quickly finding a pipeline by name and, above all, **finding out which pipeline a workspace belongs to**, useful before moving, renaming or deleting a workspace.
Search, Status filter and Export
**How to use:**
1. Type the name (or part of the name) of the pipeline or workspace in **Search pipeline or workspace...**.
2. The list shows the pipelines that match the text. If you searched for a workspace, see in the stage track which stage (Development, Test, Production…) it is in.
3. To return to the complete list, delete the text.
**How it works:** the search looks in the pipeline's **name** and **description** and in the **names of the workspaces** assigned to the stages, without distinguishing uppercase from lowercase. The list is filtered as soon as you stop typing and returns to the first page.
### Status filter
**What it is:** the **Status** selector restricts the list by the pipeline's governance condition.
**What it is for:** separating what requires action (orphaned, empty stages) from what is in order.
**How to use:**
1. Click **Status** and choose an option:
* **All statuses** (default), all pipelines;
* **Orphaned (no administrator)**, only pipelines without an administrator;
* **With empty stage**, pipelines with at least one stage without a workspace;
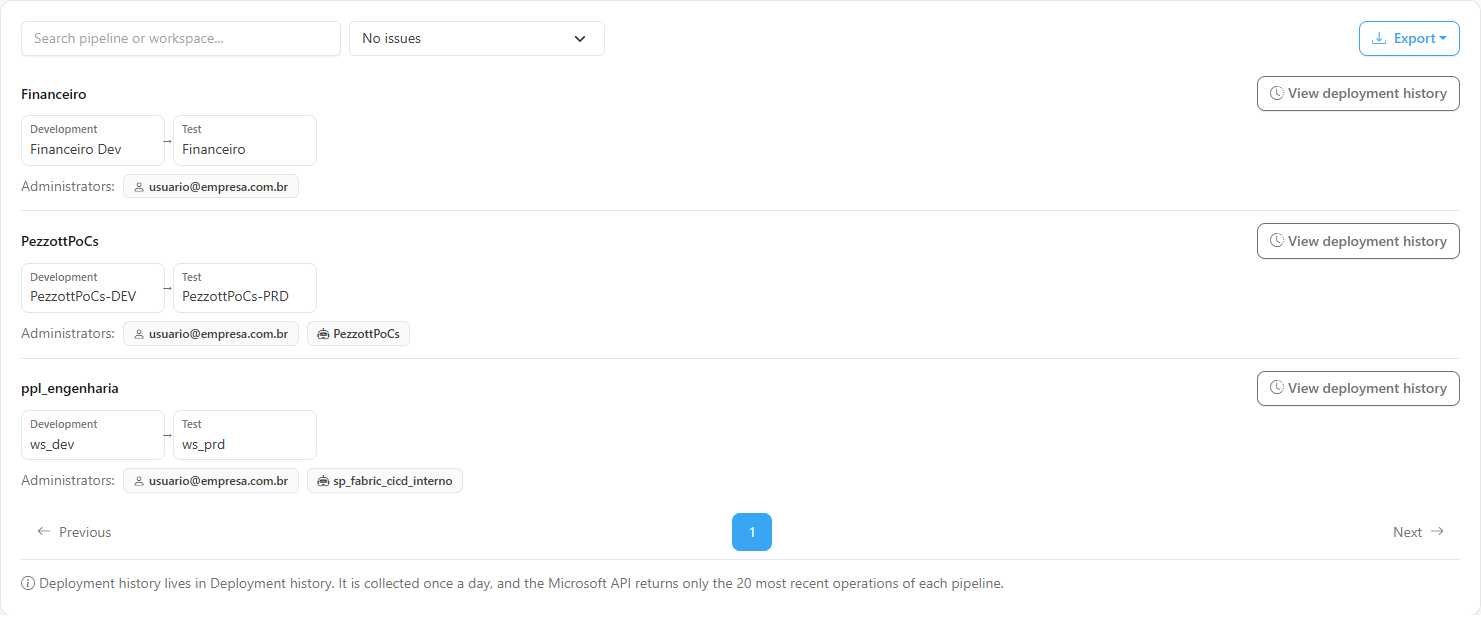
* **No issues**, pipelines that have at least one administrator **and** all stages with a workspace.
2. The list is updated immediately and returns to the first page. The filter can be combined with the search.
List filtered by Status › No issues
**How it works:** when no pipeline matches the search and the filter, **No pipelines match the filters** appears. To clear it, choose **All statuses** and delete the search text.
### Pipeline block: badges and stage track
**What it is:** each pipeline appears as a block with the **name**, the **description** (when there is one), the **finding badges** and the **stage track** in order, linked by arrows.
**What it is for:** understanding at a glance the pipeline's promotion flow, which workspaces are Development, Test and Production, and where it is incomplete.
Pipeline with an empty stage
**How to use (reading the block):**
1. Next to the name, check the badges:
* **Orphaned** (red): the pipeline has no administrator;
* **Empty stages: N** (yellow): number of stages without an assigned workspace.
2. On the track, each stage shows the **stage name** and the **assigned workspace**. A stage without a workspace appears with a **dashed border** and the **Empty** indication.
3. Hover over a long workspace name to see it in full.
**How it works / rules:**
* **Stage names:** pipelines with up to three stages use the Power BI default names, **Development**, **Test** and **Production**, in that order. Pipelines with more than three stages are displayed as **Stage 1**, **Stage 2**, **Stage 3**…, because they may have custom names.
* **Workspace names:** when the workspace is already known to the Power Monitor inventory, the name registered in Power Monitor is displayed; otherwise, the name reported by Power BI.
* **Workspace outside your scope:** the stage has a workspace, but the name is hidden and **Not reported** appears (different from **Empty**, which is a stage that really has no workspace).
### Pipeline administrators
**What it is:** the **Administrators** line of each block shows one badge per pipeline administrator, with an icon indicating the type: **person** (user), **group** (Microsoft Entra ID group) or **robot** (application/Service Principal).
**What it is for:** reviewing who can manage and deploy each pipeline, identifying access concentrated in a single person (risk of the pipeline becoming orphaned) and confirming whether production pipelines are administered by groups or Service Principals.
**How to use:**
1. Locate the pipeline using the search or by browsing the list.
2. On the **Administrators** line, check the badges and their icons.
3. Hover over a badge to see the **access level** of that administrator.
4. When the pipeline has no administrator, **No administrators** appears in red.
**How it works:** users appear by their sign-in address. With the **Hide data** button on, people's names in the badges are masked; groups and applications stay readable. For groups and applications, Power Monitor looks up the name in Microsoft Entra ID on a best-effort basis; when it cannot (for example, without directory read permission), the badge shows the **identifier (ID)** of the group or application, without interrupting the listing.
### Sorting and pagination
**What it is:** the list is sorted automatically and paginated.
**What it is for:** ensuring that what requires action appears at the top, without having to sort manually.
**How to use:**
1. Browse the list from top to bottom: first come the **orphaned pipelines**, then those with the **most empty stages** and, finally, the others in **alphabetical order**.
2. Use the page controls below the list and the **Items per page** selector (10, 25, 50 or 100) to see more pipelines at once.
**How it works:** by default, **10 pipelines per page** are displayed. There is no manual sorting. Changing the search, the filter or the page size returns to the first page.
### Export (CSV or JSON)
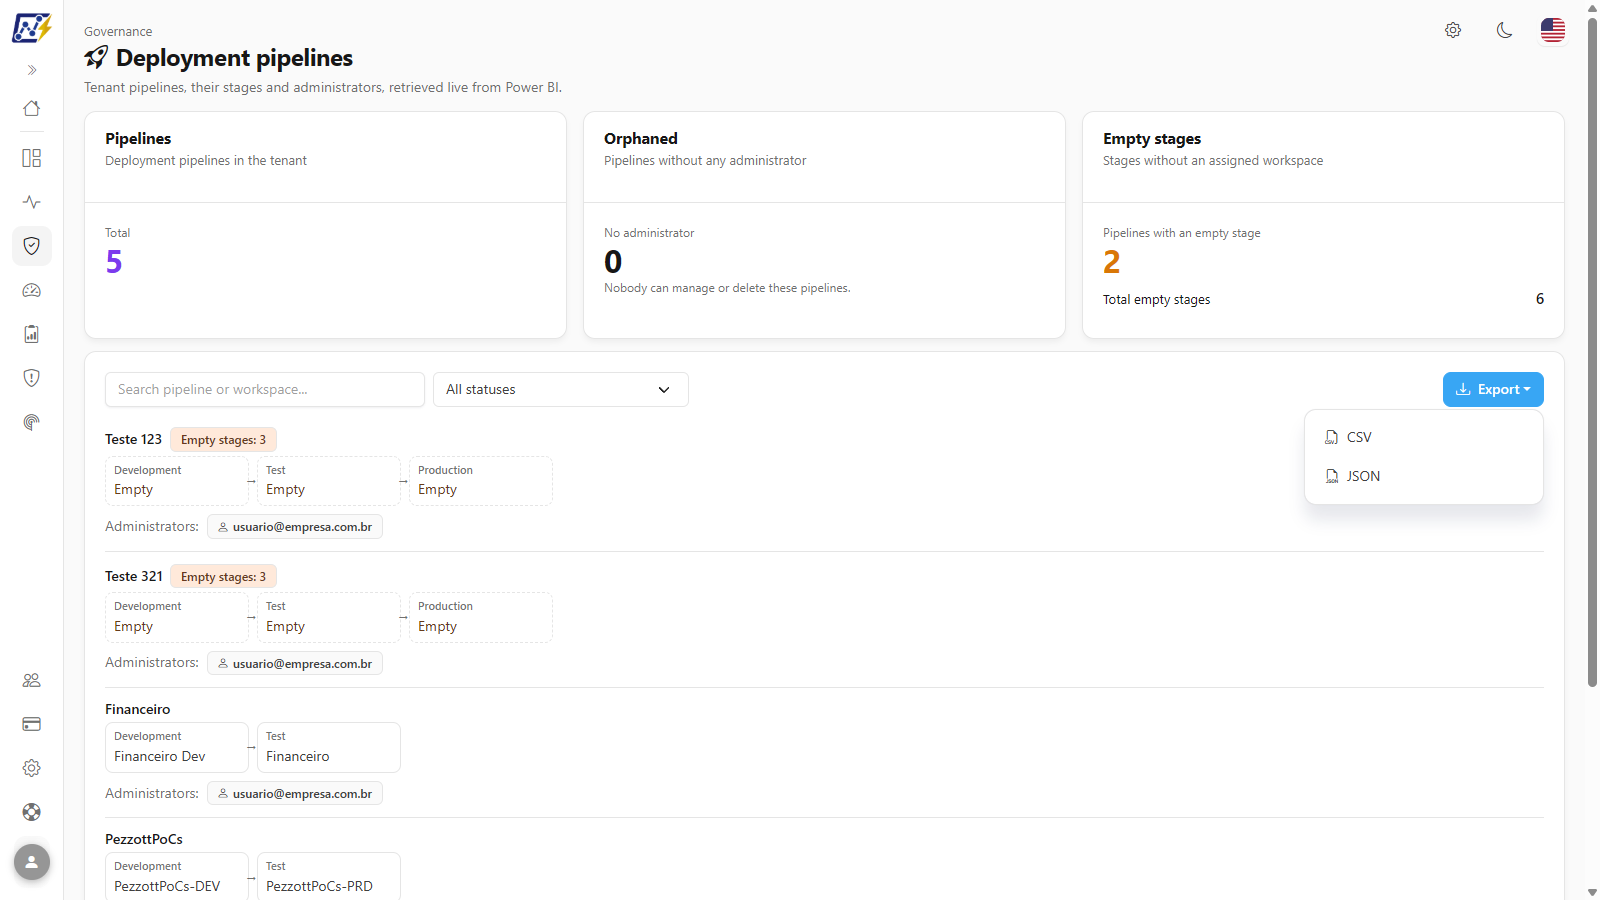
**What it is:** the **Export** button downloads the pipeline inventory in **CSV** or **JSON**.
**What it is for:** taking the list to spreadsheets, audits, action plans or scripts.
Export menu
**How to use:**
{% stepper %}
{% step %}
### Adjust the list
Use the search and the **Status** selector to leave in the list only the pipelines you want to export. To export everything, leave the search empty and **All statuses** selected.
{% endstep %}
{% step %}
### Choose the format
Click **Export** and choose **CSV** or **JSON**.
{% endstep %}
{% step %}
### Open the file
The browser downloads the file `pipelines-de-implantacao-YYYY-MM-DD.csv` (or `.json`), with the current date in the name. All pages of the filtered list are included.
{% endstep %}
{% endstepper %}
**How it works:** it exports **all the pipelines that match the current search and filter** (not just the visible page). The button is disabled when the list is empty. With **Hide data** on, people's names in the **Administrators** column (CSV) and in the JSON administrators are masked.
**CSV columns:**
| Column | Content |
| ------------------ | --------------------------------------------------------------------------------------------------------------- |
| **Pipeline** | Pipeline name |
| **Description** | Pipeline description (empty when there is none) |
| **Orphaned** | **Yes** or **No** |
| **Stages** | Number of stages |
| **Empty stages** | Number of stages without a workspace |
| **Stages** | Track as text, for example `Development: Sales DEV \| Test: Empty \| Production: Sales` |
| **Administrators** | Text list with the name (or identifier), type (`User`, `Group` or `App`) and access level of each administrator |
The **JSON** contains the same pipelines in a structured format (stages and administrators as lists), useful for integrations and scripts.
### Deployment history
**What it is:** the **View deployment history** button, in the header of each pipeline block, and the footnote *Deployment history lives in Deployment history. It is collected once a day and the Microsoft API returns only the 20 most recent operations of each pipeline.*
**What it is for:** going straight to the deployments of that pipeline (who deployed what, from which stage to which, when and whether it worked), without repeating the search.
**How to use:** click **View deployment history** on the desired pipeline. The [Deployment history](/en/power-monitor/governanca/operacao/historico-de-deploys.md) screen opens already filtered by the pipeline name.
**How it works:** this screen still shows only the inventory (stages and administrators), queried live. The deployment history comes from a daily collection and, because the Microsoft API returns only the 20 most recent operations of each pipeline, it may have gaps in pipelines with many deployments per day.
### Empty states and error warnings
**What it is:** messages displayed in place of the list when there is no data or the query fails.
**What it is for:** knowing whether the list is actually empty, whether the filter is too restrictive or whether something needs to be configured.
| Message | Meaning |
| --------------------------------------------- | ---------------------------------------------------------------------------------------------------------------------------------------------------------------- |
| **No deployment pipelines found** | The query worked, but there are no pipelines in the tenant (or none has a stage in a workspace in your scope) |
| **No pipelines match the filters** | There are pipelines, but none matches the current search and status filter |
| **Finish the installation to use this audit** | The organization's Service Principal is not configured. Administrators see the **Go to Settings** button; everyone sees **Try again** |
| **Could not load the audit** | The Power BI query failed (for example, missing read permission for the admin APIs, Microsoft call limit reached or temporary unavailability). Use **Try again** |
**How to resolve the "Finish the installation to use this audit" warning:**
{% stepper %}
{% step %}
### Go to Settings (Administrator)
An **Administrator** clicks **Go to Settings** on the warning itself, which opens *Settings › Organization*. Users without the administrator profile do not see this button and must contact an administrator.
{% endstep %}
{% step %}
### Complete the integration
Fill in and save the Microsoft / Power BI integration data as described in [Organization](/en/power-monitor/configuracoes/organizacao.md) and the [installation prerequisites](/en/technical-documentation/instalacao/pre-requisitos.md).
{% endstep %}
{% step %}
### Try again
Go back to *Governance › Operations › Deployment Pipelines* and click **Try again**.
{% endstep %}
{% endstepper %}
If the message is **Could not load the audit**, check whether the tenant setting that allows Service Principals to use the Power BI read-only admin APIs is enabled for the application's group (the same one required by the inventory) and click **Try again** after a few moments.
## How to use: common tasks
### How to find and handle orphaned pipelines
{% stepper %}
{% step %}
### Open the screen
In the menu, go to *Governance › Operations › Deployment Pipelines* and wait for the Power BI query to finish.
{% endstep %}
{% step %}
### Check the Orphaned card
The number in **No administrator** shows how many pipelines are orphaned. If it is zero, there are no pending issues of this type.
{% endstep %}
{% step %}
### Filter the list
In the **Status** selector, choose **Orphaned (no administrator)**. The list shows only the pipelines with the **Orphaned** badge and the **No administrators** indication.
{% endstep %}
{% step %}
### Handle the pipelines in Power BI
Power Monitor does not change pipelines. A Fabric administrator must assign a new administrator (or delete the pipeline, if it is no longer used) through the Power BI portal or the Microsoft admin APIs. The next time the screen is opened, the pipeline no longer appears as orphaned.
{% endstep %}
{% endstepper %}
### How to find pipelines with empty stages
{% stepper %}
{% step %}
### Check the Empty stages card
In *Governance › Operations › Deployment Pipelines*, the **Empty stages** card shows how many pipelines have a stage without a workspace (**Pipelines with an empty stage**) and how many empty stages exist in total (**Total empty stages**).
{% endstep %}
{% step %}
### Filter the list
In the **Status** selector, choose **With empty stage**. Pipelines with the most empty stages appear first.
{% endstep %}
{% step %}
### Identify the stage without a workspace
On the track of each pipeline, the empty stage appears with a dashed border and the **Empty** indication. The **Empty stages: N** badge next to the name summarizes the number.
{% endstep %}
{% step %}
### Decide with the owner
With the administrators listed in the block itself, check whether the pipeline should be completed (by assigning a workspace to the stage in Power BI) or deleted.
{% endstep %}
{% endstepper %}
## Rules and behavior
* **Data source:** the list comes directly from the **Power BI admin APIs** (inventory of deployment pipelines with stages and users), using the organization's Service Principal. It does not depend on any Power Monitor scan: pipelines created or changed in Power BI appear the next time the screen is opened or reloaded.
* **Live query, no cache:** each time the screen is opened, a new query is made to Power BI. Microsoft limits this API to about **200 calls per hour** per tenant; if the limit is reached, the screen shows **Could not load the audit** and you just need to try again later.
* **Required tenant permission:** the same Fabric tenant setting that allows the Service Principal to use the **read-only admin APIs**, already required by the Power Monitor inventory. No additional permission is needed.
* **Orphaned:** a pipeline is considered orphaned when Power BI reports that it **has no administrator**.
* **Empty stage:** a stage that has no assigned workspace.
* **Workspace scope:** users with visibility restricted to some workspaces see only the pipelines that have **at least one stage in a workspace in their scope**. In stages assigned to workspaces outside the scope, the workspace name is hidden (**Not reported** appears). The KPIs and the export consider only what the user sees. Users without restrictions see all the tenant's pipelines.
* **Deployment history:** it is not displayed on this screen. It lives in [Deployment history](/en/power-monitor/governanca/operacao/historico-de-deploys.md), fed by a daily collection (see the **Deployment history** feature).
* **Read-only:** the screen does not create, change, deploy or delete pipelines. These actions are done in Power BI.
## Frequently asked questions
Why does a pipeline appear as orphaned if I know someone uses it?
Power BI reported that the pipeline does not have any user, group or Service Principal with administrator access. This usually happens when the only administrator's account was deleted or they were removed from the pipeline. Whoever still "uses" the pipeline probably only has access to the stage workspaces, not to the pipeline itself. A Fabric administrator needs to assign a new administrator through the admin APIs or the Power BI portal.
I just created a pipeline. Do I need to wait for a scan?
No. The screen queries Power BI live; just open (or reload) the page.
Why don't I see all the tenant's pipelines?
If your user has visibility restricted to some workspaces, you see only the pipelines with at least one stage in a workspace in your scope. Also check whether the search or the **Status** filter is reducing the list.
Why does a stage show "Not reported" instead of the workspace name?
The stage has a workspace assigned, but that workspace is outside your visibility scope, so the name is hidden. A stage that really has no workspace appears as **Empty**, with a dashed border.
Why does an administrator appear as a code instead of a name?
For groups and applications (Service Principals), Power Monitor looks up the name in Microsoft Entra ID. When this lookup is not possible, the object's identifier (ID) in Entra ID is displayed.
Can I see the deployment history (who deployed what and when)?
Yes, on the [Deployment history](/en/power-monitor/governanca/operacao/historico-de-deploys.md) screen, which shows the deployments between stages with who ran them, when, the duration and the result. It is accumulated by a daily collection and, because the Microsoft API returns only the 20 most recent operations of each pipeline, it may have gaps.
Can I fix the pipeline through Power Monitor?
No. The screen is a read-only audit. Assigning workspaces, adding administrators and deleting pipelines are done in Power BI.
## Related pages
* [Workspaces](/en/power-monitor/governanca/workspaces.md)
* [Departed Owners](/en/power-monitor/governanca/conformidade/responsaveis-desligados.md): workspace administrators whose accounts were blocked or deleted
* [Schedules](/en/power-monitor/governanca/operacao/agendamentos.md)
* [Deployment history](/en/power-monitor/governanca/operacao/historico-de-deploys.md)
* [Deleted Artifacts](/en/power-monitor/governanca/operacao/artefatos-excluidos.md)
* [Organization (Settings)](/en/power-monitor/configuracoes/organizacao.md)
* [Users](/en/power-monitor/usuarios.md)
* [Installation prerequisites](/en/technical-documentation/instalacao/pre-requisitos.md)
---
# Agent Instructions
This documentation is published with GitBook. GitBook is the documentation platform designed so that both humans and AI agents can read, navigate, and reason over technical content effectively. Learn more at gitbook.com.
## Querying This Documentation
If you need additional information that is not directly available in this page, you can query the documentation by asking a question.
Perform an HTTP GET request on the following URL with the `ask` and `goal` query parameters:
```
GET https://docs.powermonitor.com.br/en/power-monitor/governanca/operacao/pipelines-de-implantacao.md?ask=&goal=
```
`ask` is the immediate question: it should be specific, self-contained, and written in natural language.
`goal` is what the user is ultimately trying to achieve, the reason they need the answer. Sharing it helps GitBook give you a better, more relevant answer. A goal is most helpful when it describes the outcome the user wants rather than restating the question. For example, with `ask=how do I create an API token`, a goal like `automate deployments from our CI pipeline` lets GitBook tailor the answer to that use case.
The response will contain a direct answer to the question and relevant excerpts and sources from the documentation.
Use this mechanism when the answer is not explicitly present in the current page, you need clarification or additional context, or you want to retrieve related documentation sections.