> For the complete documentation index, see [llms.txt](https://docs.powermonitor.com.br/llms.txt). Markdown versions of documentation pages are available by appending `.md` to page URLs; this page is available as [Markdown](https://docs.powermonitor.com.br/en/power-monitor/governanca/relatorios.md).

# Reports

Inventory of the tenant's Power BI reports, with the structure of pages and visuals, file download, PDF/PowerPoint export, bulk actions, and shortcuts to Power BI.

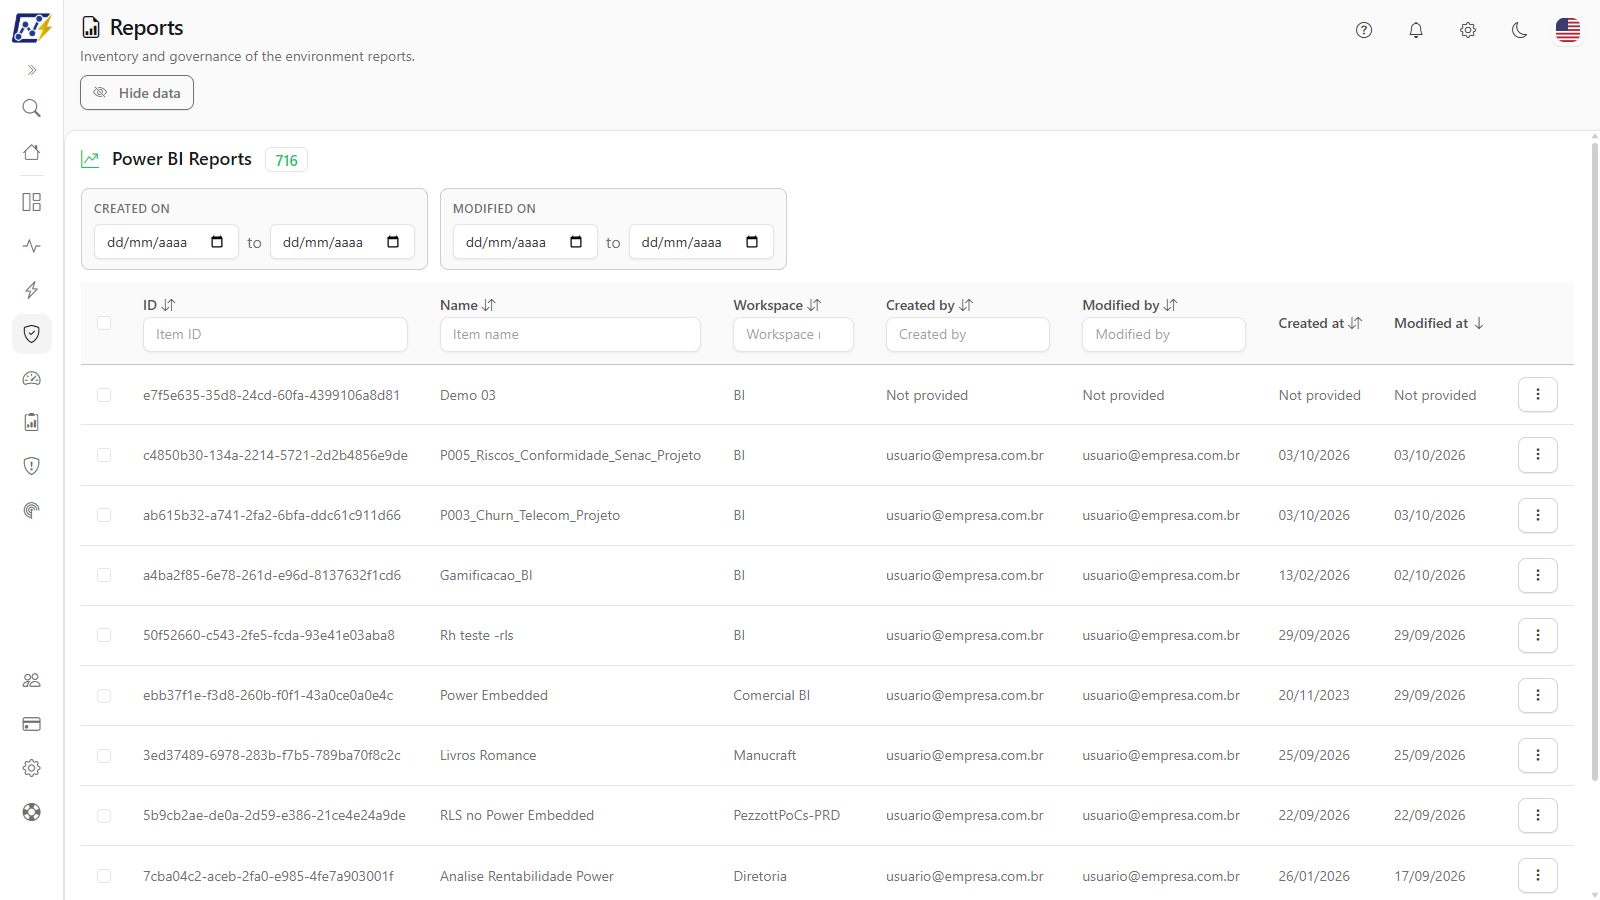
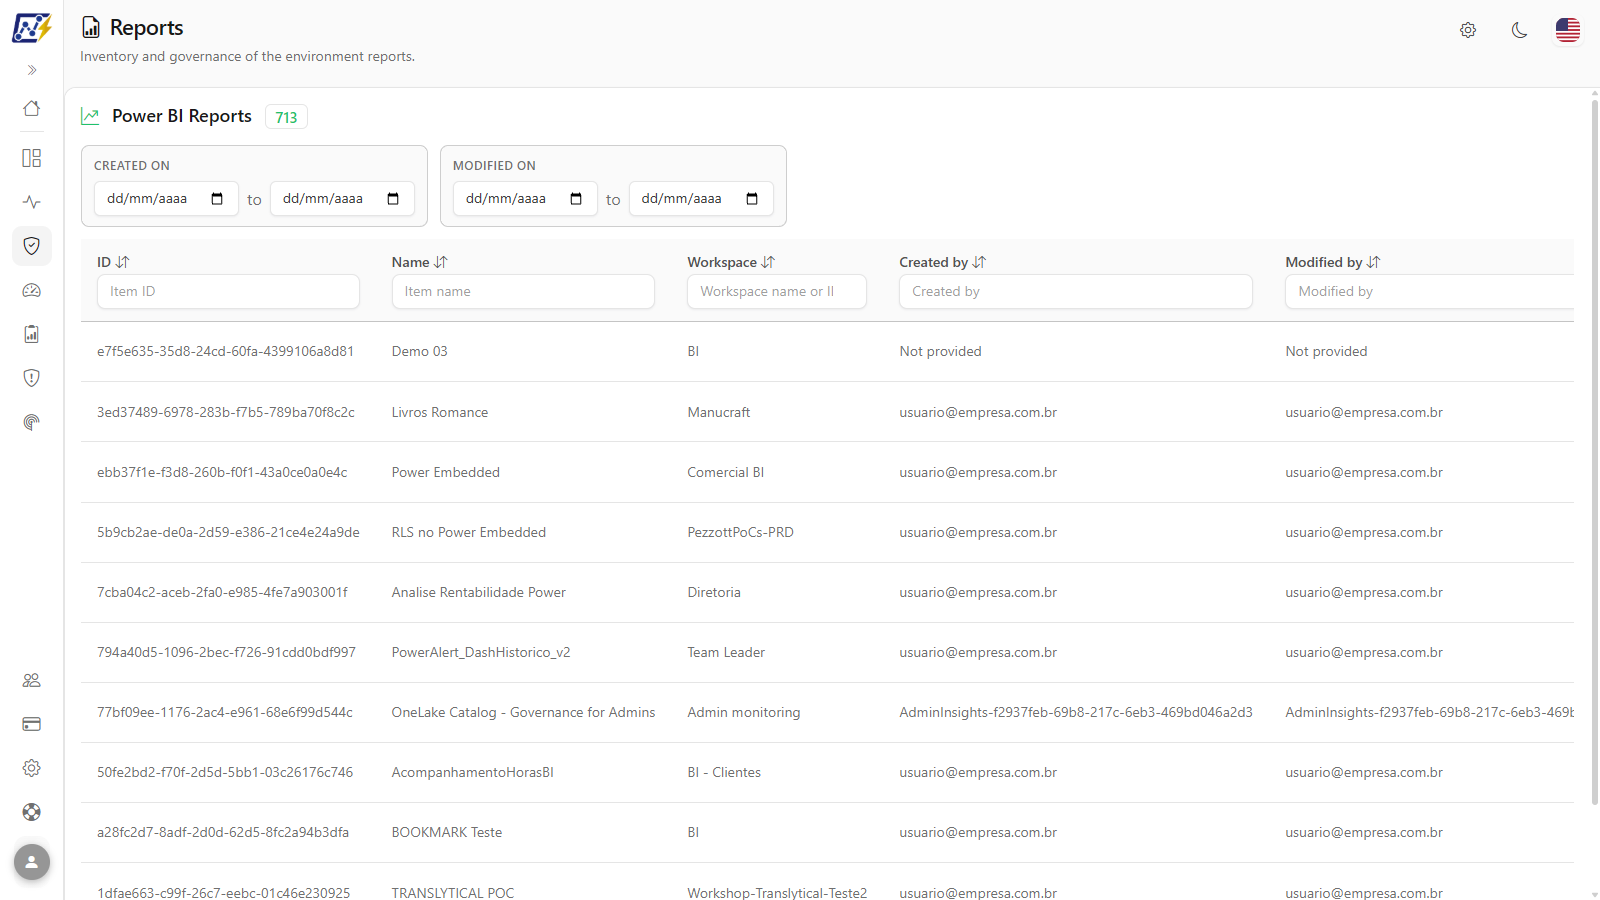
The **Reports** screen is the inventory of the **Power BI reports** (interactive reports, `.pbix` files) published in the tenant's monitored workspaces. It shows who created and who modified each report, when that happened and the captured structure of the report (pages, visuals, fields), and it lets you download the original file or export it to PDF/PowerPoint without leaving Power Monitor.

**How to access:** menu *Governance › Reports › Reports*. The screen is available to all user profiles.

<figure><picture><source srcset="/files/mUiUFJBjRASEm4XimQJx" media="(prefers-color-scheme: dark)"><img src="https://3938213054-files.gitbook.io/~/files/v0/b/gitbook-x-prod.appspot.com/o/spaces%2FH2bFRBmIfyK3kwVKbldl%2Fuploads%2Fgit-blob-e02f8c0a3c2d086b8617e1a8707a4dd8a9b086a0%2Fpm-governanca-relatorios-en.png?alt=media" alt="Power BI Reports inventory screen, with date filters and the reports table"></picture><figcaption><p>Power BI Reports inventory</p></figcaption></figure>

## The "Reports" menu group

In the side menu, *Governance › Reports* is a collapsible group with one screen per type of consumption artifact:

| Menu item             | What it lists                               | Page                                                                                 |
| --------------------- | ------------------------------------------- | ------------------------------------------------------------------------------------ |
| **Reports**           | Interactive Power BI reports (`.pbix`)      | this page                                                                            |
| **Paginated Reports** | Paginated reports (`.rdl`)                  | [Paginated Reports](/en/power-monitor/governanca/relatorios/relatorios-paginados.md) |
| **Dashboards**        | Power BI dashboards                         | [Dashboards](/en/power-monitor/governanca/relatorios/dashboards.md)                  |
| **KQL Dashboards**    | Fabric Real-Time Dashboards                 | [KQL Dashboards](/en/power-monitor/governanca/relatorios/kql-dashboards.md)          |
| **Apps**              | Power BI apps and workspace apps (Org Apps) | [Apps](/en/power-monitor/governanca/relatorios/apps.md)                              |
| **Explorations**      | Power BI Explorations                       | [Explorations](/en/power-monitor/governanca/relatorios/exploracoes.md)               |
| **Metric Sets**       | Metric Sets                                 | [Metric Sets](/en/power-monitor/governanca/relatorios/conjuntos-de-metricas.md)      |

The "Publish to web" links ([Public Links](/en/power-monitor/governanca/conformidade/links-publicos.md)) and the organization-wide links ([Organization-wide Links](/en/power-monitor/governanca/conformidade/links-para-toda-a-organizacao.md)) are in the [Compliance](/en/power-monitor/governanca/conformidade.md) group, together with the other content exposure audits.

{% hint style="info" %}
Paginated reports **do not appear** on this screen: they have their own [Paginated Reports](/en/power-monitor/governanca/relatorios/relatorios-paginados.md) screen. Only interactive Power BI reports are included here.
{% endhint %}

## What it is for

* **Audit authorship and changes:** find out who published and who last modified a report, and when.
* **Find abandoned reports:** filter by an old modification date to identify candidates for archiving before a migration or environment cleanup.
* **Keep or share a copy:** download the original `.pbix` or export the report to PDF/PowerPoint for an audit, without needing direct access to the workspace.
* **Understand the complexity of a report:** the *Report Structure* tab shows how many pages, visuals, tables, columns, measures and filters it uses.
* **Quickly reach the model behind the report:** open the semantic model in Power BI or directly on its settings page (credentials, scheduled refresh, etc.).

## Common structure of the lists

All Governance artifact inventory screens (Reports, Paginated Reports, Dashboards, Apps, Explorations, Metric Sets, Semantic Models, Storage, Fabric Mirroring, Real Time and the others) follow the same pattern. Once you know one, you know them all:

| Element              | How it works                                                                                                                                                                                                                                                                                                    |
| -------------------- | --------------------------------------------------------------------------------------------------------------------------------------------------------------------------------------------------------------------------------------------------------------------------------------------------------------- |
| **Counters (KPIs)**  | Cards or a badge with the total number of items in the list. On screens with several types (e.g. [Storage](/en/power-monitor/governanca/armazenamento.md), [Real Time](/en/power-monitor/governanca/dados-e-engenharia/tempo-real.md)) each card is also a **tab**: clicking it filters the table by that type. |
| **Header filters**   | Each filterable column has the filter field just below the title (text, selection list or date range). The list is updated automatically as you type.                                                                                                                                                           |
| **Sorting**          | Click the column title to sort: the first click sorts in **descending** order and the second reverses it. The arrow next to the title indicates the current column and direction.                                                                                                                               |
| **Pagination**       | 10 items per page by default, with navigation in the table footer. On screens that have the **Items per page** selector, you can choose 10, 25, 50 or 100; changing it returns the list to the first page, keeping the filters.                                                                                 |
| **Row click**        | Opens the artifact's **details modal** (on screens that have a modal).                                                                                                                                                                                                                                          |
| **Actions menu (⋮)** | Button at the end of the row. The same menu opens by **right-clicking** anywhere on the row.                                                                                                                                                                                                                    |
| **Open details**     | First item of the menu. Clicking it opens the modal on the *Overview* tab; hovering over it reveals a submenu to directly open a specific tab (*Users & Permissions*, *Dependencies*, etc.).                                                                                                                    |
| **Open in Power BI** | Opens the artifact in the Power BI/Fabric portal in a new browser tab. You need to have access to the artifact in Power BI to view it.                                                                                                                                                                          |

### The details modal

The details modal is shared by the Governance screens and always has the same basic tabs, plus specific tabs depending on the artifact type:

| Tab                     | Content                                                                                                                                                                                                                                                                                                                                                                                                                               |
| ----------------------- | ------------------------------------------------------------------------------------------------------------------------------------------------------------------------------------------------------------------------------------------------------------------------------------------------------------------------------------------------------------------------------------------------------------------------------------- |
| **Overview**            | The item's indicators at the top and the properties organized in sections (Identification, Dates, Governance and security, Capacity and location, Content and the type's technical sections). See [The Overview tab](#the-overview-tab).                                                                                                                                                                                              |
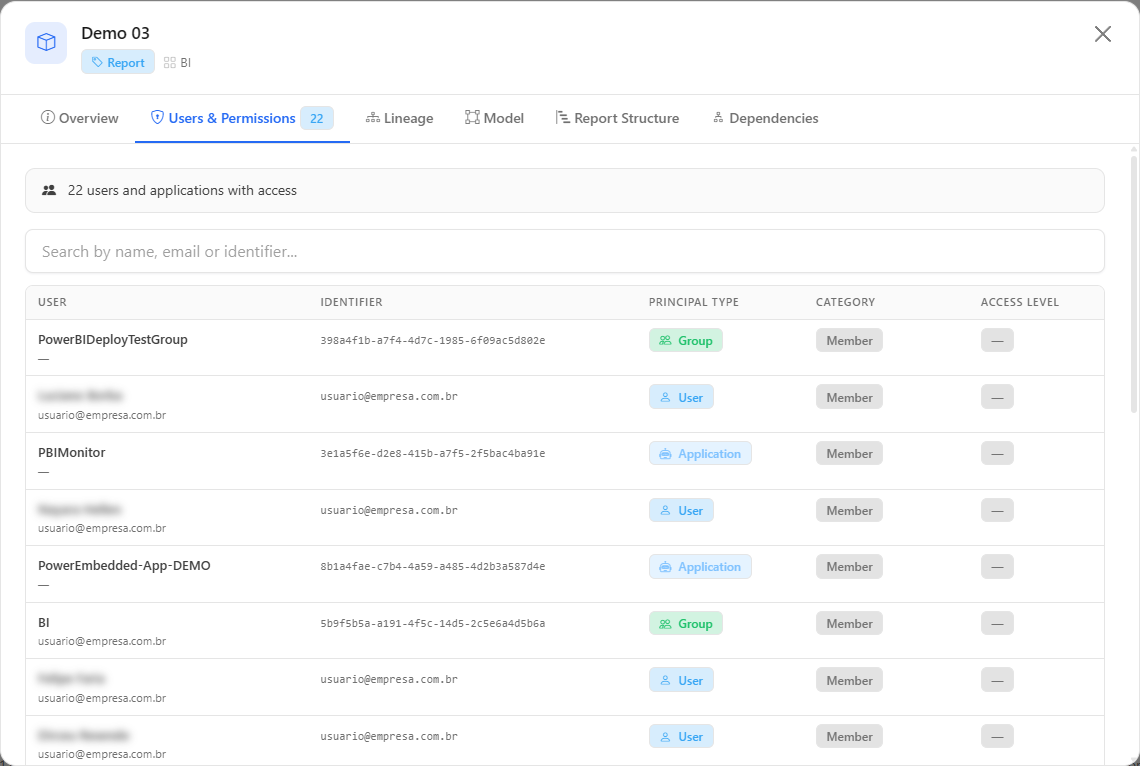
| **Users & Permissions** | Who has access to the artifact: the summary "*N* users and applications with access", search by name, e-mail or identifier and the **User**, **Identifier**, **Principal Type** (User, Application or Group), **Category** (Member or Guest/External) and **Access Level** columns.                                                                                                                                                   |
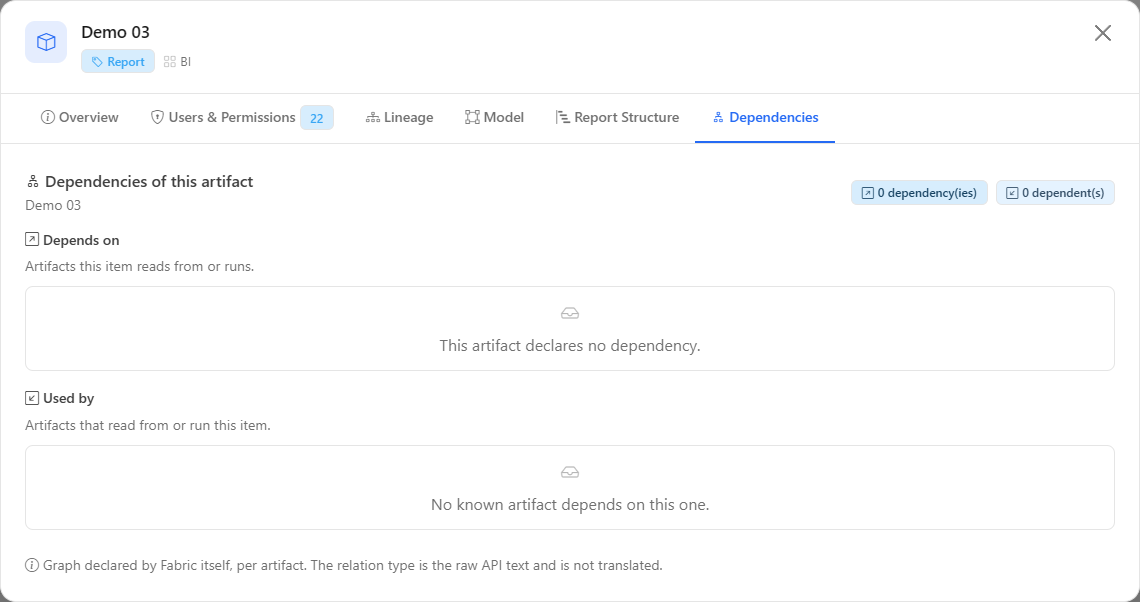
| **Dependencies**        | The dependency graph declared by Fabric itself, in two lists: **Depends on** (artifacts that this item reads or runs) and **Used by** (artifacts that read or run this item), with the **Artifact**, **Type**, **Relation type** and **Identifier** columns. Dependencies pointing to something outside the monitored scope appear as "Unidentified artifact". The tab only exists for artifact types that participate in this graph. |
| **Best Practices**      | The report's best practices score (Power BI and paginated reports): overall score, categories and problems found, with a recommendation for each one. See [Report Best Practices Score](/en/power-monitor/qualidade-de-dados/score-de-boas-praticas-de-relatorios.md).                                                                                                                                                                |
| Specific tabs           | *Lineage*, *Model*, *Report Structure*, *Schedules*, *Sync*, *Artifacts*: described on the page of each screen.                                                                                                                                                                                                                                                                                                                       |

<figure><picture><source srcset="/files/cTYPg62OsXGRvQLtNrbD" media="(prefers-color-scheme: dark)"><img src="https://3938213054-files.gitbook.io/~/files/v0/b/gitbook-x-prod.appspot.com/o/spaces%2FH2bFRBmIfyK3kwVKbldl%2Fuploads%2Fgit-blob-e623b4d35cf7381c8d785e60ac9353fd98966680%2Fpm-governanca-modal-detalhes-dependencias-en.png?alt=media" alt="Dependencies tab of the details modal, with the Depends on and Used by lists"></picture><figcaption><p>Dependencies tab of the details modal</p></figcaption></figure>

### The Overview tab

The **Overview** tab has the same layout in every Governance details modal: the artifact modals and also those of [Workspaces](/en/power-monitor/governanca/workspaces.md), [Capacities](/en/power-monitor/governanca/infraestrutura/capacidades.md), [Gateways](/en/power-monitor/governanca/infraestrutura/gateways.md), [Domains](/en/power-monitor/governanca/tenant/dominios.md), [Workspace Git](/en/power-monitor/governanca/operacao/git-dos-workspaces.md), [Deleted Artifacts](/en/power-monitor/governanca/operacao/artefatos-excluidos.md), [Departed Owners](/en/power-monitor/governanca/conformidade/responsaveis-desligados.md) and [Power BI Licenses](/en/power-monitor/governanca/tenant/licencas-power-bi.md). Once you know one, you can read them all.

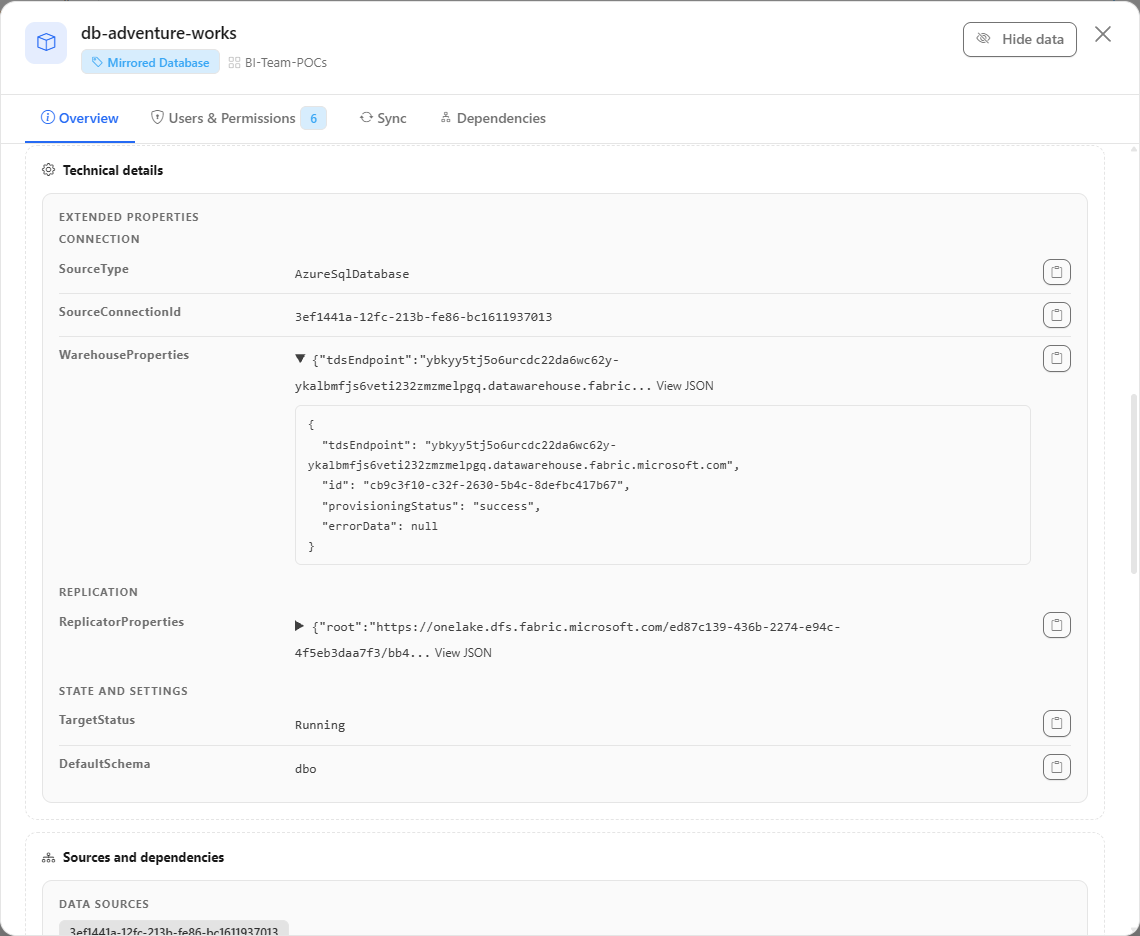
<figure><picture><source srcset="/files/T41UdJkRJqxAlYvjf0uM" media="(prefers-color-scheme: dark)"><img src="https://3938213054-files.gitbook.io/~/files/v0/b/gitbook-x-prod.appspot.com/o/spaces%2FH2bFRBmIfyK3kwVKbldl%2Fuploads%2Fgit-blob-19182f42827a5098f57eb6457254422b3857682c%2Fpm-governanca-modal-visao-geral-propriedades-en.png?alt=media" alt="Overview tab of a Fabric item with the indicators at the top, the Identification and Dates sections and the Technical details section with the properties grouped into Connection and State and settings"></picture><figcaption><p>Overview with the technical properties grouped</p></figcaption></figure>

| Part                         | What it shows                                                                                                                                                                                                                                                                                |
| ---------------------------- | -------------------------------------------------------------------------------------------------------------------------------------------------------------------------------------------------------------------------------------------------------------------------------------------- |
| **Removal banner**           | When the item no longer exists in the tenant, a yellow banner at the top says "Removed from Fabric/Power BI since *date*.".                                                                                                                                                                  |
| **Indicators**               | Large numbers at the top, specific to each type (for example, artifacts and identities with access for a workspace, reports and data sources for a semantic model). An indicator without data shows "—". Some are loaded after the modal opens; meanwhile a skeleton appears in their place. |
| **Identification**           | ID (with **Copy**), Remote ID, Name, Type, State, Monitored and Read-only.                                                                                                                                                                                                                   |
| **Dates**                    | Created at, Modified at, Last activity, Created by and Modified by.                                                                                                                                                                                                                          |
| **Governance and security**  | Sensitivity label, Endorsement (with who certified it), Responsible person, Business Area Contact, Criticality, Business Area and Sub-Area and, for the types that allow it, the **Monitor execution duration deviation** switch.                                                            |
| **Capacity and location**    | Workspace, Workspace type, Capacity, Dedicated capacity and, for workspaces, Size and storage format.                                                                                                                                                                                        |
| **Content**                  | Description and Tags.                                                                                                                                                                                                                                                                        |
| **Technical details**        | Properties specific to the type (for example, SQL endpoint, OneLake paths, refresh schedule, relations and extended properties).                                                                                                                                                             |
| **Sources and dependencies** | Data sources and items the artifact depends on, when the type reports them.                                                                                                                                                                                                                  |

**How it works:**

* **Empty sections are hidden.** Each field only appears when the data exists, and a section with no fields is not displayed. The modals that are not for artifacts (capacities, gateways, domains etc.) use the same indicators and the same section format, with sections specific to their subject.
* **Technical properties as a list.** Key/value properties appear as a readable list, with the key on the left and the value on the right. When there are properties on more than one theme, the list is grouped into **Connection**, **Replication**, **State and settings** and **Other properties**.
* **Long values and JSON.** A long value appears collapsed to a few lines, with **Show more** / **Show less**. A JSON value appears indented inside a collapsible **View JSON** block. The copy button next to each value copies the **full** value.
* **Hide data.** On the screens that have the **Hide data** button, the names and e-mails of people on this tab are also masked.

### Rules that apply to all lists

* **Monitored workspaces only.** Most lists (including Reports, Dashboards and KQL Dashboards) show only artifacts from workspaces marked as monitored in [Workspaces › Workspace Monitoring](/en/power-monitor/governanca/workspaces.md#workspace-monitoring). There is no switch to turn off this restriction: it is the same criterion used to count items for billing, so what you see is what is monitored. In the *Reports* group, the exceptions are [Paginated Reports](/en/power-monitor/governanca/relatorios/relatorios-paginados.md), [Apps](/en/power-monitor/governanca/relatorios/apps.md), [Explorations](/en/power-monitor/governanca/relatorios/exploracoes.md) and [Metric Sets](/en/power-monitor/governanca/relatorios/conjuntos-de-metricas.md), which show the items of all inventoried workspaces, and the link screens, which query the entire tenant live.
* **Deleted artifacts are left out.** When an artifact no longer exists in the tenant, it is removed from the inventory lists on the next scan and appears in [Deleted Artifacts](/en/power-monitor/governanca/operacao/artefatos-excluidos.md).
* **User's workspace scope.** Users with visibility restricted to some workspaces see only the artifacts of those workspaces.
* **Hide data.** In Reports and Paginated Reports, the **Hide data** button is right below the title and also in the details modal header. When on, it masks the **Created by** and **Modified by** columns in the table and, in the modal, the authorship fields and the responsibles fields (**Responsible person** and **Business Area Contact**, when they exist) on the **Overview** tab and the names and identifiers of people on the **Users & Permissions** tab (groups and applications stay readable). Useful for sharing screenshots without exposing colleagues. The preference applies to the browser and is shared across screens.
* **Data source.** The inventory is updated by the inventory scans (daily Full Scan and Incremental Scan), configured in [Mapping › Inventory](/en/power-monitor/mapeamento/inventarios.md). An artifact created in Power BI appears here after the next scan that reaches its workspace.
* **Page blocking.** The administrator can block access to any of these screens for specific users, in [Users](/en/power-monitor/usuarios.md).
* **List export.** The inventory lists do not have CSV/Excel export of the table; the exceptions are [Public Links](/en/power-monitor/governanca/conformidade/links-publicos.md) and [Organization-wide Links](/en/power-monitor/governanca/conformidade/links-para-toda-a-organizacao.md), which export CSV and JSON. On this screen, the "export" is of the **report file** (see the actions menu below).

## Features

All the features below start from the *Governance › Reports › Reports* menu and are available to all profiles.

### Reports counter

**What it is:** the **Power BI Reports** badge, next to the section title, with the number of interactive reports in the list.

**What it is for:** knowing how many reports exist in the monitored scope and how many remain after applying a filter (for example, how many have not been changed for more than a year).

**How to use:** read the number on the badge; when you apply date or column filters, it is updated for the filtered selection.

**How it works:** it counts only interactive Power BI reports from monitored workspaces; paginated reports are in [Paginated Reports](/en/power-monitor/governanca/relatorios/relatorios-paginados.md).

### Date filters

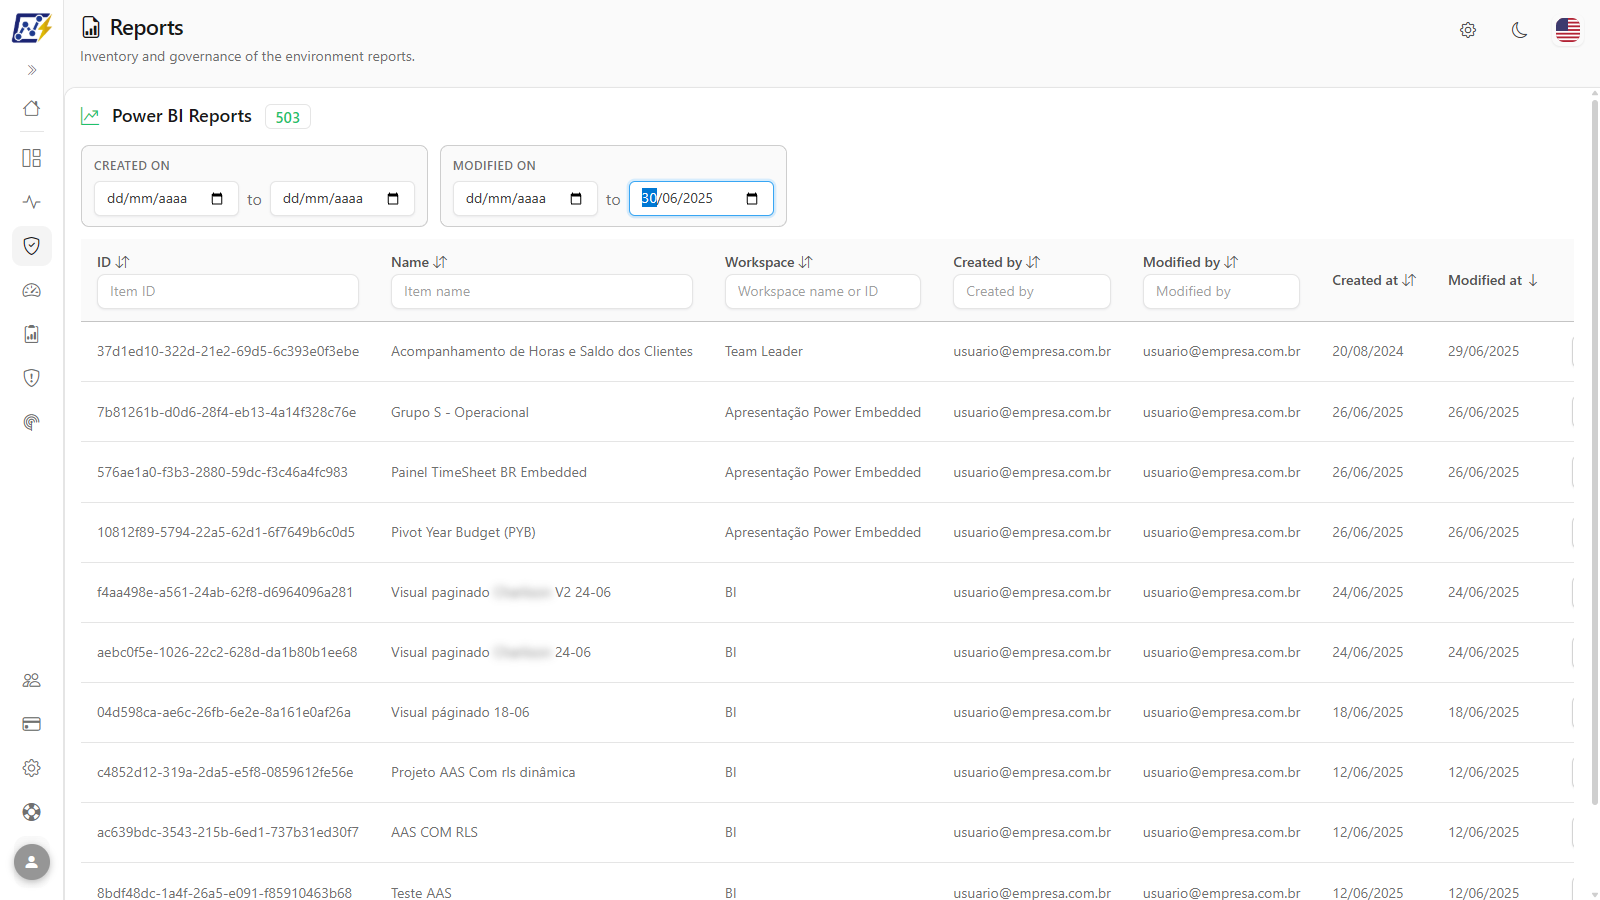
**What it is:** two date range filters above the table, **Created at** and **Modified at**, each with a start date and an end date.

**What it is for:** finding reports published or changed in a period, and especially **abandoned** reports (not changed for a long time), candidates for archiving before a migration or environment cleanup.

<figure><picture><source srcset="/files/IjuybUdwHeIOSaju63lf" media="(prefers-color-scheme: dark)"><img src="https://3938213054-files.gitbook.io/~/files/v0/b/gitbook-x-prod.appspot.com/o/spaces%2FH2bFRBmIfyK3kwVKbldl%2Fuploads%2Fgit-blob-bb2168c18f1b7ea3ba872413b7f37e3706343ed2%2Fpm-governanca-relatorios-filtro-datas-en.png?alt=media" alt="Created at and Modified at filters above the reports table, with the modification end date filled in"></picture><figcaption><p>Date filters of the Reports screen</p></figcaption></figure>

**How to use:**

1. In the **Created at** or **Modified at** filters, above the table, fill in the start date, the end date or both.
2. The table is filtered automatically.
3. Clear the dates to return to the complete list.

#### How to find reports not changed for more than a year

{% stepper %}
{% step %}

#### Filter by modification date

In the **Modified at** filter, fill in only the end date with the date one year ago.
{% endstep %}

{% step %}

#### Analyze the result

The list shows only reports that have not been modified since then, and the counter shows how many there are. Use **Open details › Users & Permissions** to see who still has access before deciding to archive.
{% endstep %}
{% endstepper %}

**How it works:**

| Filter          | What it does                                                                                                                                          |
| --------------- | ----------------------------------------------------------------------------------------------------------------------------------------------------- |
| **Created at**  | Shows only the reports created in the chosen range. When you fill in the start date, the list is sorted by creation date, from oldest to newest.      |
| **Modified at** | Shows only the reports modified in the chosen range. When you fill in the start date, the list is sorted by modification date, from oldest to newest. |

When you clear the start date, sorting by that date goes back to newest to oldest.

### Column filters and sorting

**What it is:** text boxes in the header of the **ID**, **Name**, **Workspace**, **Created by** and **Modified by** columns, and sorting by clicking the title of any column.

**What it is for:** locating a specific report, listing everything a workspace publishes or everything a person (or a CI/CD Service Principal) created or modified.

**How to use:**

1. Type the term in the filter box below the title of the **ID** (*Item ID*), **Name** (*Item name*), **Workspace** (*Workspace name or ID*), **Created by** or **Modified by** column. The table is filtered automatically.
2. Click the title of the **Modified at** column (or any other). The first click sorts from newest to oldest (descending); click again to reverse it.

**How it works:** the filters are combined with each other. The **Workspace** filter accepts the workspace name or ID. By default the list is sorted by **Modified at**, from newest to oldest; all columns are sortable. 10 reports per page by default (**Items per page** selector: 10, 25, 50 or 100).

### Reports table

**What it is:** the list of interactive Power BI reports, with identification, location and authorship.

**What it is for:** auditing authorship and changes, who published, who last modified and when.

**How to use:** read the row's columns; click the row to open the details (see [Details: Overview](#details-overview)).

**How it works:**

| Column          | Description                                  |
| --------------- | -------------------------------------------- |
| **ID**          | Identifier (GUID) of the report in Power BI. |
| **Name**        | Report name.                                 |
| **Workspace**   | Workspace where the report is published.     |
| **Created by**  | Account that published the report.           |
| **Modified by** | Account that made the last change.           |
| **Created at**  | Creation date and time.                      |
| **Modified at** | Date and time of the last modification.      |
| **⋮**           | Row actions menu.                            |

### Actions menu

**What it is:** the menu opened by the **⋮** button at the end of each row (or by right-clicking anywhere on the row).

**What it is for:** bringing together, in one place, the shortcuts to each details tab, the file download and export and the links to the report and the model in Power BI.

<figure><picture><source srcset="/files/q8Kn53YXKC9Zb5AQaeoH" media="(prefers-color-scheme: dark)"><img src="https://3938213054-files.gitbook.io/~/files/v0/b/gitbook-x-prod.appspot.com/o/spaces%2FH2bFRBmIfyK3kwVKbldl%2Fuploads%2Fgit-blob-c233a675e1ac3a1ac6f53aa24131992c7082a5dd%2Fpm-governanca-relatorios-menu-acoes-en.png?alt=media" alt="Actions menu of a row of the Reports screen with the Open details submenu open"></picture><figcaption><p>Actions menu of a report</p></figcaption></figure>

**How to use:**

1. Click the row's **⋮** button, or right-click the row.
2. Click the desired action. To go directly to a details tab, hover over **Open details** and choose the tab in the submenu.

**How it works:**

| Action                      | What it does                                                                                                                                                                                                                                                                                                                                    |
| --------------------------- | ----------------------------------------------------------------------------------------------------------------------------------------------------------------------------------------------------------------------------------------------------------------------------------------------------------------------------------------------- |
| **Open details**            | Opens the details modal. The submenu lets you directly open the *Overview*, *Users & Permissions*, *Lineage* and *Model diagram* (only when the report's semantic model has already been scanned), *Report Structure*, *Best Practices* and *Dependencies* tabs.                                                                                |
| **Best Practices Analysis** | Opens the [Report Best Practices Score](/en/power-monitor/qualidade-de-dados/score-de-boas-praticas-de-relatorios.md) page already loaded with this report, in full screen. If that page is blocked for your user, it opens the report details directly on the **Best Practices** tab (see [Details: Best Practices](#details-best-practices)). |
| **Download report**         | Downloads the report's original `.pbix` file.                                                                                                                                                                                                                                                                                                   |
| **Export reports**          | Exports the report to **PowerPoint (.pptx)** or **PDF**.                                                                                                                                                                                                                                                                                        |
| **Open in Power BI**        | Opens the report in Power BI.                                                                                                                                                                                                                                                                                                                   |
| **Open Model in Power BI**  | Opens the semantic model used by the report (even when it is in another workspace). It only appears when the report is linked to a model.                                                                                                                                                                                                       |
| **Model Settings**          | Opens the semantic model settings page in Power BI (data source, credentials, scheduled refresh). It only appears when the report is linked to a model.                                                                                                                                                                                         |

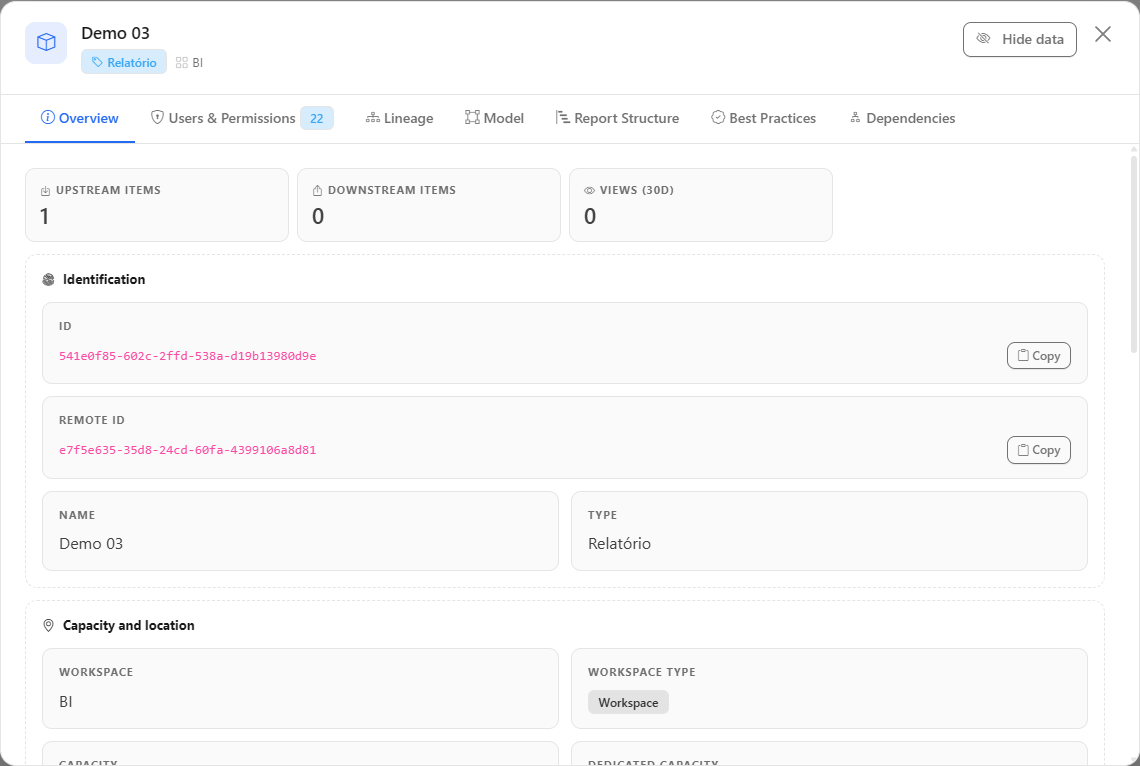
### Details: Overview

**What it is:** the first tab of the details modal, with the report's properties.

**What it is for:** seeing at once the report's identifier, workspace, capacity, dates and authors, and copying the ID to use in another tool or in a support ticket.

<figure><picture><source srcset="/files/oecRb0YWwfALcTDX73ia" media="(prefers-color-scheme: dark)"><img src="https://3938213054-files.gitbook.io/~/files/v0/b/gitbook-x-prod.appspot.com/o/spaces%2FH2bFRBmIfyK3kwVKbldl%2Fuploads%2Fgit-blob-b7b0fe611408cfd7936cd8fdf6492ccc0cbf8456%2Fpm-governanca-relatorios-modal-visao-geral-en.png?alt=media" alt="Details modal of a report on the Overview tab, with ID, workspace, capacity, dates and authors"></picture><figcaption><p>Report details, Overview</p></figcaption></figure>

**How to use:**

1. Click the report row, or the **⋮** button › **Open details**. The modal opens on the **Overview** tab.
2. Click **Copy** next to the ID to copy the report identifier.
3. Switch tabs using the bar at the top of the modal, or close it with the **X**.

**How it works:** the fields follow the pattern described in [The Overview tab](#the-overview-tab); each field only appears when the data exists.

### Details: Users & Permissions

**What it is:** the tab that lists who has access to the report.

**What it is for:** checking who still accesses a report before archiving it, or confirming that an external guest does not have access to sensitive content.

<figure><picture><source srcset="/files/h70acr0TX4t5ffLSXviT" media="(prefers-color-scheme: dark)"><img src="https://3938213054-files.gitbook.io/~/files/v0/b/gitbook-x-prod.appspot.com/o/spaces%2FH2bFRBmIfyK3kwVKbldl%2Fuploads%2Fgit-blob-605807a3194b9a88fe289088a01ed1e090f4e3e2%2Fpm-governanca-relatorios-modal-usuarios-en.png?alt=media" alt="Users &#x26; Permissions tab of the modal of a report, with the search and the list of principals with access"></picture><figcaption><p>Report details, Users &#x26; Permissions</p></figcaption></figure>

**How to use:**

1. In the report's **⋮** menu, hover over **Open details** and choose **Users & Permissions**.
2. Use the search to locate a user, group or application by name, e-mail or identifier.

**How it works:** the table shows the **Principal Type**, the **Category** (Member or Guest/External) and the **Access Level** of each one; the total appears in the summary and as a counter on the tab.

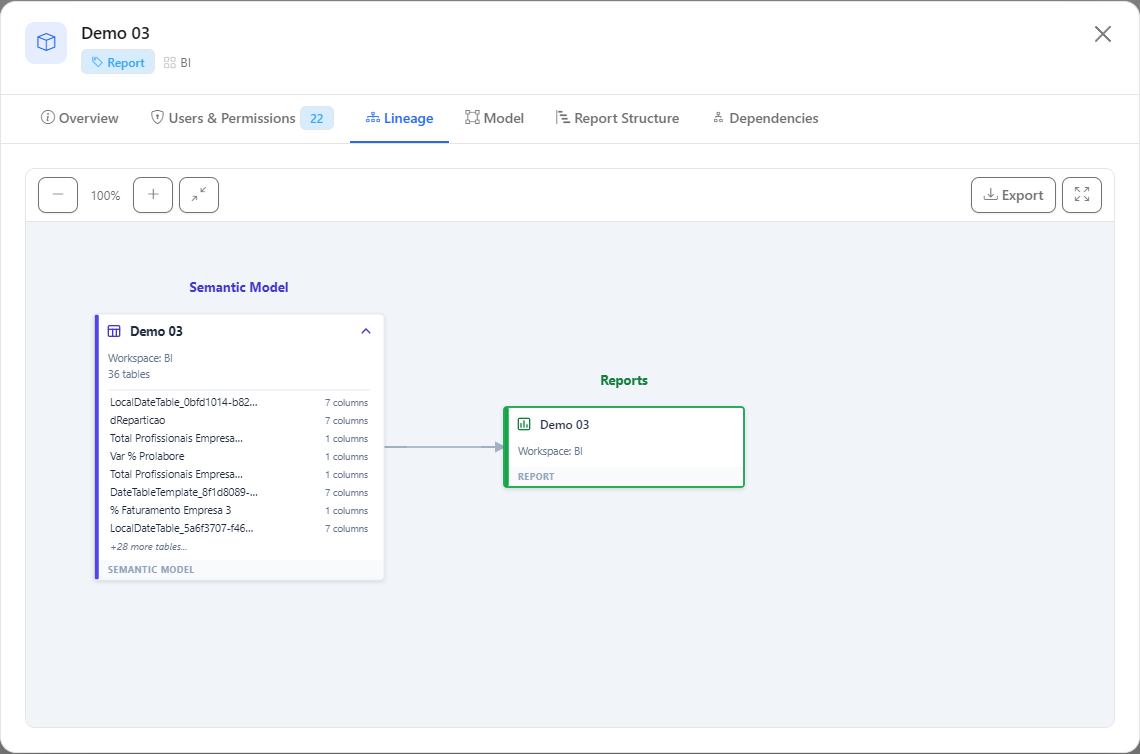
### Details: Lineage

**What it is:** the tab that shows the lineage of the semantic model used by the report (data sources → model → reports), with the current report highlighted.

**What it is for:** knowing where the report's data comes from and which other reports share the same model, essential for assessing the impact of a change.

<figure><picture><source srcset="/files/sYdGHnrqoOzBmm4akMGE" media="(prefers-color-scheme: dark)"><img src="https://3938213054-files.gitbook.io/~/files/v0/b/gitbook-x-prod.appspot.com/o/spaces%2FH2bFRBmIfyK3kwVKbldl%2Fuploads%2Fgit-blob-52aeecd7ec0dee79f2fe0c132a48951d0f349925%2Fpm-governanca-relatorios-modal-linhagem-en.png?alt=media" alt="Lineage tab of the modal of a report, with the data sources, the semantic model and the linked reports"></picture><figcaption><p>Report details, Lineage</p></figcaption></figure>

**How to use:**

1. In the report's **⋮** menu, hover over **Open details** and choose **Lineage**.
2. Use zoom, **Fit to screen**, **Fullscreen** and **Export** as described in [Semantic Models](/en/power-monitor/governanca/modelos-semanticos.md#features).

**How it works:** the tab only exists when the report's semantic model has already been scanned by Power Monitor.

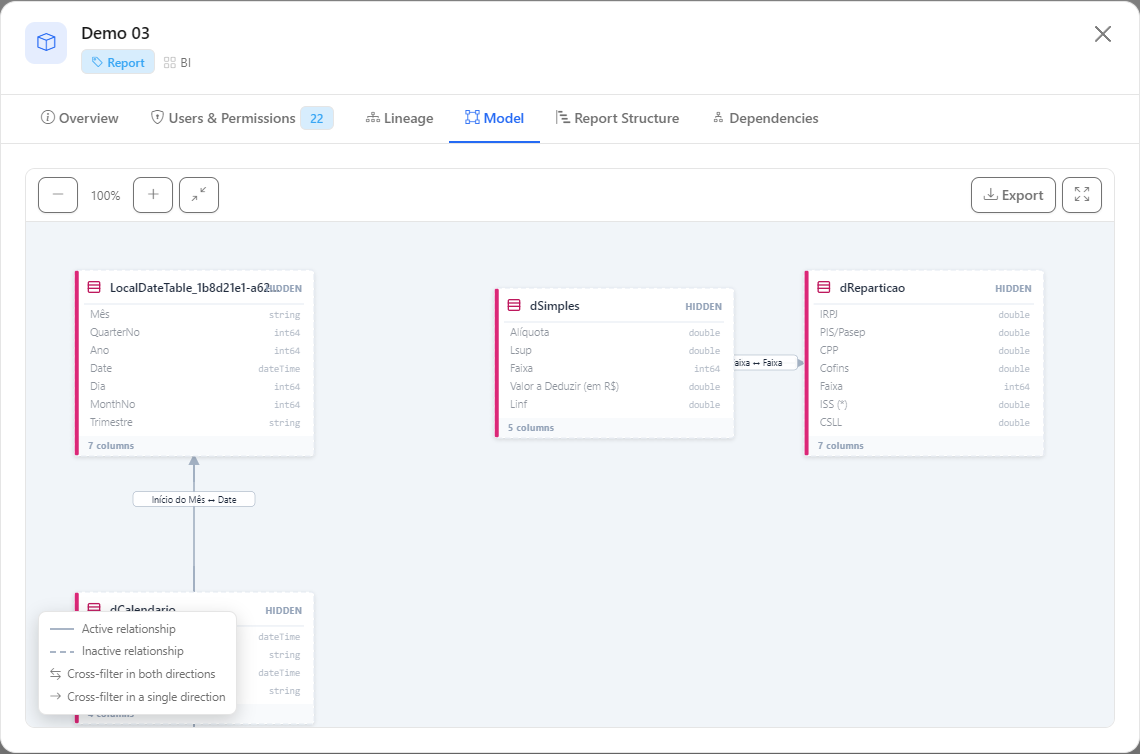
### Details: Model

**What it is:** the **Model** tab (in the submenu, **Model diagram**), with the diagram of tables and relationships of the semantic model used by the report.

**What it is for:** understanding the data structure behind the report without opening Power BI Desktop.

<figure><picture><source srcset="/files/3OyPsCYnQIBxawJ4rYVa" media="(prefers-color-scheme: dark)"><img src="https://3938213054-files.gitbook.io/~/files/v0/b/gitbook-x-prod.appspot.com/o/spaces%2FH2bFRBmIfyK3kwVKbldl%2Fuploads%2Fgit-blob-c8e8508dbb019d519ed71bd1e46ffdfa1adfbe06%2Fpm-governanca-relatorios-modal-modelo-en.png?alt=media" alt="Model tab of the modal of a report with the diagram of tables and relationships of the semantic model"></picture><figcaption><p>Report details, Model</p></figcaption></figure>

**How to use:**

1. In the report's **⋮** menu, hover over **Open details** and choose **Model diagram**.
2. Navigate the diagram with the controls described in [Semantic Models](/en/power-monitor/governanca/modelos-semanticos.md).

**How it works:** like the Lineage tab, it only exists when the report's semantic model has already been scanned.

### Details: Report Structure

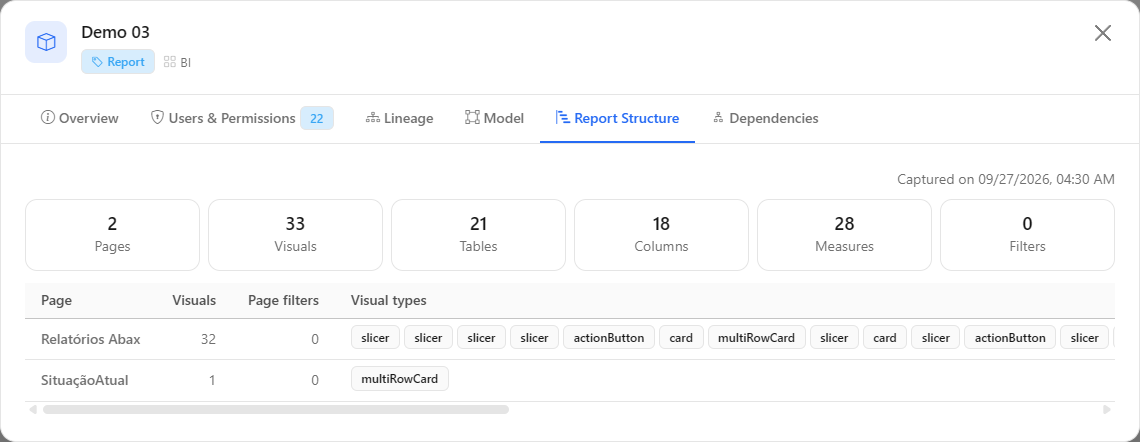
**What it is:** the tab with the summary of the report's captured structure: pages, visuals, tables, columns, measures and filters.

**What it is for:** measuring the complexity of a report without opening it, for example, to estimate the effort of a migration or identify reports with pages overloaded with visuals.

<figure><picture><source srcset="/files/AoFvW35ig1HEjJ7anXNF" media="(prefers-color-scheme: dark)"><img src="https://3938213054-files.gitbook.io/~/files/v0/b/gitbook-x-prod.appspot.com/o/spaces%2FH2bFRBmIfyK3kwVKbldl%2Fuploads%2Fgit-blob-aa3e016c55c6cc98405e50998b01a1d039860e93%2Fpm-governanca-relatorios-modal-estrutura-en.png?alt=media" alt="Report Structure tab of the details modal, with totals of pages, visuals, tables, columns, measures and filters"></picture><figcaption><p>Report Structure tab</p></figcaption></figure>

**How to use:**

1. In the report's **⋮** menu, hover over **Open details** and choose **Report Structure**.
2. Check the totals on the cards (**Pages**, **Visuals**, **Tables**, **Columns**, **Measures**, **Filters**) and the capture date ("Captured on …").
3. In the per-page table (**Page**, **Visuals**, **Page filters**, **Visual types**), hover over a visual type to see how many fields and filters it uses.

**How it works:** the structure is captured by a daily routine (see [Rules and behavior](#rules-and-behavior)). If the capture has not happened yet, the tab shows "This report's structure has not been captured yet. The scan runs daily, overnight."; if the last capture failed, it shows the reason.

### Details: Dependencies

**What it is:** the tab with the dependency graph declared by Fabric itself for the report, in two lists: **Depends on** and **Used by**.

**What it is for:** confirming which semantic model the report reads from and whether any other artifact depends on it before moving or deleting it.

<figure><picture><source srcset="/files/cTYPg62OsXGRvQLtNrbD" media="(prefers-color-scheme: dark)"><img src="https://3938213054-files.gitbook.io/~/files/v0/b/gitbook-x-prod.appspot.com/o/spaces%2FH2bFRBmIfyK3kwVKbldl%2Fuploads%2Fgit-blob-e623b4d35cf7381c8d785e60ac9353fd98966680%2Fpm-governanca-modal-detalhes-dependencias-en.png?alt=media" alt="Dependencies tab of the details modal, with the Depends on and Used by lists"></picture><figcaption><p>Dependencies tab of the details modal</p></figcaption></figure>

**How to use:**

1. In the report's **⋮** menu, hover over **Open details** and choose **Dependencies**.
2. **Depends on** shows the artifacts that the report reads (for example, the semantic model); **Used by** shows the artifacts that depend on it.

**How it works:** **Artifact**, **Type**, **Relation type** and **Identifier** columns. Dependencies pointing to something outside the monitored scope appear as "Unidentified artifact". See [The details modal](#the-details-modal).

### Details: Best Practices

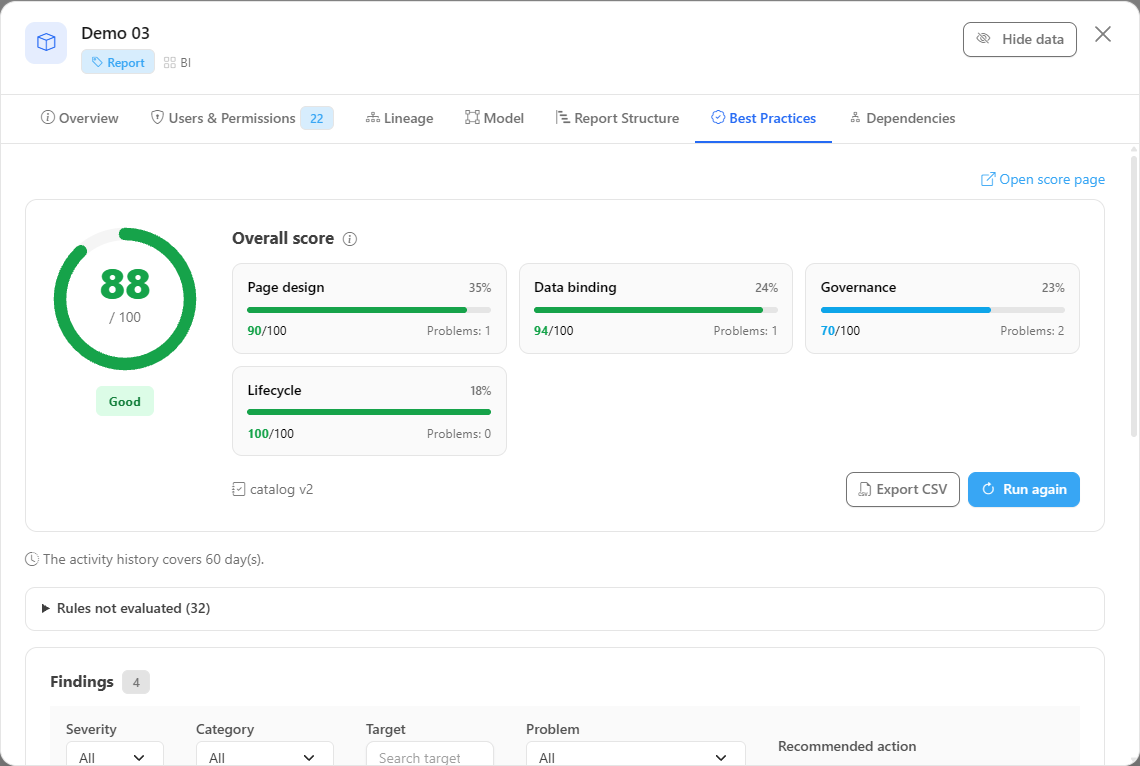
**What it is:** the **Best Practices** tab of the details modal, opened by **Open details › Best Practices** (and also by the **Best Practices Analysis** item of the **⋮** menu when the score page is blocked for your user). It shows the report's score against a set of rules for page design, data binding, governance, lifecycle and accessibility, with a recommendation for each problem.

**What it is for:** reviewing a report before publishing or certifying it, without leaving the inventory list.

<figure><picture><source srcset="/files/2HQUQuT9gR9CKr2Jcgmx" media="(prefers-color-scheme: dark)"><img src="https://3938213054-files.gitbook.io/~/files/v0/b/gitbook-x-prod.appspot.com/o/spaces%2FH2bFRBmIfyK3kwVKbldl%2Fuploads%2Fgit-blob-ca153fc4177a9000c7ef1647b8c67ff0378108f6%2Fpm-governanca-relatorios-modal-boas-praticas-en.png?alt=media" alt="Best Practices tab of a report&#x27;s details modal with the overall score and the problems found"></picture><figcaption><p>Report details: Best Practices</p></figcaption></figure>

**How to use:**

1. In the report's **⋮** menu, hover over **Open details** and choose **Best Practices**. To go straight to the full score page, click **Best Practices Analysis**.
2. Read the score, the category cards and the table of problems. The **Open score page** link takes you to the [Report Best Practices Score](/en/power-monitor/qualidade-de-dados/score-de-boas-praticas-de-relatorios.md) screen, with the analysis in full screen.

**How it works:** the analysis uses what Power Monitor has already collected (for example, the report structure). Rules that depend on data not yet collected appear as not evaluated, instead of counting as passed.

### Download report

**What it is:** the **Download report** action in the **⋮** menu, which downloads the original `.pbix` file.

**What it is for:** keeping a copy for versioning, auditing or backup, without needing direct access to the workspace.

**How to use:**

{% stepper %}
{% step %}

#### Open the actions menu

Click the row's **⋮** button (or right-click the row) and choose **Download report**.
{% endstep %}

{% step %}

#### Wait for the download

The message "Downloading report. This can take up to a minute." remains on the screen and the row's **⋮** button is disabled, with a loading indicator, until it finishes.
{% endstep %}

{% step %}

#### Check the result

The file is downloaded by the browser and the message "Report downloaded successfully." appears. In case of failure, the Power BI error message or "Could not download the report. Please try again." appears.
{% endstep %}
{% endstepper %}

**How it works:** the file is obtained from Power BI by the Power Monitor Service Principal, so the service's own limitations apply, for example, Power BI may refuse to download reports that cannot be downloaded as `.pbix`. If the report was deleted or moved after the last scan, "Report not found." appears.

### Export to PDF or PowerPoint

**What it is:** the **Export reports** action in the **⋮** menu, which generates the report in **PowerPoint (.pptx)** or **PDF** through the Power BI service.

**What it is for:** sending a "snapshot" of the report to an audit, a meeting or a person who does not have access to Power BI.

<figure><picture><source srcset="/files/Bn0EPOkyJKTvUtUIbqeZ" media="(prefers-color-scheme: dark)"><img src="https://3938213054-files.gitbook.io/~/files/v0/b/gitbook-x-prod.appspot.com/o/spaces%2FH2bFRBmIfyK3kwVKbldl%2Fuploads%2Fgit-blob-2d4078235d0c8ed91cff961bfeccd30b3785e667%2Fpm-governanca-relatorios-exportar-formato-en.png?alt=media" alt="Choose the export format window with the PowerPoint (.pptx) and PDF options"></picture><figcaption><p>Choosing the export format</p></figcaption></figure>

**How to use:**

{% stepper %}
{% step %}

#### Locate the report

Use the **Name** or **Workspace** filters in the table header.
{% endstep %}

{% step %}

#### Open the actions menu

Click the row's **⋮** button (or right-click the row) and choose **Export reports**.
{% endstep %}

{% step %}

#### Choose the format

In the **Choose the export format** window, select **PowerPoint (.pptx)** (option already selected) or **PDF** and click **Export reports**. To give up, click **Cancel**.
{% endstep %}

{% step %}

#### Wait for the export

The message "Exporting report. This can take up to a minute." remains on the screen. When it finishes, the file is downloaded by the browser and "Report exported successfully." appears. In case of failure, the Power BI error message or "Could not export the report. Please try again." appears.
{% endstep %}
{% endstepper %}

**How it works:** downloading and exporting are read actions and are available to all profiles. The export is done by the Power BI service and can take up to about a minute.

### Multiple selection and bulk actions

**What it is:** the column of checkboxes to the left of the table (with the header checkbox **Select all on this page**) and the bulk actions bar, which appears when reports are checked. The bar shows the counter (*N selected*) and the **Download reports**, **Export reports**, and **Clear selection** buttons.

**What it is for:** keeping a copy of several reports at once (for example, for a migration or a backup) or exporting them to PDF/PowerPoint, without repeating the action row by row.

**How to use:**

1. Check the reports in the checkboxes or use the header checkbox to check all the reports on the page. The selection is kept when you change pages and **Items per page**; if you change the filters, reports that leave the list leave the selection.
2. To check all the reports that match the current filters, including those on other pages, click **Select all N filtered reports**, which appears in the bar when the whole page is checked.
3. Click **Download reports** (the `.pbix` file of each report) or **Export reports** (PDF or PowerPoint). For the export, the **Choose the export format** window appears only once and applies to all the selected reports.
4. With more than 5 reports, a confirmation (*Download N reports?* or *Export N reports?*) warns that files are processed 2 at a time and may take several minutes. Confirm to start.
5. Follow the **Downloading reports** (or **Exporting reports**) window: the progress bar (*N of M*) and, for each report, the status **Waiting**, **In progress**, **Done**, **Skipped**, **Failed** (with the reason), or **Not run**. Do not close the window until it finishes.
6. If you need to interrupt, click **Stop**: the reports in progress finish and the others stay as **Not run**. At the end, **Retry (N)** repeats only those that failed or were not run, and **Close** closes the window.

**How it works:**

* Each report is downloaded or exported as in the row action, **2 at a time**, and produces one file per report.
* **Skipped** is not an error: it indicates a report whose workspace was deleted (*The report workspace was deleted.*) or that has no Power BI identifier (*Report has no Power BI identifier.*).
* **Failed** shows the actual reason returned by Power BI (for example, sensitivity label, Service Principal permission, or service limit). One failure does not interrupt the other reports.
* When it finishes, a notice summarizes the result (*Processing finished. Done: X, skipped: Y, failed: Z.*) and the window repeats the summary.
* The browser may ask permission to **download multiple files**: allow it for the Power Monitor address. Without the permission, the browser may block the following files.
* While a bulk action is running, the buttons are disabled. Bulk actions are read operations and are available to all profiles.

### Open in Power BI and model shortcuts

**What it is:** the **Open in Power BI**, **Open Model in Power BI** and **Model Settings** actions in the **⋮** menu.

**What it is for:** going from the inventory directly to the report, to the semantic model behind it or to that model's settings (credentials, scheduled refresh), even when the model is in another workspace.

**How to use:**

1. In the report's **⋮** menu, click **Open in Power BI** to open the report, **Open Model in Power BI** to open the semantic model it uses or **Model Settings** to open that model's settings.
2. The page opens in a new browser tab.

**How it works:** the two model actions only appear when the report is linked to a semantic model. You need to have access to the artifact in Power BI to view it.

## Rules and behavior

* **Power BI reports only.** Paginated reports are on the [Paginated Reports](/en/power-monitor/governanca/relatorios/relatorios-paginados.md) screen.
* **Report structure.** The structure is captured by a daily routine, at 22:50 (Brasília time, UTC-3; in *Settings › Monitoring* the frequency can be changed to weekly or monthly), tracked by the administrator in [Mapping › Report Structure](/en/power-monitor/mapeamento/estrutura-de-relatorios.md). Until the first capture happens, the tab shows "This report's structure has not been captured yet". If the last capture failed, the tab shows the reason.
* **Created by / Modified by** show the account recorded by Power BI. Reports published by automation (CI/CD pipelines, Service Principals) may show the application identifier instead of an e-mail.
* All the [common rules of the lists](#rules-that-apply-to-all-lists) apply.

## Frequently asked questions

<details>

<summary>A report that exists in Power BI does not appear in the list. Why?</summary>

Check, in this order: (1) whether the report's workspace is **monitored** in *Workspaces › Workspace Monitoring*; (2) whether the report is not **paginated**, in that case it is in *Paginated Reports*; (3) whether there has already been an inventory scan after publication; (4) whether your user has visibility over that workspace.

</details>

<details>

<summary>Why don't the Lineage and Model tabs appear for some reports?</summary>

They depend on the report's semantic model having already been scanned by Power Monitor. Reports whose model is in an unmonitored workspace, or that has not yet gone through the model scan, do not have these tabs.

</details>

<details>

<summary>The download or export failed. What should I do?</summary>

Try again in a few minutes: the operation depends on the Power BI service and can take up to a minute. If the message indicates that the report was not found, it may have been deleted or moved after the last scan. Some restrictions of Power BI itself also prevent certain reports from being downloaded as `.pbix`.

</details>

<details>

<summary>The creator appears as a GUID instead of an e-mail.</summary>

This happens when the report was published by a Service Principal (for example, in a CI/CD pipeline) or when the original account was removed from Microsoft Entra ID.

</details>

<details>

<summary>How do I select all the reports in the list, not just those on the page?</summary>

Check the header checkbox to select the reports on the page and, in the bulk actions bar, click **Select all N filtered reports**. Use the filters first to narrow the list to what you want to download or export.

</details>

<details>

<summary>The browser asked for permission or blocked the bulk action downloads.</summary>

Bulk actions generate one file per report, in sequence. Allow **downloading multiple files** for the Power Monitor address when the browser asks and, if a file is left out, use **Retry** in the progress window.

</details>

<details>

<summary>Some reports appear as "Skipped" or "Failed" in the bulk action.</summary>

**Skipped** indicates a report from a deleted workspace or without a Power BI identifier; it is not an error. **Failed** shows the reason returned by Power BI. Fix the cause (for example, the Service Principal permission) and click **Retry**, which repeats only those that failed or were not run.

</details>

## Related pages

* [Paginated Reports](/en/power-monitor/governanca/relatorios/relatorios-paginados.md)
* [Semantic Models](/en/power-monitor/governanca/modelos-semanticos.md)
* [Workspaces](/en/power-monitor/governanca/workspaces.md)
* [Public Links](/en/power-monitor/governanca/conformidade/links-publicos.md)
* [Organization-wide Links](/en/power-monitor/governanca/conformidade/links-para-toda-a-organizacao.md)
* [Labels and Certification](/en/power-monitor/governanca/conformidade/rotulos-e-certificacao.md)
* [Inventory Scan](/en/power-monitor/mapeamento/inventarios.md)


---

# Agent Instructions
This documentation is published with GitBook. GitBook is the documentation platform designed so that both humans and AI agents can read, navigate, and reason over technical content effectively. Learn more at gitbook.com.

## Querying This Documentation
If you need additional information that is not directly available in this page, you can query the documentation by asking a question.

Perform an HTTP GET request on the following URL with the `ask` and `goal` query parameters:

```
GET https://docs.powermonitor.com.br/en/power-monitor/governanca/relatorios.md?ask=<question>&goal=<user_goal>
```

`ask` is the immediate question: it should be specific, self-contained, and written in natural language.
`goal` is what the user is ultimately trying to achieve, the reason they need the answer. Sharing it helps GitBook give you a better, more relevant answer. A goal is most helpful when it describes the outcome the user wants rather than restating the question. For example, with `ask=how do I create an API token`, a goal like `automate deployments from our CI pipeline` lets GitBook tailor the answer to that use case.

The response will contain a direct answer to the question and relevant excerpts and sources from the documentation.

Use this mechanism when the answer is not explicitly present in the current page, you need clarification or additional context, or you want to retrieve related documentation sections.