> For the complete documentation index, see [llms.txt](https://docs.powermonitor.com.br/llms.txt). Markdown versions of documentation pages are available by appending `.md` to page URLs; this page is available as [Markdown](https://docs.powermonitor.com.br/en/power-monitor/governanca/relatorios/conjuntos-de-metricas.md).
# Metric Sets
Inventory of Fabric Metric Sets, with status, authorship, access and dependencies.
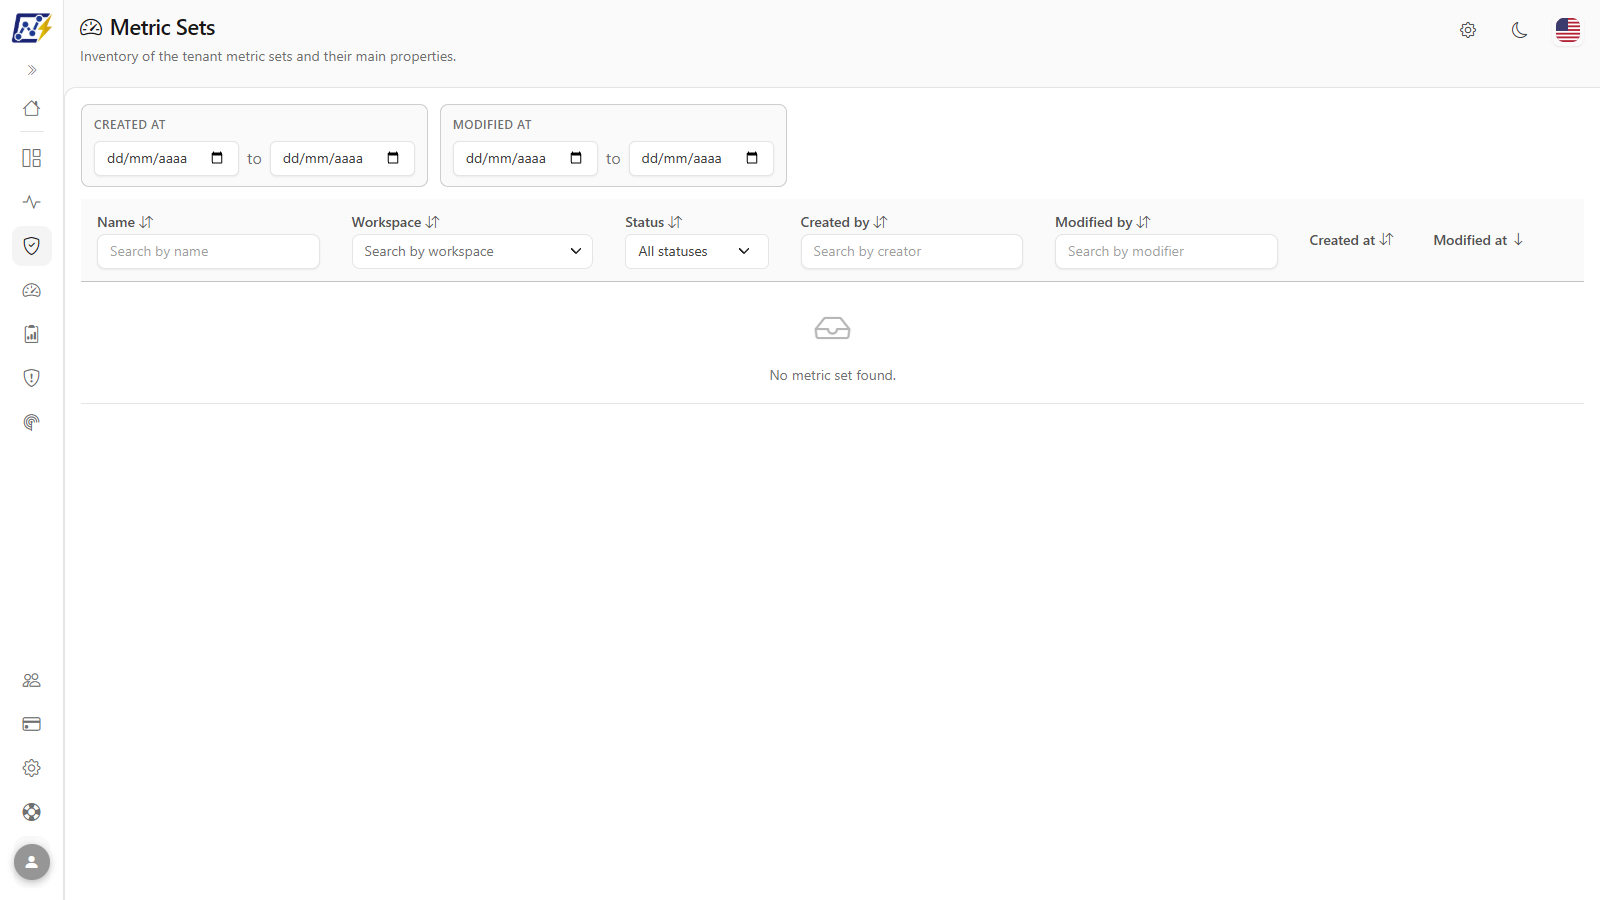
The **Metric Sets** screen lists the Microsoft Fabric *Metric Sets* (sets of business metrics defined on top of semantic models) that exist in the workspaces inventoried by Power Monitor.
**How to access:** menu *Governance › Reports › Metric Sets*. Available to all profiles.
Metric Sets inventory
## What it is for
* **Reconcile inventory and billing:** metric sets are inventory items and, in monitored workspaces, count toward the Power Monitor item count; this screen shows which ones they are.
* Find out who maintains the company's official metrics and when they changed.
* See, in the *Dependencies* tab, which semantic models each metric set depends on.
A screen similar to [Explorations](/en/power-monitor/governanca/relatorios/exploracoes.md) (the difference is the **Workspace** filter, which here is a multiple selection); it follows the [common structure of the Governance lists](/en/power-monitor/governanca/relatorios.md#common-structure-of-the-lists).
## Features
All the features below start from the menu *Governance › Reports › Metric Sets* and are available to all profiles.
### Date filters
**What it is:** the **Created on** and **Modified on** range filters, above the table.
**What it is for:** find out which metric sets changed recently: a change to an official metric usually requires communicating it to the business areas.
**How to use:**
1. In the **Created on** or **Modified on** filters, above the table, fill in the start date, the end date, or both.
2. The table is filtered automatically and returns to the first page. Clear the dates to return to the full list.
**How it works:** the filter is applied to the list already loaded, without a new query to the server.
### Workspace filter
**What it is:** the multiple-selection list in the **Workspace** column (*Search by workspace*), with search, built from the workspaces of the loaded items.
**What it is for:** see the official metrics of one or more areas at once (for example, the Finance and Controllership workspaces).
**How to use:**
1. Click the box below the **Workspace** column title.
2. Type in the search to find the workspace and select one or more items.
3. To clear, click the **X** next to the box.
**How it works:** only workspaces that have at least one metric set in the list appear as options; items without a workspace name appear as "-".
### Column filters and sorting
**What it is:** text boxes in the header of the **Name**, **Created by** and **Modified by** columns, the **Status** list and sorting by the column titles.
**What it is for:** find a metric set by name, author or status.
**How to use:**
1. Type the term in the filter box below the title of the **Name** (*Search by name*), **Created by** (*Search by creator*) or **Modified by** (*Search by modifier*) column. The table is filtered automatically.
2. In the **Status** column, choose **Active**, **Inactive** or **Unknown** (*All statuses* removes the filter).
3. Click the title of the **Modified at** column (or any other). The first click sorts from most recent to oldest (descending); click again to reverse it.
**How it works:** default sort by **Modified at**, from most recent to oldest. 10 items per page.
### Metric sets table
**What it is:** the list of metric sets with location, status, authorship and dates.
**What it is for:** find out who maintains the official metrics and when they were last changed.
**How to use:** read the columns; click the row to open the details.
**How it works:**
| Column | Description |
| --------------- | ----------------------------------------------------------- |
| **Name** | Name of the metric set. |
| **Workspace** | Workspace of the item ("-" when the name is not available). |
| **Status** | **Active**, **Inactive** or **Unknown**. |
| **Created by** | Account that created the item. |
| **Modified by** | Account of the last change. |
| **Created at** | Creation date. |
| **Modified at** | Date of the last change. |
| **⋮** | Row actions menu. |
### Actions menu
**What it is:** the menu opened by the **⋮** button at the end of each row (or by right-clicking anywhere on the row), with the **Open details** item.
**What it is for:** go straight to a specific tab of the details.
**How to use:**
1. Click the row's **⋮** button, or right-click the row.
2. Click **Open details** to open the **Overview** tab, or hover over it and choose **Overview**, **Users & Permissions** or **Dependencies**.
**How it works:** there is no "Open in Power BI" link on this screen.
### Details: Overview
**What it is:** the first tab of the details modal, with the properties of the metric set.
**What it is for:** check the identifier, workspace, dates, authors, tags and description, and copy the ID.
**How to use:**
1. Click the row, or the **⋮** button › **Open details**. The modal opens on the **Overview** tab.
2. Click **Copy** next to the ID to copy the identifier.
**How it works:** see [The details modal](/en/power-monitor/governanca/relatorios.md#the-details-modal).
### Details: Users & Permissions
**What it is:** the tab that lists who has access to the metric set.
**What it is for:** make sure only the right people can change the company's official metrics.
**How to use:**
1. In the **⋮** menu, hover over **Open details** and choose **Users & Permissions**.
2. Use the search to find a user, group or application by name, email or identifier.
**How it works:** the table shows the **Principal Type**, the **Category** (Member or Guest/External) and the **Access Level** of each one.
### Details: Dependencies
**What it is:** the tab with the **Depends on** and **Used by** lists, as declared by Fabric.
**What it is for:** find out which semantic models the official metrics depend on: and, therefore, which models cannot be changed without assessing the impact on the metrics.
**How to use:**
1. In the **⋮** menu, hover over **Open details** and choose **Dependencies**.
2. **Depends on** shows the semantic models (or other artifacts) that the metric set reads; **Used by** shows the artifacts that depend on it, if any.
**How it works:** dependencies that point to something outside the monitored scope appear as "Unidentified artifact". See [The details modal](/en/power-monitor/governanca/relatorios.md#the-details-modal).
## Rules and behavior
* There is no "Open in Power BI" link on this screen.
* **Scope:** this list **does not apply the monitored-workspaces restriction** and shows the metric sets of all inventoried workspaces. Items deleted in the tenant are excluded, and users with restricted visibility see only those from the workspaces granted to them.
* If the list cannot be loaded, the screen shows "Could not load the metric sets." with the **Retry** button.
* The other [common list rules](/en/power-monitor/governanca/relatorios.md#rules-that-apply-to-all-lists) also apply (updates through inventory scans, page lock).
## Related pages
* [Explorations](/en/power-monitor/governanca/relatorios/exploracoes.md)
* [Reports](/en/power-monitor/governanca/relatorios.md)
* [Semantic Models](/en/power-monitor/governanca/modelos-semanticos.md)
---
# Agent Instructions
This documentation is published with GitBook. GitBook is the documentation platform designed so that both humans and AI agents can read, navigate, and reason over technical content effectively. Learn more at gitbook.com.
## Querying This Documentation
If you need additional information that is not directly available in this page, you can query the documentation by asking a question.
Perform an HTTP GET request on the following URL with the `ask` and `goal` query parameters:
```
GET https://docs.powermonitor.com.br/en/power-monitor/governanca/relatorios/conjuntos-de-metricas.md?ask=&goal=
```
`ask` is the immediate question: it should be specific, self-contained, and written in natural language.
`goal` is what the user is ultimately trying to achieve, the reason they need the answer. Sharing it helps GitBook give you a better, more relevant answer. A goal is most helpful when it describes the outcome the user wants rather than restating the question. For example, with `ask=how do I create an API token`, a goal like `automate deployments from our CI pipeline` lets GitBook tailor the answer to that use case.
The response will contain a direct answer to the question and relevant excerpts and sources from the documentation.
Use this mechanism when the answer is not explicitly present in the current page, you need clarification or additional context, or you want to retrieve related documentation sections.