> For the complete documentation index, see [llms.txt](https://docs.powermonitor.com.br/llms.txt). Markdown versions of documentation pages are available by appending `.md` to page URLs; this page is available as [Markdown](https://docs.powermonitor.com.br/en/power-monitor/governanca/tenant/configuracoes-do-tenant.md).
# Tenant Settings
Track the Power BI/Fabric tenant settings (publish to web, external sharing, guests, data export), see all captured settings, the change history with likely authorship and compare with the desired sta
The **Tenant Settings** screen shows the state of the Power BI/Fabric **tenant administrative settings** that have a direct impact on security governance, for example whether content can be **published to the web**, whether users can **share with external guests** or **export data**. For each setting, you see whether it is **enabled**, for **whom** (the whole organization or specific security groups), whether it **changed** in the most recent reading, and its **risk level**. The screen has **four tabs**: **Key Settings**, **All Settings**, **Change History** and **Desired state**.
**How to access:** *Governance › Tenant › Tenant Settings*. Viewing the first three tabs is available to all profiles. The **Desired state** tab is exclusive to **Administrators**. The collection itself (run now, pause, run history) is managed by Administrators in [*Mapping › Tenant Settings*](/en/power-monitor/mapeamento/configuracoes-do-tenant.md). An administrator can block this page for specific users in [Users](/en/power-monitor/usuarios.md).
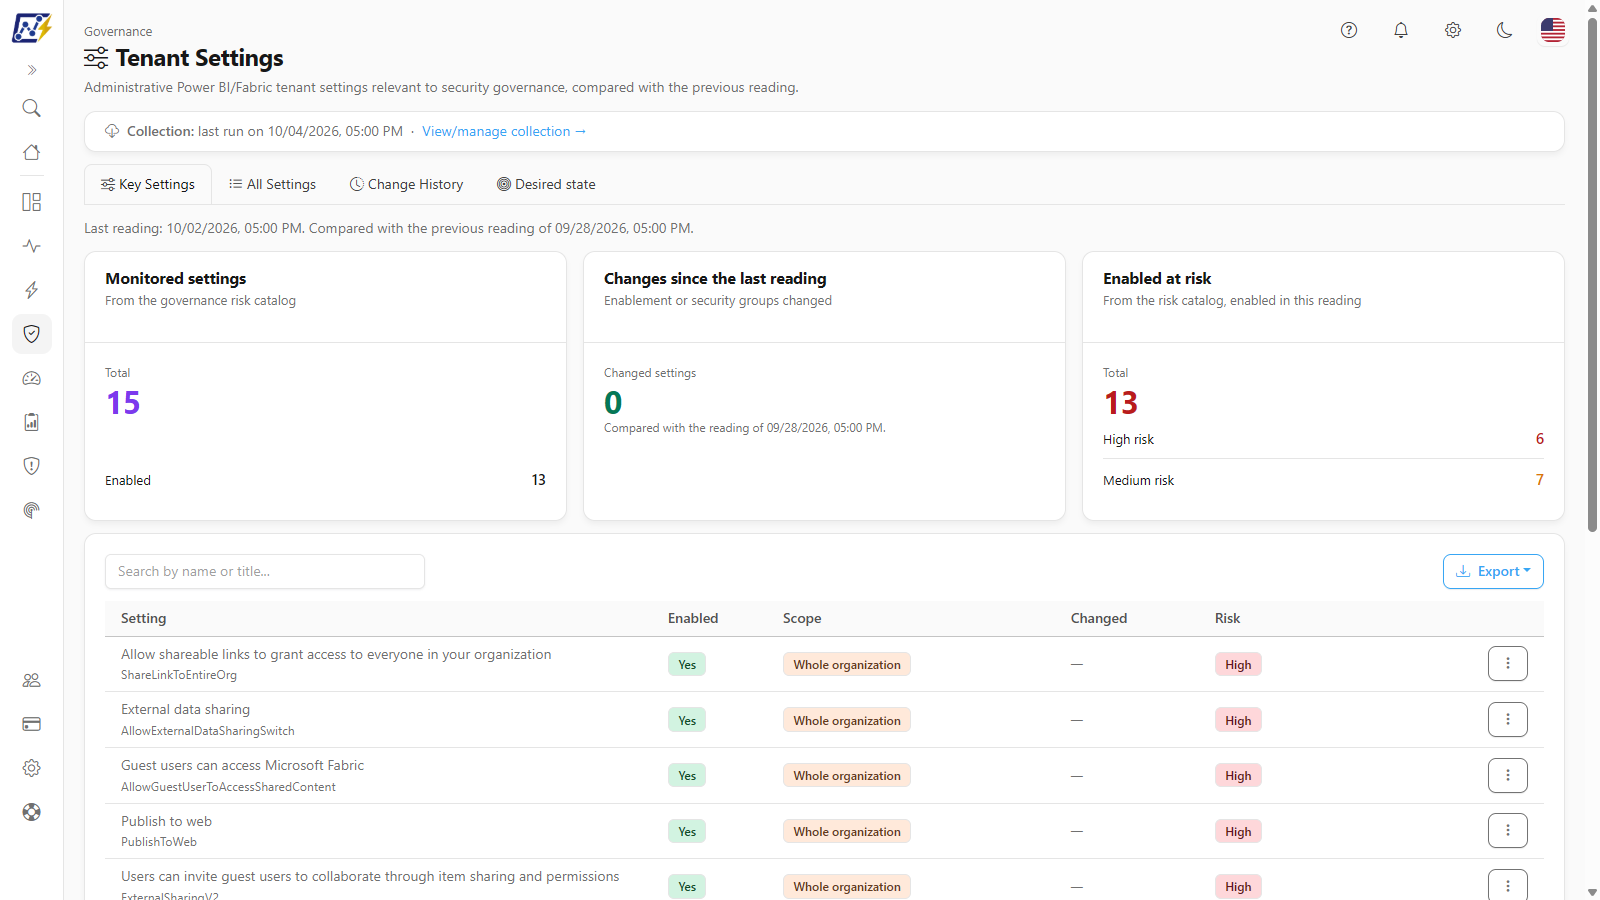
Tenant Settings, Key Settings tab
## What it is for
Fabric tenant settings define, for the entire organization, what users can and cannot do with data. A single setting enabled without restriction (for example, **Publish to Web** for the whole organization) can expose reports on the internet with no access control. Because these options live in the Fabric admin portal and change without notice, governance teams often only discover a change after the incident.
This screen answers:
* **Which sensitive settings are enabled today**, and for whom (the whole organization or specific groups)?
* **What changed** since the previous reading?
* **When** did each setting change and **who** most likely made the change?
* **How should each setting be**, and where is there **drift** from the organization's desired state?
Typical use cases: periodic tenant security review, compliance audit (LGPD, ISO 27001, SOC 2), investigating a data exposure and tracking changes made by other Fabric administrators.
## Collection and last reading date
Right below the title is the **Collection** status (*last run on \[date]*, *running since \[date]*, *last run on \[date], failed* or *no run recorded*), with the **View/manage collection →** link for Administrators. When the collection cannot read the tenant, the permission notice appears (*This reading requires the same Fabric/Power BI administrator permission used by the scan*), with the **Go to Settings** button for Administrators.
On the **Key Settings** tab, the line *Last reading: \[date].* and, when there is a previous reading, *Compared with the previous reading of \[date].* indicate which moment the numbers and the **Changed** badges refer to.
* The collection runs **once a day** and **only records a new reading when some tenant setting changed**. So the **Last reading** date is that of the most recent collection **in which there was a change** (or the organization's first collection), not necessarily yesterday's.
* The change may have happened in any tenant setting, including one that is not part of the risk catalog.
* While the collection has not yet run for the first time, *Could not read tenant settings right now. Try again in a few moments.* and *No tenant settings reading has been recorded yet.* appear. Check the **Collection** status or the run history in *Mapping › Tenant Settings*.
## Key Settings tab
{% hint style="info" %}
This tab shows **only** the settings in Power Monitor's **risk catalog** (the list is in [Monitored settings](#monitored-settings)). The other tenant settings are also collected and appear on the [All Settings](#all-settings-tab) tab.
{% endhint %}
### Indicator cards
Screen indicators
| Card | What it shows | How it works |
| ---------------------------------------------------------------------------- | --------------------------------------------------------------------------- | --------------------------------------------------------------------------------------------------------------------------------------------------------------------------------------------------------------------------------------------------------------------------------------------------------- |
| **Monitored settings** (*From the governance risk catalog*) | **Total** catalog settings found in the tenant and the **Enabled** line | Considers the whole list and **does not change** with the search |
| **Changes since the last reading** (*Enablement or security groups changed*) | **Changed settings** and the footer *Compared with the reading of \[date].* | A change counts when the setting was **enabled or disabled** or its **set of security groups** changed; changes only to the title shown by Fabric do not count. On the organization's **first reading**, all appear as changed, because there is no previous state. Yellow when above zero, green at zero |
| **Enabled at risk** (*From the risk catalog, enabled in this reading*) | **Total** enabled, with the **High risk** and **Medium risk** lines | **Red** when at least one high-risk setting is enabled, **yellow** when there are only medium-risk ones and **green** when none is enabled. A setting enabled only for specific groups also counts |
### Search and export
The **Search by name or title...** field filters the list as you type (the title shown in Fabric or the technical name, such as `PublishToWeb`), case insensitive. When nothing matches, *No setting matches the search.* appears. The **Export** button (**CSV** or **JSON**) takes the rows visible after the search, with **Setting**, **Technical name**, **Original title (English)**, **Enabled**, **Scope**, **Category**, **Enabled groups**, **Excluded groups**, **Changed**, **Risk** and **Risk description**.
Search and export
### List of settings
The table has one risk-catalog setting per row. **High-risk** ones come first; within each level, the order is alphabetical by title. The list is not paginated.
| Column | Content |
| ------------------------ | --------------------------------------------------------------------------------------------------------------------------------------------------------------------------------------------------------- |
| **Setting** | The setting title, as reported by Fabric, and, below it, the technical name (stable, used to identify the setting even if the title changes) |
| **Enabled** | **Yes** badge (green) or **No** badge (gray) |
| **Scope** | Whom the setting applies to when enabled: **Whole organization** badge (yellow, that is, with no restriction to security groups), the list of specific **security groups**, or a dash when it is disabled |
| **Changed** | **Changed** badge when the enablement or groups changed in the most recent reading |
| **Risk** | **High** (red) or **Medium** (yellow) badge. The risk description appears when you hover over the badge |
| **⋮** (**More actions**) | Menu with **Details** and **View history** (it also opens with right-click on the row). Setting the desired state is done on the **All Settings** tab |
Pay special attention to rows with **Yes** in **Enabled**, **Whole organization** in **Scope** and **High** risk: they are the most exposed. To restrict a setting, change it in the Fabric admin portal (**Tenant settings**); Power Monitor only reads settings and never changes them.
### Details of a setting
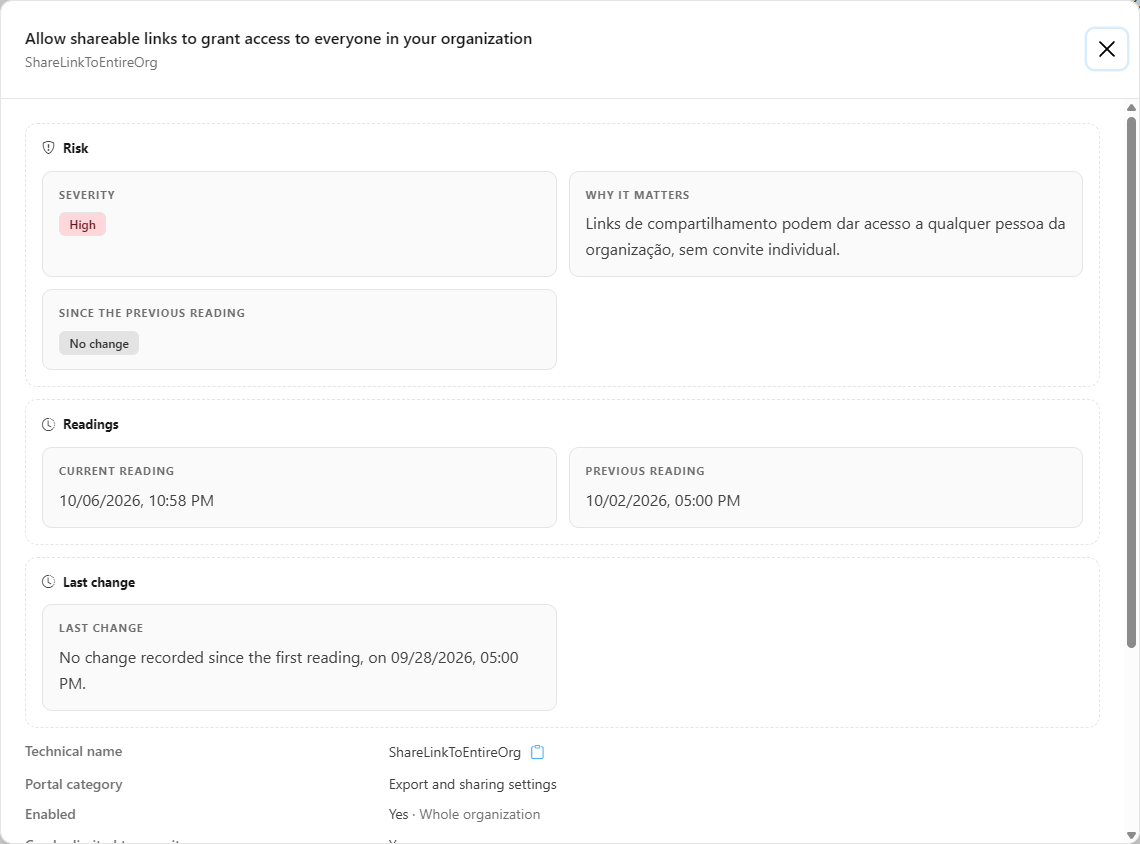
**Details** opens a window with the **Technical name** (with the **Copy** button), the **Portal category**, **Enabled**, **Limited to security groups**, whether the setting **can be limited to security groups**, the **Delegation** (to **Capacity**, **Domain** or **Workspace** administrators), the **Enabled groups** and **Excluded groups** (with **Copy IDs**) and the **Properties** table (**Name**, **Type** and **Value**). Settings captured before this feature show *The details of this setting have not been captured yet. They will be saved on the next daily collection.*
Setting details
### View history
**View history** opens a window with the list of readings in which **that setting changed** (*Each row is a reading where this setting changed. Granularity is daily.*), from the most recent to the oldest. Each entry shows the state (**Yes** or **No**), the scope, the reading date and an authorship badge:
| Badge | Meaning |
| ------------------------------------------------------------ | ---------------------------------------------------------------------------------------------------------------------------- |
| **Initial state captured** (gray) | First time the setting was recorded. It is the base of the history, not a change |
| **Changed by \[user]** (green) | A single person changed tenant settings in the interval between the two readings |
| **Possibly changed by \[users]** (yellow) | More than one person changed tenant settings in the same interval; it cannot be confirmed which of them changed this setting |
| **Could not identify who made the change.** (gray) | The activity events of the interval have already been processed and no tenant setting change was found |
| **Not yet possible to identify who made the change.** (blue) | The activity events of the interval have not been processed yet. Check again later |
* The date is that of the **daily collection** that detected the change, not the exact instant of the change in Fabric.
* Authorship is an **estimate**: the Power BI/Fabric activity log records that an administrator changed tenant settings, but not **which** setting. Power Monitor crosses the interval between two readings with those events. Treat **Changed by** as a strong indication, not proof.
* Authorship identification depends on activity event collection being enabled in [Settings › Audit](/en/power-monitor/configuracoes/auditoria.md).
## All Settings tab
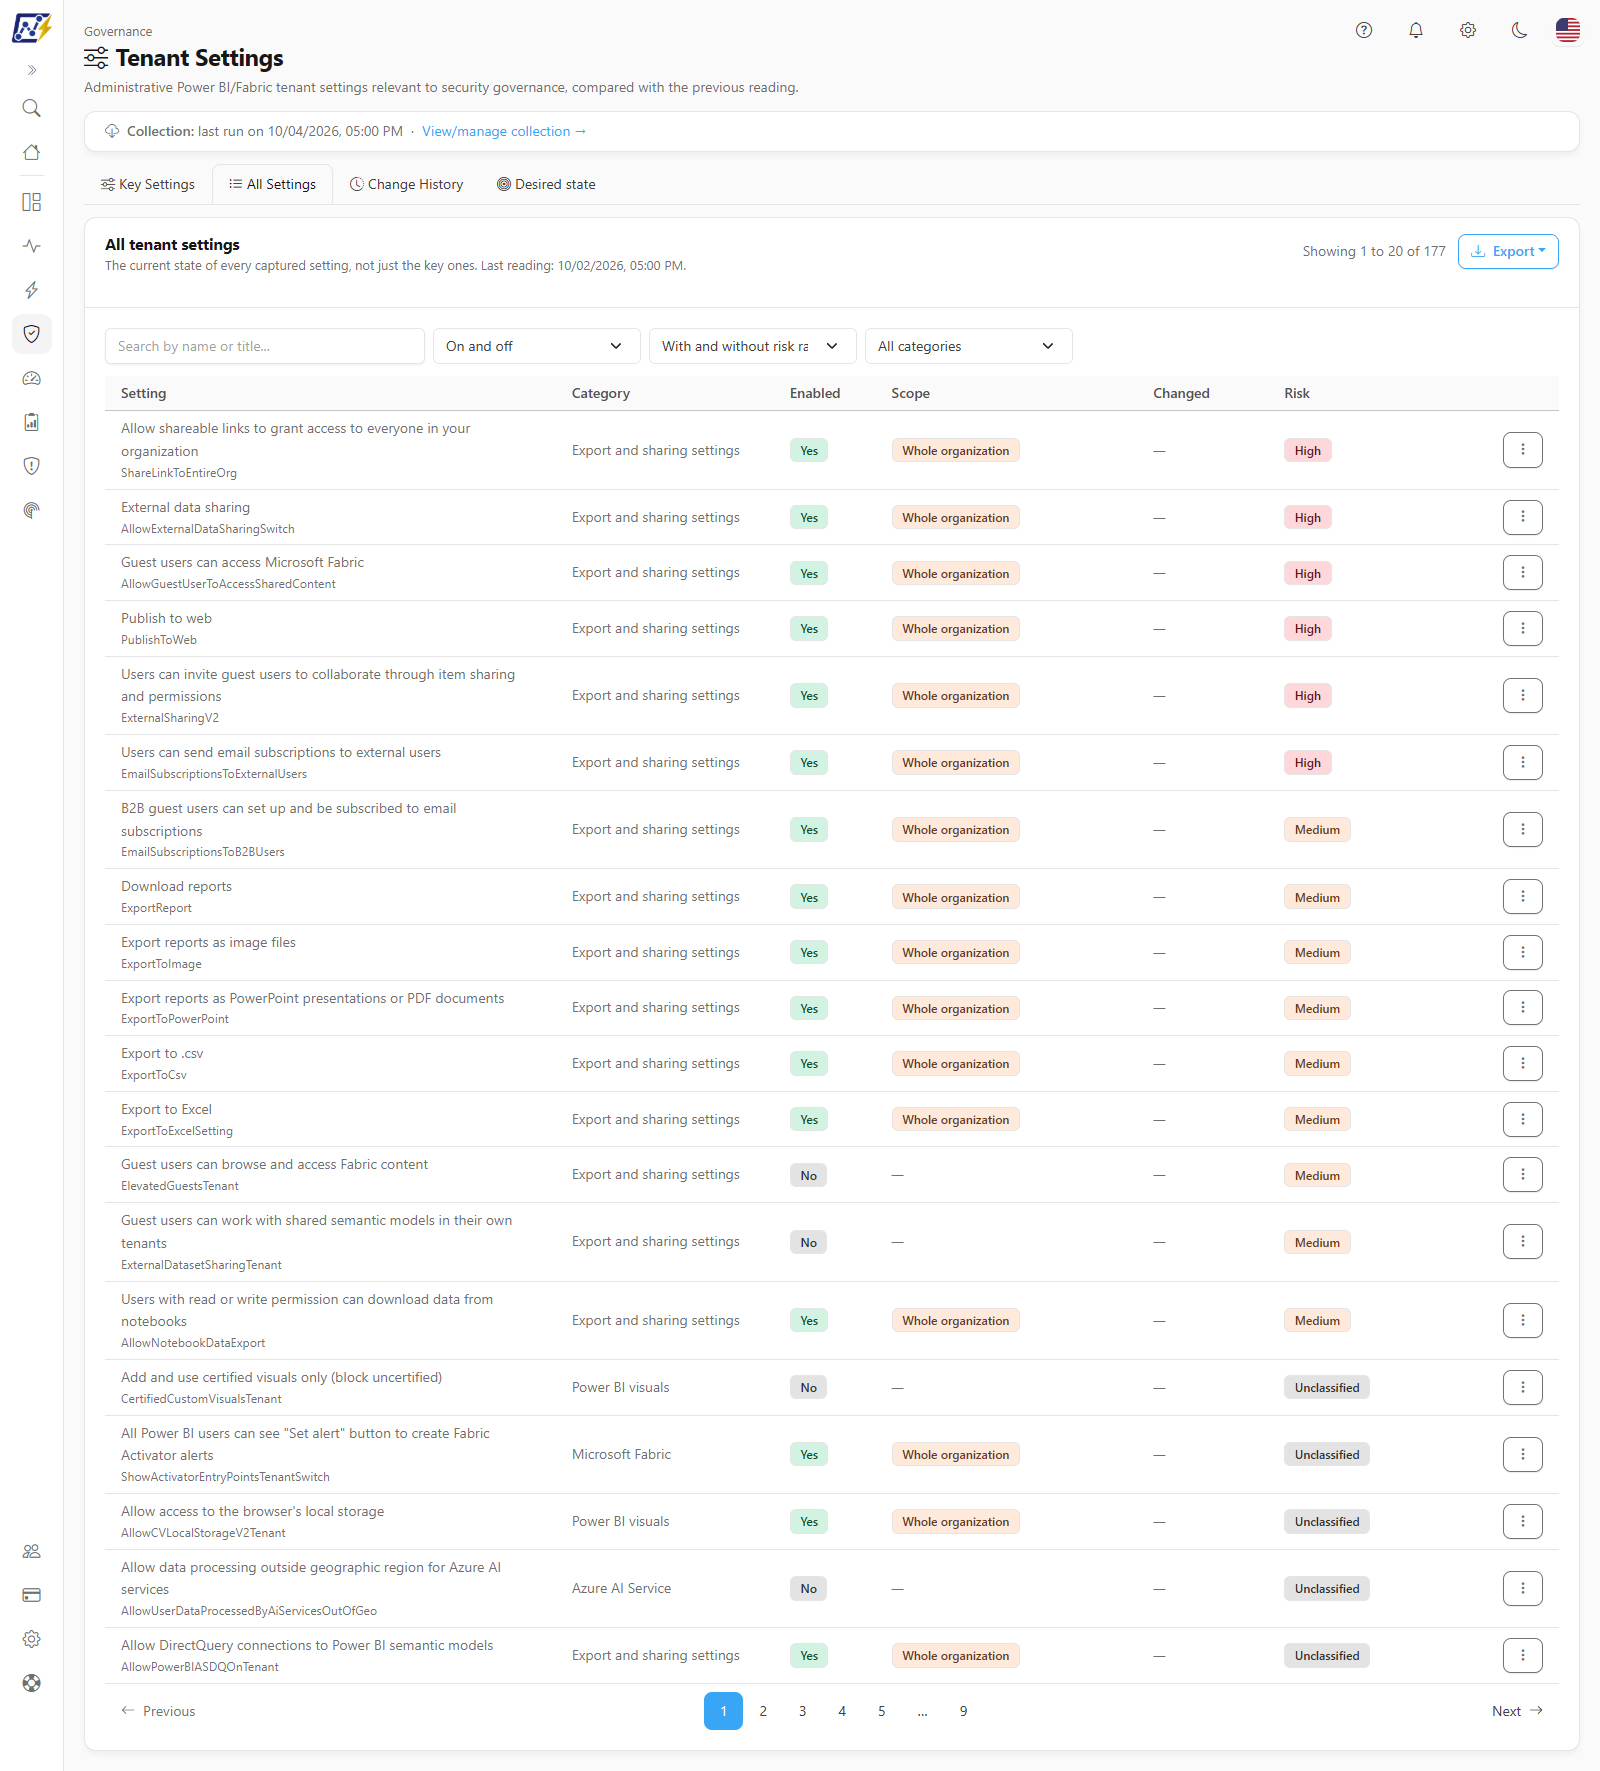
All Settings tab
It shows the **current state of all captured settings** (*not just the key ones*). The filters combine state (**On and off**, **Only the ones turned on**, **Only the ones turned off**), risk (**With and without risk rating**, **Only the rated ones**, **Only the unrated ones**) and portal category (**All categories** or one category; **Other** groups those without a category), plus the search. The table has the columns **Setting**, **Category**, **Enabled**, **Scope**, **Changed** and **Risk**, is paginated (20 rows per page by default, with the **Items per page** selector: 10, 20, 25, 50 or 100) and shows *Showing \[from] to \[to] of \[total]* next to the **Export** button. Any change to the filters or the search goes back to the first page. The **⋮** menu of each row (also opened with right-click) offers **Details**, **View history** and **Set desired state**; for non-Administrators the last one appears disabled, with the hint *Only administrators set the desired state.* **Export** (**CSV** or **JSON**) takes the whole filtered list, not just the current page, with the same columns as the export of the **Key Settings** tab, except **Risk description**.
If the collection has not saved any capture yet, the tab shows *The collection has not saved any capture yet.*
## Change History tab
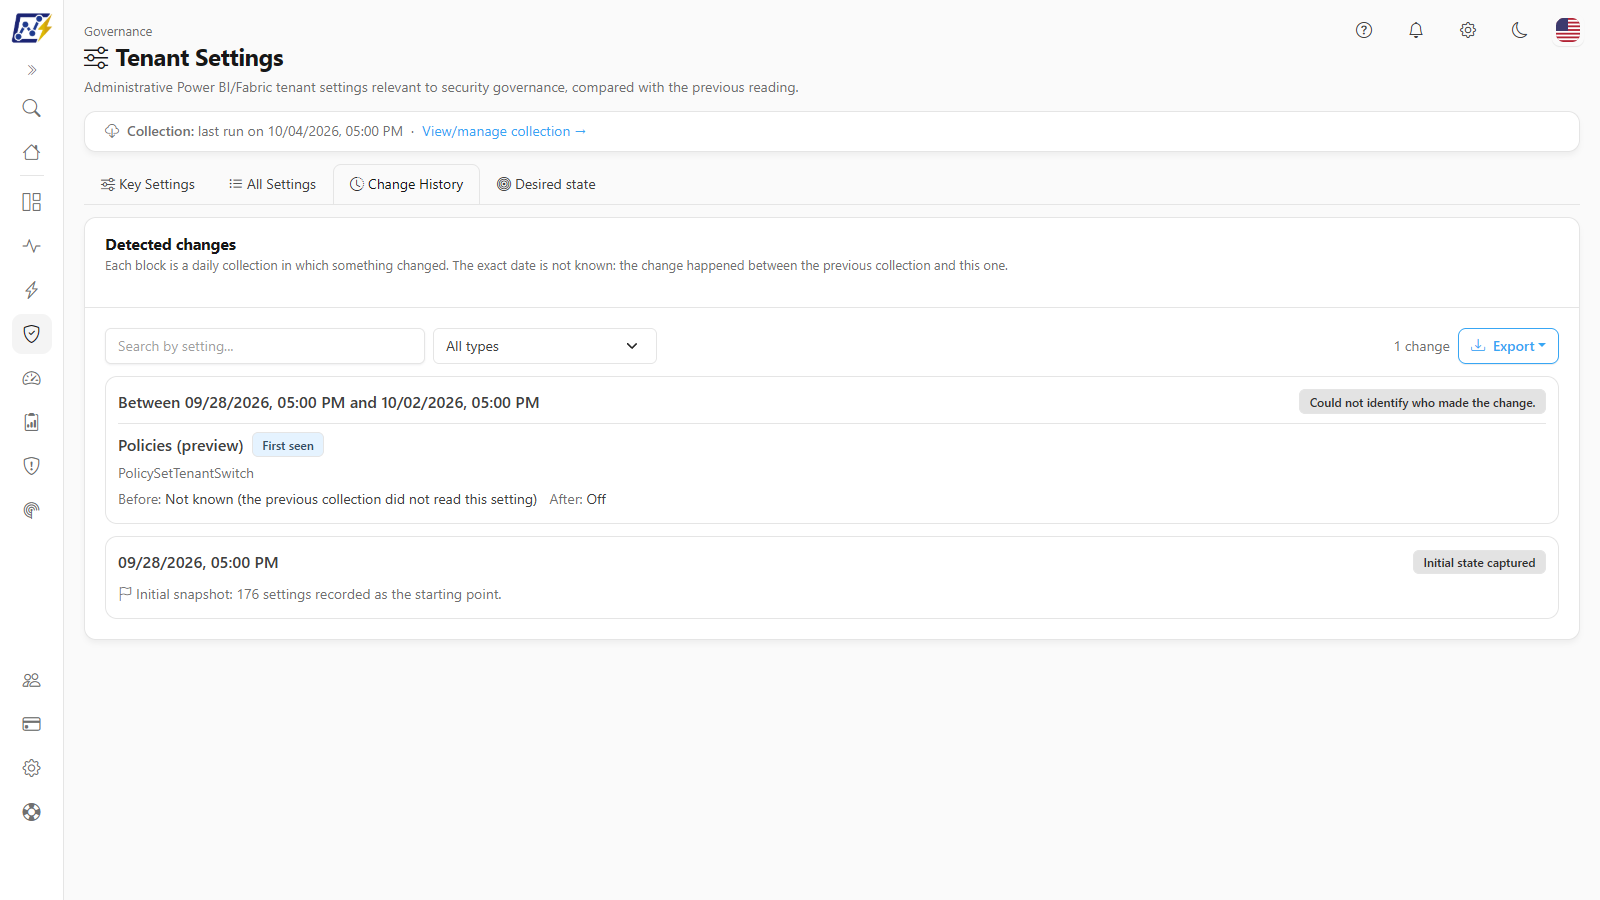
Change History tab
It lists the **Detected changes** of all settings. Each block is a **daily collection in which something changed**: the exact date is unknown, because the change happened **between the previous collection and this one** (*Between \[date] and \[date]*). Inside the block, each setting shows the **Before** and **After** (**Off**, **On**, **On for the whole organization** or **On for the groups: ...**), the **groups added** and **removed** and the likely authorship. The first block is the **initial snapshot** (*N settings recorded as the starting point*).
The filters are the **Search by setting...** search and **Filter by change type** (**All types**, **Turned on**, **Turned off**, **Scope changed**, **First seen**, **Details changed**). The tab exports the history (it includes **Collection**, **Previous collection**, **Change type**, **Changed by** and the groups). When there are many collections, *Showing only the most recent captures.* appears.
## Desired state tab
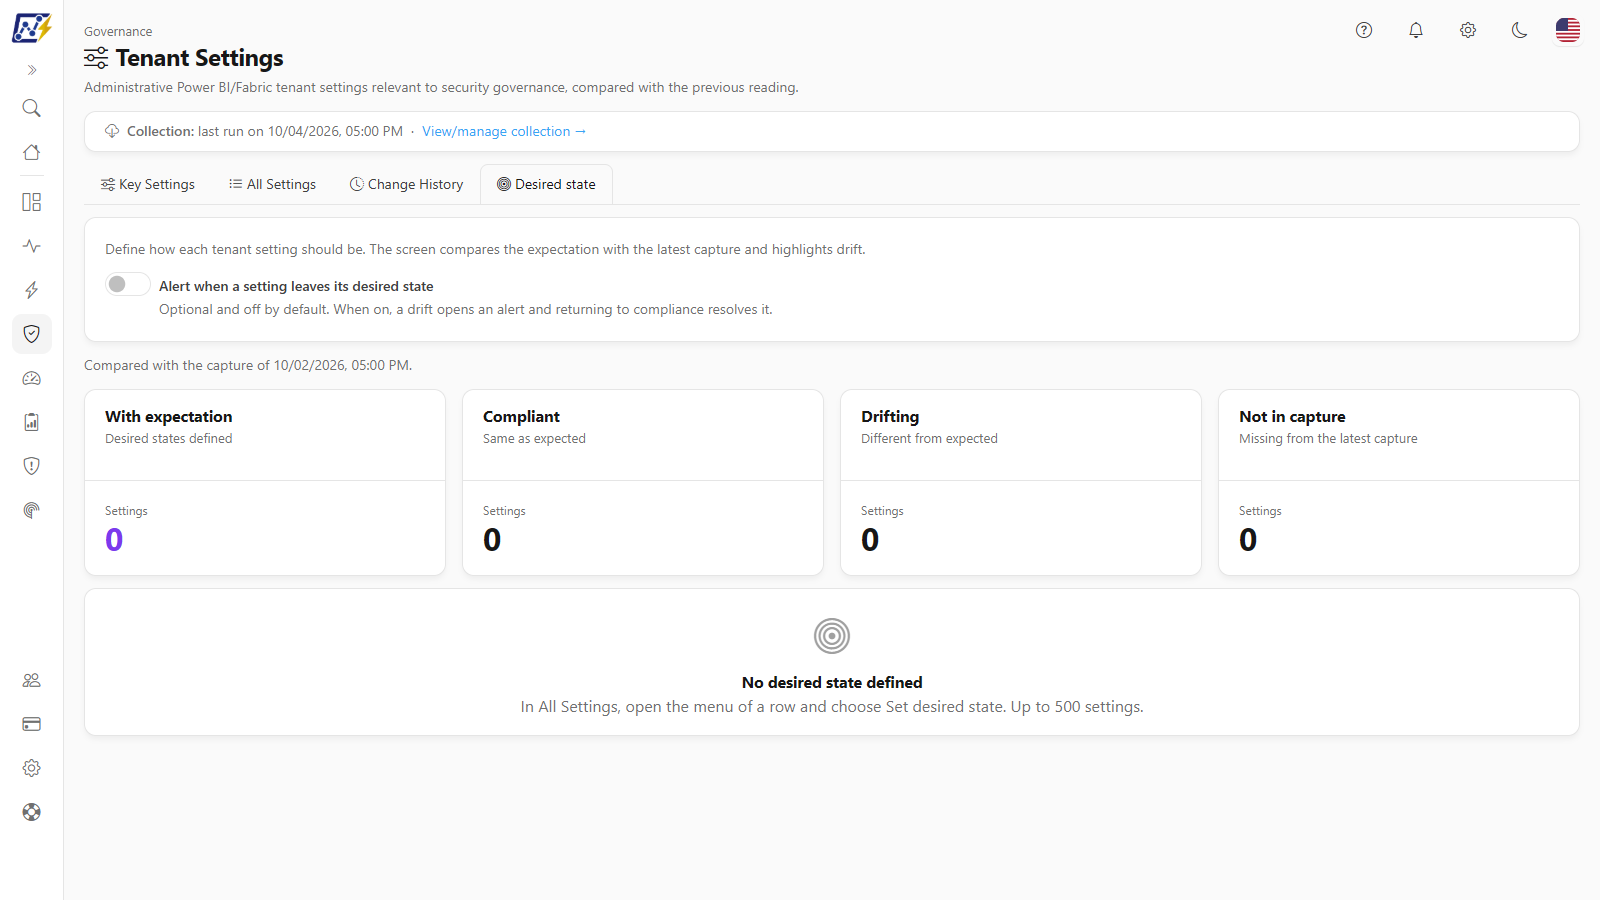
Desired state tab
Here the organization defines **how each tenant setting should be**, and the screen compares the expectation with the latest capture, highlighting **drift**. **Only Administrators see and set the desired state** (other profiles see the message *Only administrators can see and set the desired state of the settings.*).
**Cards:** **With expectation** (*Desired states defined*), **Compliant** (*Same as expected*), **Drifting** (*Different from expected*) and **Not in capture** (*Missing from the latest capture*). The screen reports *Compared with the capture of \[date].* and, if there is no capture yet, that it is not possible to say whether anything is compliant or drifting.
**Table:** **Setting**, **Status** (**Compliant**, **Drift** or **Not in capture**), **Enabled**, **Scope** and **Note**, showing **Expected** against **Current** (a dash in **Current** when the setting is not in the capture). The filters are in the column headers: the **Search settings** field in **Setting** and the **All statuses** list in **Status**. The default order puts what needs attention first (**Drift**, then **Not in capture** and finally **Compliant**) and the **Setting** and **Status** columns can be re-sorted. The table shows 10 rows per page, with the **Items per page** selector. While no expectation exists, *No desired state defined* appears, pointing to **Set desired state** on the **All Settings** tab.
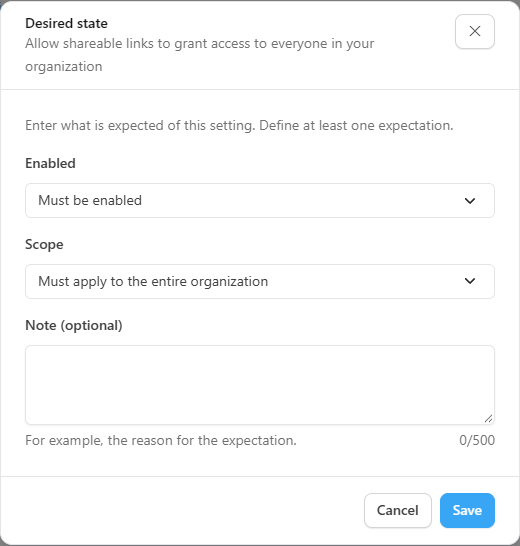
**Defining an expectation:** on the **All Settings** tab, open the ⋮ menu of the row (or right-click it) and choose **Set desired state**. If the setting already has an expectation, the **Desired state** window opens filled with it; otherwise, with the current value. In the window:
| Field | Options |
| ------------------- | ------------------------------------------------------------------------------------------------------------------------------------------ |
| **Enabled** | **Not set**, **Must be enabled** or **Must be disabled** |
| **Scope** | **Must apply to the entire organization** or **Must be restricted to specific groups** (does not apply to a setting that must be disabled) |
| **Note (optional)** | For example, the reason for the expectation (up to 500 characters) |
Desired state window
At least one expectation must be defined. Each organization can define expectations for up to **500** settings. The ⋮ menu of each row on the **Desired state** tab also has **Set as expected from the current value** (copies the current state from the latest capture; unavailable, with the hint *The setting is not in the latest capture.*, when it is not in the capture), **Edit expectation** and **Remove**. The menu also opens with right-click on the row. **Remove** asks for confirmation (*Remove the desired state?*) and the setting stops being compared.
**Drift alert (optional):** the **Alert when a setting leaves its desired state** switch is **on** for organizations installed from 2026-10-07 onward and **off** for older organizations. When on, a drift opens an alert (one per setting, handled like the others in [Alerts](/en/power-monitor/monitoramento/alertas.md)) and returning to compliance resolves it. The evaluation happens at each collection. The option also appears in *Settings › Monitoring*, in the **Audit, security and compliance** section (**Tenant settings drift alert**). With the alert off, the screen still shows the drift; nothing is simply notified.
The desired state feeds the **Tenant settings in line with the desired state** control of the [Compliance posture](/en/power-monitor/governanca/conformidade/postura-de-conformidade.md).
## Rules and behavior
* **Where the data comes from:** the Microsoft Fabric admin API (tenant settings), read by the organization's Service Principal. The collection is **read-only**: Power Monitor never changes tenant settings.
* **Required permission:** the same read-only admin API permission used by the scans (the **Service principals can access read-only admin APIs** tenant setting, enabled for the security group that contains the Service Principal). See [Additional Permissions](/en/power-monitor/configuracoes/permissoes-adicionais.md) and the step-by-step guide in [Mapping › Domains](/en/power-monitor/mapeamento/dominios.md#how-to-enable-the-domain-collection-permission). If the permission is missing, the run shows as **Failed** in the collection run history.
* **Frequency:** daily by default, at 12:00 (Brasília time). In *Settings › Monitoring* an Administrator can turn the collection on or off and choose the **Daily**, **Weekly** or **Monthly** frequency (see [Settings › Monitoring](/en/power-monitor/configuracoes/monitoramento.md#run-frequency)). With **Weekly** or **Monthly**, the screen shows the last collected information until the next run. Changes made in Fabric appear after the next collection, or right away when an Administrator uses **Run now** in *Mapping › Tenant Settings*.
* **What is stored:** the first collection records the state of all tenant settings; the next ones record **only the settings that changed**. The current state is rebuilt from that history.
* **Authorship:** estimated from the activity events for tenant settings changes (the same ones in [Events Overview](/en/power-monitor/auditoria/geral-de-eventos.md)), in the interval between two readings.
* **Dates** are shown in your browser's time zone.
* **Hide data:** if the option is on in your browser (it is shared across screens and has its button on other pages), names and identifiers of security groups and the users pointed out as authors appear masked in the details and history windows, in the **Change History** and in the CSV export.
* **Mobile:** on small screens the tabs become a drop-down menu and the tables become cards.
### Monitored settings
The risk catalog considers a setting a **risk** when it is **enabled**:
| Technical name | Risk | Why it matters |
| ------------------------------------- | ------ | --------------------------------------------------------------------------------------------- |
| `PublishToWeb` | High | Content can be published to a public internet link, with no access control |
| `ShareLinkToEntireOrg` | High | Sharing links can give access to anyone in the organization, without an individual invitation |
| `AllowExternalDataSharingSwitch` | High | Data can be shared directly with another Microsoft 365 tenant |
| `ExternalSharingV2` | High | Users can invite external (B2B) guests to collaborate through item sharing |
| `AllowGuestUserToAccessSharedContent` | High | Guest users (outside the organization) can access Fabric content |
| `EmailSubscriptionsToExternalUsers` | High | E-mail subscriptions can be sent to recipients outside the organization |
| `EmailSubscriptionsToB2BUsers` | Medium | B2B guests can set up and receive e-mail subscriptions |
| `ElevatedGuestsTenant` | Medium | Guest users can browse and access Fabric content beyond what was shared directly with them |
| `ExternalDatasetSharingTenant` | Medium | Guest users can work with semantic models shared from their own tenant |
| `ExportReport` | Medium | Reports can be downloaded from the Power BI Service outside the platform's control |
| `ExportToCsv` | Medium | Visual data can be exported as a .csv file |
| `ExportToExcelSetting` | Medium | Data can be exported to Excel |
| `ExportToPowerPoint` | Medium | Reports can be exported as a PowerPoint presentation or PDF |
| `ExportToImage` | Medium | Reports can be exported as an image file |
| `AllowNotebookDataExport` | Medium | Whoever has read or write permission can download raw notebook data |
Settings that do not exist in your tenant simply do not appear in the list.
## How to use: common tasks
### How to review tenant exposure
{% stepper %}
{% step %}
### Open the screen
Go to *Governance › Tenant › Tenant Settings* and check the **Last reading** date.
{% endstep %}
{% step %}
### Read the Enabled at risk card
See how many **High risk** and **Medium risk** settings are enabled.
{% endstep %}
{% step %}
### Review the most exposed rows
In the list, prioritize rows with **Yes** in **Enabled**, **Whole organization** in **Scope** and **High** risk. Assess whether the setting can be disabled or restricted to security groups.
{% endstep %}
{% step %}
### Keep the evidence
Click **Export** › **CSV** to attach the current state to your security review.
{% endstep %}
{% endstepper %}
### How to investigate a setting that changed
{% stepper %}
{% step %}
### Locate the change
On the **Changes since the last reading** card, see how many settings changed. In the list, find the rows with the **Changed** badge (or open the **Change History** tab to see all collections).
{% endstep %}
{% step %}
### Open the history
Use **⋮ › View history** on the row. Compare the most recent entry with the previous one to see what changed (enablement or groups).
{% endstep %}
{% step %}
### Identify who is responsible
Read the authorship badge. With **Changed by**, confirm with the indicated person; with **Possibly changed by**, check with each candidate; with **Not yet possible to identify who made the change.**, come back later.
{% endstep %}
{% step %}
### Confirm in the activity log
To see the full event, open [Events Overview](/en/power-monitor/auditoria/geral-de-eventos.md) and filter by the period between the two readings and by the administration category.
{% endstep %}
{% endstepper %}
### How to define the desired state and detect drift (Administrator)
{% stepper %}
{% step %}
### Choose the setting
On the **All Settings** tab, open the **⋮** menu of the setting and click **Set desired state**.
{% endstep %}
{% step %}
### Enter the expectation
Choose whether it must be enabled or disabled and, if enabled, whether it must apply to the whole organization or be restricted to groups. Save.
{% endstep %}
{% step %}
### Follow up
On the **Desired state** tab, see **Compliant** and **Drifting**. For settings that are already as you want them, use **Set as expected from the current value**.
{% endstep %}
{% step %}
### (Optional) Get alerts
Turn on **Alert when a setting leaves its desired state** to be notified of every drift.
{% endstep %}
{% endstepper %}
### How to refresh the reading after changing a setting in Fabric
Requires the **Administrator** profile.
1. Change the setting in the Fabric admin portal.
2. In *Mapping › Tenant Settings*, click **Run now**.
3. Wait for the run to show as **Completed** and reload *Governance › Tenant › Tenant Settings*. The changed setting appears with the **Changed** badge and a new entry in **View history**.
## Frequently asked questions
Why does the main tab not show all the tenant settings?
It is limited to the risk catalog: settings that, when enabled, increase data exposure. All settings are collected and can be seen on the **All Settings** tab.
All settings show as "Changed". Is that right?
Yes, on the organization's first reading. With no previous reading to compare, all count as changed. From the next detected change on, only the settings that really changed are flagged.
The "Last reading" date is old. Did the collection stop?
Not necessarily. A new reading is only recorded when some tenant setting changes. To confirm the collection runs every day, see the **Collection** status at the top of the screen and the run history in *Mapping › Tenant Settings*.
Is "Changed by" guaranteed?
No. The Fabric activity log says that someone changed tenant settings, but not which setting. Power Monitor crosses the interval between readings with those events. With a single person in the interval, the indication is strong; with more than one, the screen shows all of them as possible authors.
Can Power Monitor disable a risk setting?
No. The screen is read-only with respect to the tenant. Changes must be made by a Fabric administrator in the admin portal (**Tenant settings**). The **Desired state** only records the expectation and points out drift.
I do not see the Desired state tab.
For non-Administrators the tab shows only a message. Defining and viewing the desired state is exclusive to Administrators.
## Related pages
* [Governance](/en/power-monitor/governanca.md)
* [Tenant](/en/power-monitor/governanca/tenant.md)
* [Public Links](/en/power-monitor/governanca/conformidade/links-publicos.md)
* [Organization-wide Links](/en/power-monitor/governanca/conformidade/links-para-toda-a-organizacao.md)
* [Compliance posture](/en/power-monitor/governanca/conformidade/postura-de-conformidade.md)
* [E-mail Subscriptions](/en/power-monitor/auditoria/assinaturas-de-e-mail.md)
* [Events Overview](/en/power-monitor/auditoria/geral-de-eventos.md)
* [Settings › Audit](/en/power-monitor/configuracoes/auditoria.md)
* [Additional Permissions](/en/power-monitor/configuracoes/permissoes-adicionais.md)
---
# Agent Instructions
This documentation is published with GitBook. GitBook is the documentation platform designed so that both humans and AI agents can read, navigate, and reason over technical content effectively. Learn more at gitbook.com.
## Querying This Documentation
If you need additional information that is not directly available in this page, you can query the documentation by asking a question.
Perform an HTTP GET request on the following URL with the `ask` and `goal` query parameters:
```
GET https://docs.powermonitor.com.br/en/power-monitor/governanca/tenant/configuracoes-do-tenant.md?ask=&goal=
```
`ask` is the immediate question: it should be specific, self-contained, and written in natural language.
`goal` is what the user is ultimately trying to achieve, the reason they need the answer. Sharing it helps GitBook give you a better, more relevant answer. A goal is most helpful when it describes the outcome the user wants rather than restating the question. For example, with `ask=how do I create an API token`, a goal like `automate deployments from our CI pipeline` lets GitBook tailor the answer to that use case.
The response will contain a direct answer to the question and relevant excerpts and sources from the documentation.
Use this mechanism when the answer is not explicitly present in the current page, you need clarification or additional context, or you want to retrieve related documentation sections.