> For the complete documentation index, see [llms.txt](https://docs.powermonitor.com.br/llms.txt). Markdown versions of documentation pages are available by appending `.md` to page URLs; this page is available as [Markdown](https://docs.powermonitor.com.br/en/power-monitor/governanca/tenant/dominios.md).
# Domains
Microsoft Fabric organizational domains and subdomains in a tree, with the number and percentage of assigned workspaces, default label and governance attention signals.
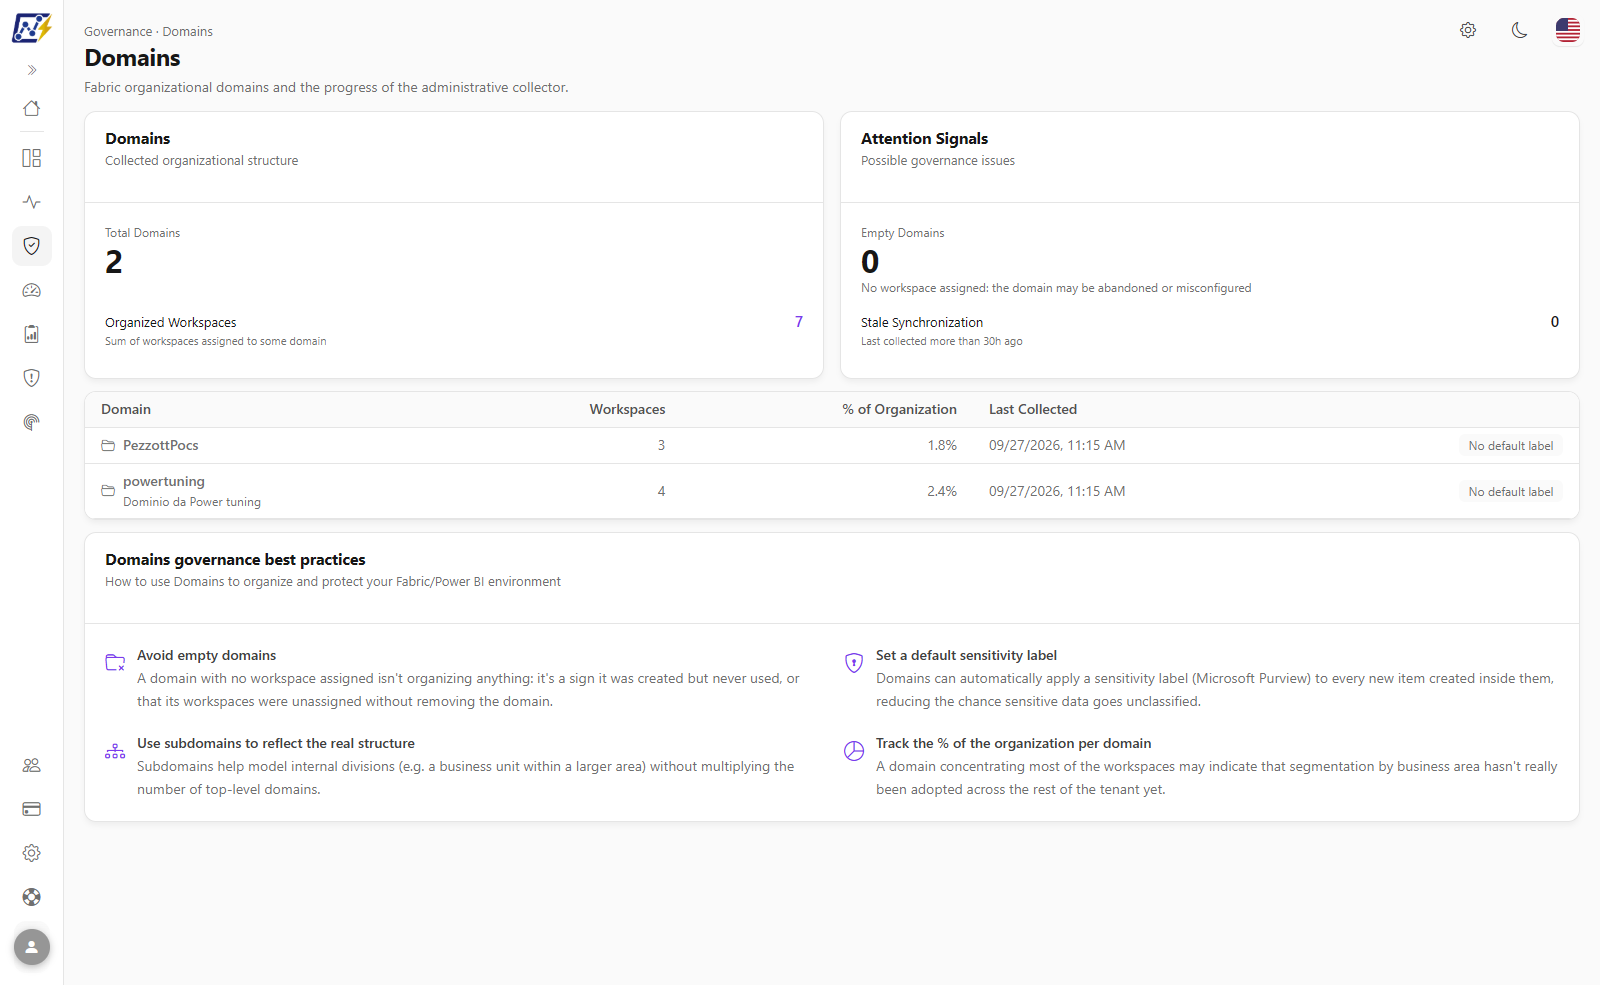
The **Domains** screen shows the structure of your tenant's Microsoft Fabric **organizational domains**, as a tree (domains and subdomains), with how many workspaces are assigned to each one, the percentage of the organization this represents and governance attention signals, such as empty domains or domains without a default sensitivity label.
**How to access:** menu *Governance › Tenant › Domains* (last item of the Tenant group, at the end of the Governance menu). The screen is read-only and is available to all user profiles. Tracking and triggering the domain collection is done in *Mapping › Domains*, an area exclusive to **Administrators**.
Governance › Tenant › Domains
## What it is for
* **Understand how the tenant is organized by business area**: which domains and subdomains exist and how workspaces are distributed among them.
* **Measure domain adoption**: track how much of the organization is already under some domain.
* **Find governance problems**: domains created and never used (empty), domains without a default sensitivity label and outdated information.
## Screen overview
1. **Header** with the title **Domains** and the subtitle *Fabric organizational domains and the progress of the administrative collector.*
2. **KPI cards**: **Domains** and **Attention Signals**.
3. **Domain tree**, with domains and subdomains, numbers and badges.
4. **Domains governance best practices**, with usage recommendations.
## Features
### Domains card
**What it is:** the **Domains** card (*Collected organizational structure*) shows the **Total Domains** (domains and subdomains collected) and, on the detail line, **Organized Workspaces** (*Sum of workspaces assigned to some domain*).
**What it is for:** measuring domain adoption: how much of the organization is already under some domain.
KPI cards of the Domains screen
**How to use:**
1. Go to *Governance › Tenant › Domains*.
2. Compare **Organized Workspaces** with the organization's total number of workspaces ([Workspaces](/en/power-monitor/governanca/workspaces.md) screen). The closer they are, the higher the adoption.
**How it works:** **Organized Workspaces** adds up the number of workspaces of each domain and subdomain, according to the last collection.
### Attention Signals card
**What it is:** the **Attention Signals** card (*Possible governance issues*) shows the **Empty Domains** and, on the detail line, the **Stale Synchronization**.
**What it is for:** finding domains that were created and never used (or emptied) and domains whose information stopped being updated.
**How to use:**
1. Check the number of **Empty Domains**: it is **highlighted** (yellow) when it is greater than zero. The footer explains: *No workspace assigned: the domain may be abandoned or misconfigured*.
2. Check **Stale Synchronization** (*Last collected more than 30h ago*), highlighted when there is at least one domain in this situation.
3. Locate these domains in the tree by the **Empty** and **Stale collection** badges.
**How it works:** a domain is **empty** when it has zero workspaces assigned; it is **stale** when its last collection occurred more than **30 hours** ago (the collection is daily, and the margin avoids alerts for small delays).
### Domain tree
**What it is:** the table with all domains, with subdomains **indented** below the parent domain. Top-level domains appear with a folder icon; subdomains, with an indent arrow.
**What it is for:** understanding how the tenant is divided by business area and where the workspaces are.
Tree of domains and subdomains
| Column | Description |
| --------------------- | -------------------------------------------------------------------------------------- |
| **Domain** | Name and, when available, the description of the domain |
| **Workspaces** | Number of workspaces assigned to the domain |
| **% of Organization** | Percentage these workspaces represent of the organization's total number of workspaces |
| **Last Collected** | Date and time of the domain's last collection |
| *(badges)* | Governance signals of the domain (see the next feature) |
**How to use:**
1. Browse the tree from top to bottom; read the domain description below the name, when available.
2. For each row, check **Workspaces**, **% of Organization**, **Last Collected** and the badges on the right.
3. In the **% of Organization** column, check whether a single domain concentrates most of the workspaces.
**How it works:** the tree has no filters, sorting or export; the **⋮** button on each row (or a right-click) opens **View details** (see [Domain details](#domain-details)). **% of Organization** uses the organization's total number of workspaces in Power Monitor as its base. When the collection has not yet run for the organization, *No domain collected yet. The administrative collector hasn't run for this organization yet.* appears.
### Domain governance badges
**What it is:** badges displayed to the right of each row of the tree:
| Badge | Color | Meaning |
| -------------------- | ------ | ----------------------------------------------------------------------------- |
| **Default label** | Blue | The domain applies a default Microsoft Purview sensitivity label to new items |
| **No default label** | Gray | The domain does not have a default sensitivity label configured |
| **Empty** | Yellow | No workspace assigned to the domain |
| **Stale collection** | Red | The domain's last collection occurred more than 30 hours ago |
**What it is for:** identifying, row by row, what needs to be adjusted in the Fabric admin portal.
**How to use:** look for the **Empty**, **No default label** and **Stale collection** badges and handle each domain as described in [How to identify domains that need attention](#how-to-identify-domains-that-need-attention).
### Domain details
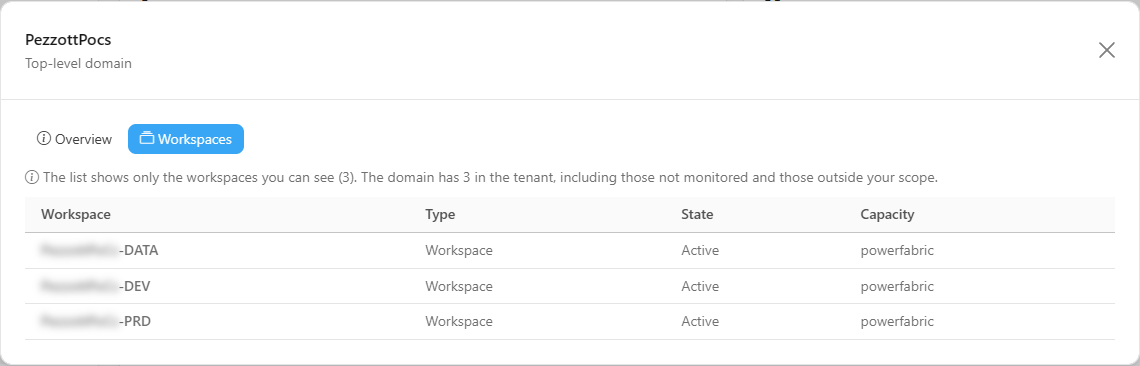
**What it is:** the modal of a domain, opened by the row's **⋮** button (**More actions**) › **View details**, or by right-clicking the row. The subtitle says whether it is a *Top-level domain* or a *Subdomain of* another domain.
**What it is for:** seeing at once the size of the domain, its governance signals and which workspaces belong to it.
Details of a domain
**How to use:**
1. Click the **⋮** button on the domain row (or right-click the row) and choose **View details**.
2. Read the **Overview** tab.
3. Click the **Workspaces** tab to see the domain's workspaces.
**How it works:**
* The **Overview** tab follows the [common structure](/en/power-monitor/governanca/relatorios.md#the-overview-tab), with the **Workspaces in the tenant**, **% of the organization**, **Subdomains** and **Last collection** indicators and the **General information** (name, description, parent domain, level, domain ID) and **Governance signals** (default sensitivity label and the domain's attention points) sections.
* **Workspaces in the tenant** counts all the domain's workspaces, including those not monitored and those outside your scope.
* The **Workspaces** tab is loaded the first time you open it and lists **Workspace**, **Type**, **State** and **Capacity** (*No capacity* when there is none). It shows only the workspaces you can see; the note above the table compares that number with the domain's total in the tenant.
* If the list has not been collected yet, or if no workspace is visible to you, the tab asks you to wait for the next Domains collection. Very large lists show only the first items, with a notice.
### Domains governance best practices
**What it is:** a fixed card at the end of the screen with four recommendations: **Avoid empty domains**, **Set a default sensitivity label**, **Use subdomains to reflect the real structure** and **Track the % of the organization per domain**.
**What it is for:** guiding tenant administrators on how to use domains to organize and protect the Fabric/Power BI environment.
Domains governance best practices
**How it works:** the card is guidance only; it does not depend on the collected data.
### Error state
**What it is:** when the domains cannot be loaded, the screen shows **Unable to load** (*Could not load the collected domains. Please try again.*).
**How to use:** click **Try again**.
## Rules and behavior
* **Data source:** the domains and the workspace count of each one are read from the Fabric admin APIs by the organization's Service Principal, in a **daily** collection (around 06:15, Brasília time, UTC-3).
* **Prerequisites:** the organization must have a Service Principal configured with permission to read the Fabric admin APIs. Checking and granting this permission is done in *Mapping › Domains*.
* **% of Organization** uses the organization's total number of workspaces in Power Monitor as its base.
* **Isolated failure:** if the workspace count of a domain fails in a collection, the domain remains listed (with zero workspaces in that collection) and the others are not affected. A domain with **Stale collection** indicates that the latest collections could not update it.
* **No domains:** until the collection has run for the organization, the screen shows "No domain collected yet."
## How to use: common tasks
### How to identify domains that need attention
{% stepper %}
{% step %}
#### Check the indicators
On the **Attention Signals** card, see how many **Empty Domains** exist (the number is highlighted when it is greater than zero) and how many have **Stale Synchronization**.
{% endstep %}
{% step %}
#### Locate the domains in the tree
Look for the **Empty** (yellow), **No default label** (gray) and **Stale collection** (red) badges in the column on the right of the tree.
{% endstep %}
{% step %}
#### Fix them in Fabric
Empty domains and default sensitivity labels are adjusted in the Fabric admin portal. A stale collection is handled in *Mapping › Domains* (see the next item). The fixes appear here after the next collection.
{% endstep %}
{% endstepper %}
### How to review domain adoption
{% stepper %}
{% step %}
#### See the totals
On the **Domains** card, compare **Organized Workspaces** with the organization's total number of workspaces ([Workspaces](/en/power-monitor/governanca/workspaces.md) screen).
{% endstep %}
{% step %}
#### Handle the attention signals
Check the **Empty Domains** and the **No default label** badges in the tree. Remove or reuse empty domains and configure default labels in the Fabric admin portal.
{% endstep %}
{% step %}
#### Track the concentration
In the **% of Organization** column, check whether a single domain concentrates most of the workspaces, a sign that segmentation by business area has not really been adopted yet.
{% endstep %}
{% endstepper %}
### How to refresh the domains before the daily collection
Use this when you have just created or changed domains in Fabric and do not want to wait for the daily collection.
{% hint style="info" %}
Exclusive to the **Administrator** profile: the *Mapping* area is only displayed to administrators.
{% endhint %}
{% stepper %}
{% step %}
#### Open the Domains page
Go to *Mapping › Domains*.
{% endstep %}
{% step %}
#### Check the permissions (if necessary)
If this is the first collection or if the last one failed due to permissions, click **Check permissions** and follow the **Instructions** displayed.
{% endstep %}
{% step %}
#### Trigger the collection
Click **Run now**. The message "Domain collection queued. The history updates when it starts." confirms the request, and the screen follows the run until it ends; if a run is already in progress, the screen shows "A domain collection is already running for this organization.".
{% endstep %}
{% step %}
#### Check the result
When the run finishes, go back to *Governance › Tenant › Domains*: the **Last Collected** column shows the new date and the numbers are updated.
{% endstep %}
{% endstepper %}
## Frequently asked questions
I created a domain in Fabric and it does not appear here.
The domain collection is daily. The new domain appears after the next run. Administrators can trigger the collection manually in *Mapping › Domains*.
What does the "Stale collection" badge mean?
The last successful collection of that domain occurred more than 30 hours ago. Check in *Mapping › Domains* whether the collection is failing or paused, and whether the Service Principal still has the necessary permissions.
Why doesn't the screen show which workspaces are in each domain?
The screen shows the **number** and the **percentage** of workspaces per domain. The individual assignment of each workspace is checked in the Fabric admin portal.
## Related pages
* [Workspaces](/en/power-monitor/governanca/workspaces.md)
* [Mapping](/en/power-monitor/mapeamento.md)
* [Domains Scan](/en/power-monitor/mapeamento/dominios.md)
* [Governance](/en/power-monitor/governanca.md)
---
# Agent Instructions
This documentation is published with GitBook. GitBook is the documentation platform designed so that both humans and AI agents can read, navigate, and reason over technical content effectively. Learn more at gitbook.com.
## Querying This Documentation
If you need additional information that is not directly available in this page, you can query the documentation by asking a question.
Perform an HTTP GET request on the following URL with the `ask` and `goal` query parameters:
```
GET https://docs.powermonitor.com.br/en/power-monitor/governanca/tenant/dominios.md?ask=&goal=
```
`ask` is the immediate question: it should be specific, self-contained, and written in natural language.
`goal` is what the user is ultimately trying to achieve, the reason they need the answer. Sharing it helps GitBook give you a better, more relevant answer. A goal is most helpful when it describes the outcome the user wants rather than restating the question. For example, with `ask=how do I create an API token`, a goal like `automate deployments from our CI pipeline` lets GitBook tailor the answer to that use case.
The response will contain a direct answer to the question and relevant excerpts and sources from the documentation.
Use this mechanism when the answer is not explicitly present in the current page, you need clarification or additional context, or you want to retrieve related documentation sections.