> For the complete documentation index, see [llms.txt](https://docs.powermonitor.com.br/llms.txt). Markdown versions of documentation pages are available by appending `.md` to page URLs; this page is available as [Markdown](https://docs.powermonitor.com.br/en/power-monitor/governanca/tenant/licencas-power-bi.md).

# Power BI Licenses

See who has Power BI Free, Pro or Premium Per User, where each license comes from and who actually uses it, with findings, savings opportunities and the estimated savings with Power Embedded.

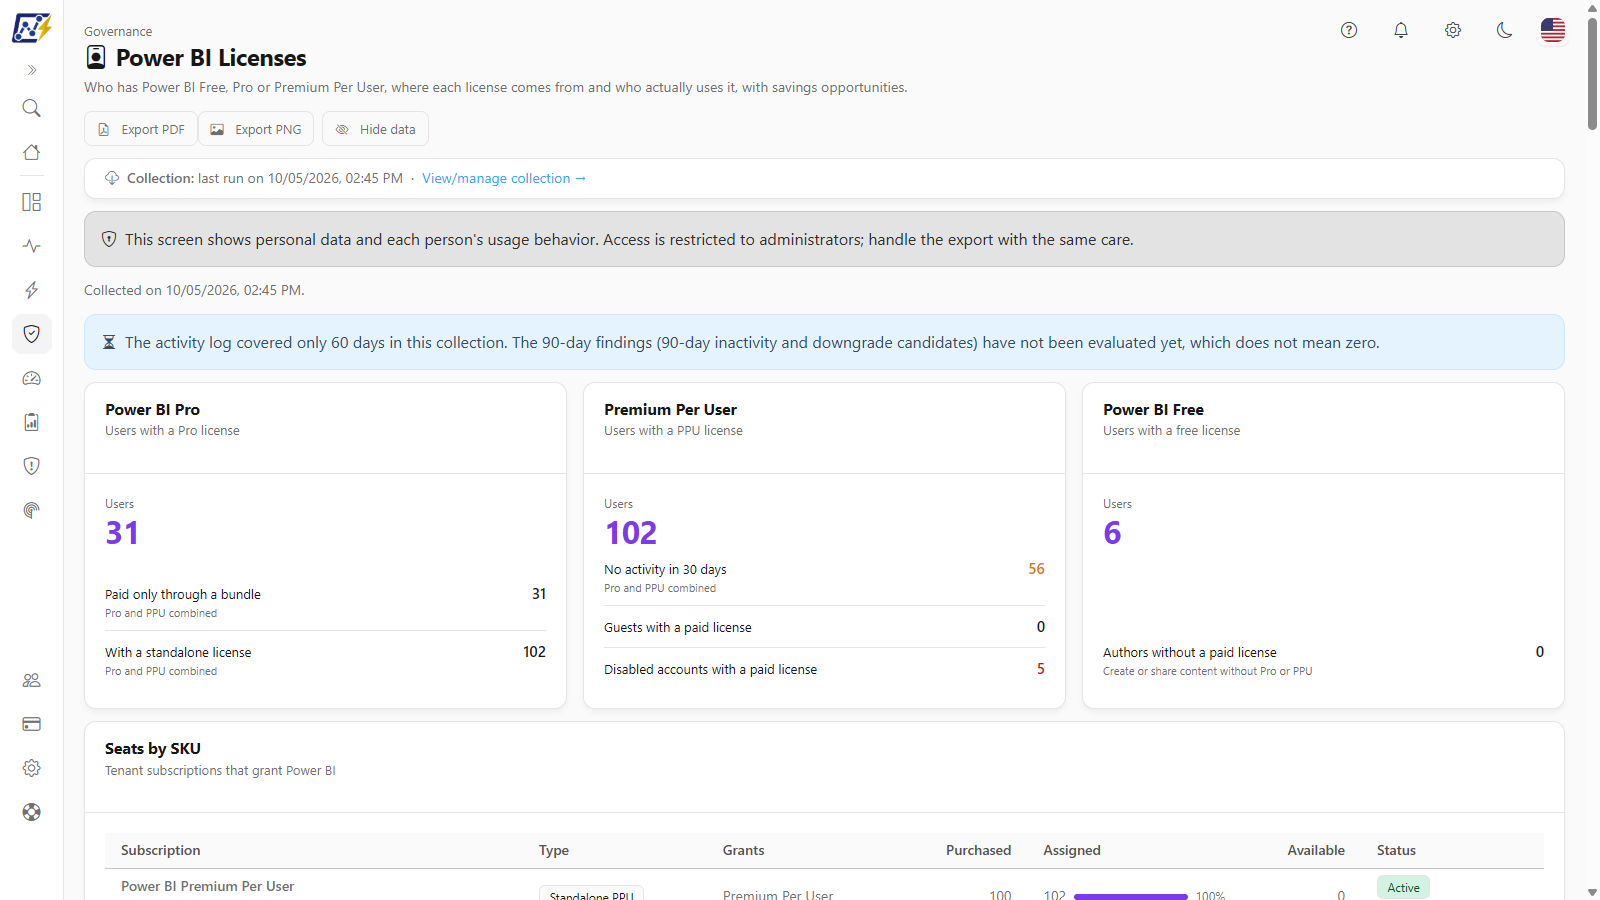
The **Power BI Licenses** screen shows, from a daily collection in **Microsoft Graph**, how many **Power BI Free**, **Pro** and **Premium Per User (PPU)** licenses exist in the tenant, how many seats were purchased and how many are assigned, **where each person's license comes from** (standalone, through a bundle such as Microsoft 365 E5, direct or through a group) and **how much each person used** Power BI and Fabric in the last 30 and 90 days, cross-referencing the license with the activity log that Power Monitor already collects. With this cross-reference, the screen points out idle or redundant licenses, or licenses larger than usage requires, and estimates how much the organization would save by releasing them.

**How to access:** *Governance › Tenant › Power BI Licenses*. The screen is exclusive to the **Administrator** profile: the item does not even appear in the menu for other profiles, and direct access through the URL is also denied.

<figure><picture><source srcset="/files/LwEVhqeJNWGIkQPeJJy0" media="(prefers-color-scheme: dark)"><img src="https://3938213054-files.gitbook.io/~/files/v0/b/gitbook-x-prod.appspot.com/o/spaces%2FH2bFRBmIfyK3kwVKbldl%2Fuploads%2Fgit-blob-b9c5cec92f49ed29d245be9bcd0093bbfbaa778f%2Fpm-governanca-licencas-power-bi-en.png?alt=media" alt="Power BI Licenses screen with the personal data notice, the Power BI Pro, Premium Per User and Power BI Free cards, the Seats by SKU table and the Savings opportunities and Findings cards"></picture><figcaption><p>Power BI Licenses</p></figcaption></figure>

{% hint style="warning" %}
The screen shows **personal data** and **each person's usage behavior** (name, email, department, last activity). That is why it is restricted to Administrators, as the banner at the top of the screen warns. Handle exported files with the same care and avoid sharing them beyond the people who need to make decisions about the licenses.
{% endhint %}

## What it is for

* **Cut waste:** find paid licenses on disabled accounts, on people with no activity for 30 or 90 days, standalone Pro licenses for people who already get Pro through a bundle, and purchased seats that nobody uses.
* **Right-size each license:** identify who has Pro and only reads content in capacities where the Free license is enough, who has PPU and does not use PPU workspaces, and who has full PPU when **PPU Add-On** would do.
* **Find assignment risks:** assignment errors in Entra ID, guests with paid licenses, authors publishing content without a paid license and free trials about to end.
* **Estimate the savings:** calculate, with your contract prices, how much the organization saves per month and per year with each opportunity, and how much it would save by moving viewers to **Power Embedded**.
* **Track the trend:** see, day by day, how many Pro, PPU and Free users there are and how many standalone seats were purchased and assigned.

## Features

### Personal data banner and collection date

**What it is:** the gray banner at the top (*This screen shows personal data and each person's usage behavior…*) and, right below it, the line *Collected on {date}.* with the moment the license snapshot was taken.

**What it is for:** reminding you that the screen contains personal data and telling you when the displayed numbers are from.

**How it works:** all numbers on the screen come from the **last completed collection**. When the date cannot be determined, *Collection date unknown.* is displayed. To refresh the numbers before the next daily collection, an Administrator uses **Run now** in [*Mapping › Power BI Licenses*](/en/power-monitor/mapeamento/licencas-power-bi.md) (see [Collection](#collection)).

The header also has the **Hide data** button, which masks names, UPNs and e-mails on screen and in exports (useful for sharing screenshots), and the **Export PDF** and **Export PNG** buttons (see [Export](#export)).

### Data quality notices

**What it is:** notices that appear above the cards when some condition limits what the collection was able to evaluate.

**What it is for:** avoiding decisions based on incomplete numbers. The screen never shows "zero inactive" when, in fact, it did not have enough data to evaluate.

| Notice                                                | When it appears                                                                                                                                                  | What to do                                                                                                                       |
| ----------------------------------------------------- | ---------------------------------------------------------------------------------------------------------------------------------------------------------------- | -------------------------------------------------------------------------------------------------------------------------------- |
| **Partial log coverage** (blue)                       | The activity log covered between 30 and 89 days in the collection. The 90-day findings (90-day inactivity and downgrade candidates) have not been evaluated yet. | Wait: coverage grows by one day for each day of log ingestion.                                                                   |
| **Insufficient log coverage** (blue)                  | The log covered less than 30 days. Not even the 30-day findings (30-day inactivity, never-used license) were evaluated.                                          | Wait. This is normal right after you start using Power Monitor.                                                                  |
| **Outdated activity log** (yellow)                    | The last event in the log is more than 3 days old: ingestion has stopped. The inactivity and never-used license findings are suspended until ingestion resumes.  | Click **Check in Mapping, Audit** and check the log collection in [Mapping › Audit](/en/power-monitor/mapeamento/auditorias.md). |
| **Incomplete user list** (yellow)                     | The Microsoft Graph user list hit the collection's page limit. Totals and lists may be lower than reality.                                                       | Contact [Support](/en/power-monitor/suporte.md).                                                                                 |
| **Permission denied in the last collection** (yellow) | The last collection was refused by Microsoft Graph due to missing permissions. The numbers shown come from the last successful collection.                       | Click **Go to Additional Permissions** and grant the permission (see [Required permission](#rules-and-behavior)).                |

**How it works:** while a finding cannot be evaluated, it appears as **Not evaluated** on the [Findings](#findings) card, on the **No activity in 30 days** line of the [Premium Per User](#indicator-cards) card and in the inactivity column of the [Departments](#departments) card (which is only **Not evaluated** with less than 7 days of log).

### Estimated savings with Power Embedded
**What it is:** the **Power Embedded** card, right above the indicators, with the sentence *Your organization could save an ESTIMATED* followed by the amount **per month** and **per year**, the basis of the calculation (*By moving N viewers with a paid Power BI license to Power Embedded.*) and the **Click here to learn about Power Embedded** and **How we calculated it** buttons.

**What it is for:** showing how much the organization would save if the people who **only view** reports no longer needed a paid Power BI license, accessing the content through [Power Embedded](https://powerembedded.com.br/) instead, a solution for publishing Power BI reports to users without a Power BI license.

<figure><picture><source srcset="/files/mObJuBdryVwoZs416tnU" media="(prefers-color-scheme: dark)"><img src="https://3938213054-files.gitbook.io/~/files/v0/b/gitbook-x-prod.appspot.com/o/spaces%2FH2bFRBmIfyK3kwVKbldl%2Fuploads%2Fgit-blob-871a624c21b7799a69308f983f28481de414fbb9%2Fpm-governanca-licencas-power-bi-power-embedded-en.png?alt=media" alt="Power Embedded card with the estimated savings per month and per year and the Click here to learn about Power Embedded and How we calculated it buttons"></picture><figcaption><p>Estimated savings with Power Embedded</p></figcaption></figure>

**How to use:**

1. Read the estimated monthly and annual amount and the number of viewers considered.
2. Click **How we calculated it** to see, step by step, who was included in the math and how each part was calculated (see below).
3. To learn about the product, click **Click here to learn about Power Embedded** (opens the website in a new tab).

**When the card appears:**

* Only when there are **positive monthly savings** and **at least one viewer** who could move.
* It does not appear for organizations that **already use Power Embedded**, before the first license collection or when no user meets the conditions of the calculation.
* The amounts appear in the **organization's currency**. When there is no US dollar exchange rate for that currency, the card shows only the notice "The Power Embedded savings estimate is unavailable: there is no US dollar exchange rate for the organization currency (*currency*).", without amounts.
* If the estimate cannot be calculated for any other reason, the card simply does not appear; the rest of the screen works normally.

#### How we calculated it

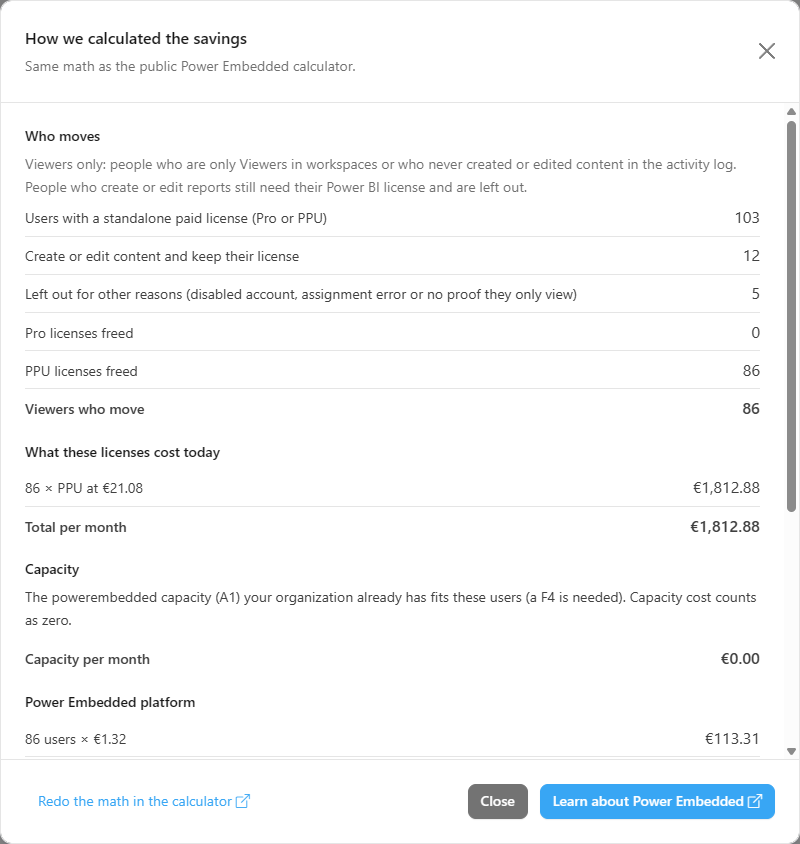
**What it is:** the **How we calculated the savings** window (*Same math as the public Power Embedded calculator.*), opened by the **How we calculated it** button.

**What it is for:** checking the assumptions before taking the estimate to a budget discussion.

<figure><picture><source srcset="/files/Il0Zr6ftkBow7zzEmpBu" media="(prefers-color-scheme: dark)"><img src="https://3938213054-files.gitbook.io/~/files/v0/b/gitbook-x-prod.appspot.com/o/spaces%2FH2bFRBmIfyK3kwVKbldl%2Fuploads%2Fgit-blob-e15ad8f65eae1c44dc6e1d88225639d384047ca4%2Fpm-governanca-licencas-power-bi-power-embedded-calculo-en.png?alt=media" alt="How we calculated the savings window with the Who moves, What these licenses cost today, Capacity and Power Embedded platform sections and the result"></picture><figcaption><p>How we calculated the savings</p></figcaption></figure>

The window has five blocks:

| Block                              | What it shows                                                                                                                                                                                                                                                                                                                                                                         |
| ---------------------------------- | ------------------------------------------------------------------------------------------------------------------------------------------------------------------------------------------------------------------------------------------------------------------------------------------------------------------------------------------------------------------------------------- |
| **Who moves**                      | How many users have a **standalone** paid license (Pro or PPU), how many **create or edit content and keep their license**, how many are left out for other reasons (disabled account, assignment error or no proof they only view) and how many **Pro**, **PPU** and **PPU Add-On** licenses would be freed, with the total of **Viewers who move**.                                 |
| **What these licenses cost today** | Each type of freed license × the list price, and the **Total per month**.                                                                                                                                                                                                                                                                                                             |
| **Capacity**                       | The capacity needed to serve the users. If one has to be purchased, it shows the SKU (for example, *A F2 capacity would be needed for 20 users.*), the reference region, the **Reserved capacity** amount and the **Taxes on the reservation**. If the organization **already has** a capacity that fits the users, it is mentioned by name and the capacity cost counts as **zero**. |
| **Power Embedded platform**        | The platform fee (users × amount per user, or a flat fee from 2,500 users), the **Monthly cost with Power Embedded** and, separately, the **Setup fee**, paid once and not part of the monthly math.                                                                                                                                                                                  |
| **Result**                         | **Licenses freed per month** minus the **Monthly cost with Power Embedded** = **Estimated monthly savings**, the **Estimated annual savings** and the percentage less than today.                                                                                                                                                                                                     |

The window footer shows the exchange rate used (*Exchange rate used: 1 USD = rate currency.*), how many days the activity log covers, the reminder that the amounts are estimated with list prices, and the **Redo the math in the calculator** (opens the public calculator in a new tab), **Close** and **Learn about Power Embedded** buttons.

**Assumptions of the calculation:**

* **Only viewers move.** The calculation includes users with an effective **standalone Pro or PPU** license, an active account and who **never created or edited content** (Power BI reports or Fabric items) in the whole available activity log, and who, in addition, are **only Viewers** in all workspaces **or** have at least 30 days of log proving they never created content. People who create or edit reports still need their Power BI license and are left out of the calculation.
* **Bundle licenses do not count.** People who get Power BI through a bundle (such as Microsoft 365 E5) keep the bundle; only the standalone license is freed. For people who have **PPU Add-On** on top of a bundle, the savings are only the Add-On price.
* **List prices.** Pro and PPU at Microsoft list prices (in Brazilian reais, with taxes, for organizations with BRL currency; in US dollars, converted at the day's exchange rate, for the others).
* **Minimum billing of 20 users** on the platform and in capacity sizing.
* **Reference capacity:** Fabric F2 for up to 50 users, doubling every time the number of users doubles, priced for the **East US** region with a **1-year reservation**, plus taxes. A capacity the organization already has (not on a free trial) and that is the required size brings this cost to zero.
* **An estimate, not a proposal.** The actual amount depends on your agreement with Microsoft and on the Power Embedded commercial proposal.

**How to close:** click **Close**, the **X** or outside the window.

### Indicator cards

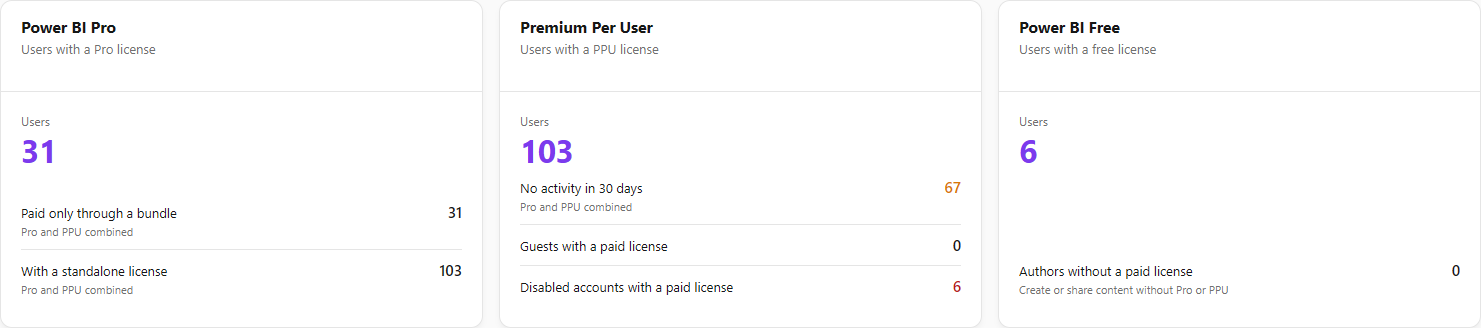
**What it is:** the three **Power BI Pro**, **Premium Per User** and **Power BI Free** cards, each with the number of **Users** at that level and detail lines.

**What it is for:** getting, in seconds, the size of the license estate and the first signs of waste.

<figure><picture><source srcset="/files/XFHBZ26HFBzdR1OdiDBJ" media="(prefers-color-scheme: dark)"><img src="https://3938213054-files.gitbook.io/~/files/v0/b/gitbook-x-prod.appspot.com/o/spaces%2FH2bFRBmIfyK3kwVKbldl%2Fuploads%2Fgit-blob-b23ad74c910572c3441bf14ecff08ff35086fe90%2Fpm-governanca-licencas-power-bi-kpis-en.png?alt=media" alt="Power BI Pro, Premium Per User and Power BI Free cards with the detail lines"></picture><figcaption><p>License indicators</p></figcaption></figure>

| Card                 | Main number                                           | Detail lines                                                                                                                                                                                      |
| -------------------- | ----------------------------------------------------- | ------------------------------------------------------------------------------------------------------------------------------------------------------------------------------------------------- |
| **Power BI Pro**     | Users with a Pro license                              | **Paid only through a bundle** and **With a standalone license** (both add up Pro and PPU)                                                                                                        |
| **Premium Per User** | Users with a PPU license                              | **No activity in 30 days** (Pro and PPU combined; in yellow when greater than zero), **Guests with a paid license** and **Disabled accounts with a paid license** (in red when greater than zero) |
| **Power BI Free**    | Users with a free license (*Microsoft Fabric (Free)*) | **Authors without a paid license**: people who create or share content without Pro or PPU                                                                                                         |

**How it works:**

* Each person is counted **once**, at the highest level they have: PPU > Pro > Free. People with PPU are not counted again under Pro.
* **Paid only through a bundle** are the Pro/PPU users who get Power BI only through a bundle (such as Microsoft 365 E5 or Office 365 E5); **With a standalone license** are those who have at least one Pro, PPU or PPU Add-On license purchased separately.
* The cards consider the whole collection and **do not change** with the user list filters.

### Seats by SKU

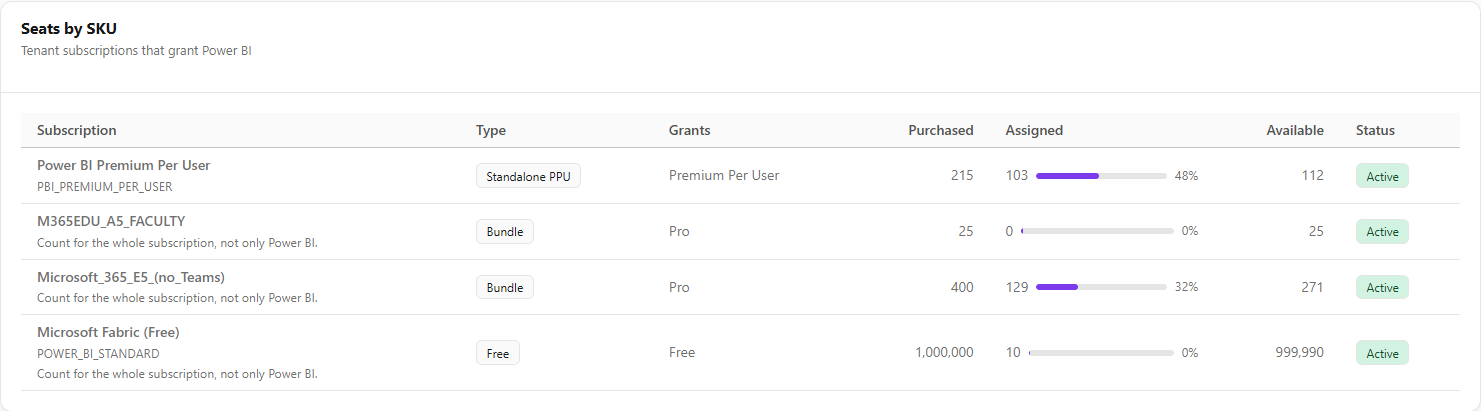
**What it is:** the **Seats by SKU** table (*Tenant subscriptions that grant Power BI*), with one row per Microsoft subscription in the tenant that includes Power BI.

**What it is for:** comparing how many seats were purchased with how many are assigned and finding subscriptions with spare seats or about to expire.

<figure><picture><source srcset="/files/thn0js30vAFYSsbmfCCK" media="(prefers-color-scheme: dark)"><img src="https://3938213054-files.gitbook.io/~/files/v0/b/gitbook-x-prod.appspot.com/o/spaces%2FH2bFRBmIfyK3kwVKbldl%2Fuploads%2Fgit-blob-c61cba14588c13d30ac76bae4084e1c3283ee87e%2Fpm-governanca-licencas-power-bi-assentos-en.png?alt=media" alt="Seats by SKU table with the Subscription, Type, Grants, Purchased, Assigned, Available and Status columns"></picture><figcaption><p>Seats by SKU</p></figcaption></figure>

| Column           | Content                                                                                                                                                  |
| ---------------- | -------------------------------------------------------------------------------------------------------------------------------------------------------- |
| **Subscription** | Commercial name of the subscription (for example, *Power BI Pro*, *Microsoft 365 E5*) and, below it, the technical SKU identifier                        |
| **Type**         | **Bundle**, **Standalone Pro**, **Standalone PPU**, **PPU Add-On** or **Free**                                                                           |
| **Grants**       | Power BI level the subscription provides: **Free**, **Pro** or **Premium Per User**                                                                      |
| **Purchased**    | Active seats purchased                                                                                                                                   |
| **Assigned**     | Assigned seats, with a bar and the percentage of purchased seats                                                                                         |
| **Available**    | Seats purchased and still free                                                                                                                           |
| **Status**       | **Active**, **In grace period**, **Suspended**, **Locked out** or **Deleted**, with the number of seats in grace period or suspended, when there are any |

**How to use:** look for **Standalone Pro**, **Standalone PPU** or **PPU Add-On** rows with many seats under **Available**: these are paid licenses with nobody assigned, which fall into the **Unassigned seats** opportunity. Rows **In grace period** indicate an expired or non-renewed subscription.

**How it works:** for **Bundle** and **Free** subscriptions, the counts are for the whole subscription, not only Power BI (the row warns *Count for the whole subscription, not only Power BI.*). Capacities (Fabric F, Embedded A and Premium P) do not appear here: they are capacity resources, not per-user licenses. With no subscription that includes Power BI, *No subscription with Power BI found in this collection.* is displayed.

### Savings opportunities

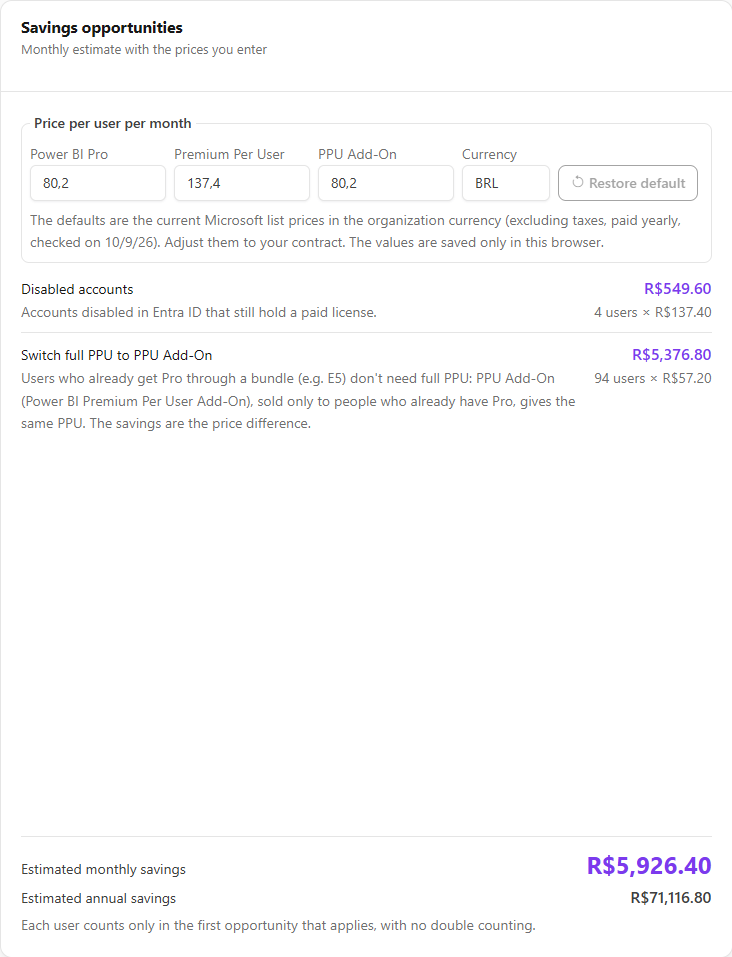
**What it is:** the **Savings opportunities** card (*Monthly estimate with the prices you enter*), with the price fields, one row per opportunity and the monthly and annual totals.

**What it is for:** turning the findings into money, with your contract prices.

<figure><picture><source srcset="/files/5DfXJClzabgXSXmiCCNW" media="(prefers-color-scheme: dark)"><img src="https://3938213054-files.gitbook.io/~/files/v0/b/gitbook-x-prod.appspot.com/o/spaces%2FH2bFRBmIfyK3kwVKbldl%2Fuploads%2Fgit-blob-9085729e9d6f63069cad1d5971981ff22c323f30%2Fpm-governanca-licencas-power-bi-oportunidades-en.png?alt=media" alt="Savings opportunities card with the price per user per month fields, the opportunities and the monthly and annual totals"></picture><figcaption><p>Savings opportunities</p></figcaption></figure>

**How to use:**

{% stepper %}
{% step %}

### Enter your contract prices

Under **Price per user per month**, adjust **Power BI Pro**, **Premium Per User** and **PPU Add-On** to your contract prices. The defaults are the **current Microsoft list prices in the organization's currency** (excluding taxes, paid yearly, with the date they were checked). When Microsoft does not publish a list price in the organization's currency, *Microsoft does not publish a list price in {currency}, so the defaults are in USD.* is shown.
{% endstep %}

{% step %}

### Read the opportunities

Each row shows the name of the opportunity, the monthly amount, the description and the math (*N users × price*).
{% endstep %}

{% step %}

### Check the totals

In the footer, **Estimated monthly savings** and **Estimated annual savings** (12 × the monthly amount).
{% endstep %}

{% step %}

### Go back to the defaults, if needed

Click **Restore default** to clear the prices saved in this browser and go back to the Microsoft list prices.
{% endstep %}
{% endstepper %}

| Opportunity                       | What it counts                                                                           | Savings per item                      |
| --------------------------------- | ---------------------------------------------------------------------------------------- | ------------------------------------- |
| **Unassigned seats**              | Standalone seats purchased and not assigned to anyone                                    | License price                         |
| **Disabled accounts**             | Accounts disabled in Entra ID that still hold a paid license                             | License price                         |
| **Redundant Pro**                 | Standalone Pro for users who already get Pro through a bundle, such as E5                | Pro price                             |
| **Inactive for 90 days**          | Paid license with no event in the activity log in 90 days                                | License price                         |
| **Pro to Free**                   | Standalone Pro used only to view content in capacities where Free users can already read | Pro price                             |
| **PPU to Pro**                    | PPU with no activity in PPU workspaces in 90 days                                        | Difference between PPU and Pro        |
| **Switch full PPU to PPU Add-On** | Users who already get Pro through a bundle and have full PPU                             | Difference between PPU and PPU Add-On |

**How it works:**

* **No double counting:** each user counts only in the **first** opportunity that applies, in this order: disabled account, inactive for 90 days, redundant Pro, Pro to Free, PPU to Pro, full PPU to PPU Add-On. The math considers only **standalone** licenses: licenses that come through a bundle are not freed.
* The same opportunity can appear in more than one row when it involves different license types (for example, disabled accounts with Pro and with PPU).
* The prices are saved **only in this browser**; they are not stored in Power Monitor or seen by other administrators. No amount is converted between currencies.
* **List prices:** Power Monitor ships the official Power BI Pro, Premium Per User and PPU Add-On list prices published by Microsoft in several currencies (for example, USD 14, 24 and 14; BRL 80.20, 137.40 and 80.20), checked on October 9, 2026.
* With no opportunity, *No savings opportunity found in this collection.* is displayed.

{% hint style="info" %}
This card uses **the prices you enter** and considers all license adjustment opportunities. The [Power Embedded](#estimated-savings-with-power-embedded) card is a different calculation: it uses list prices and considers only the viewers who would no longer need a license.
{% endhint %}

### License optimization (Administrator)

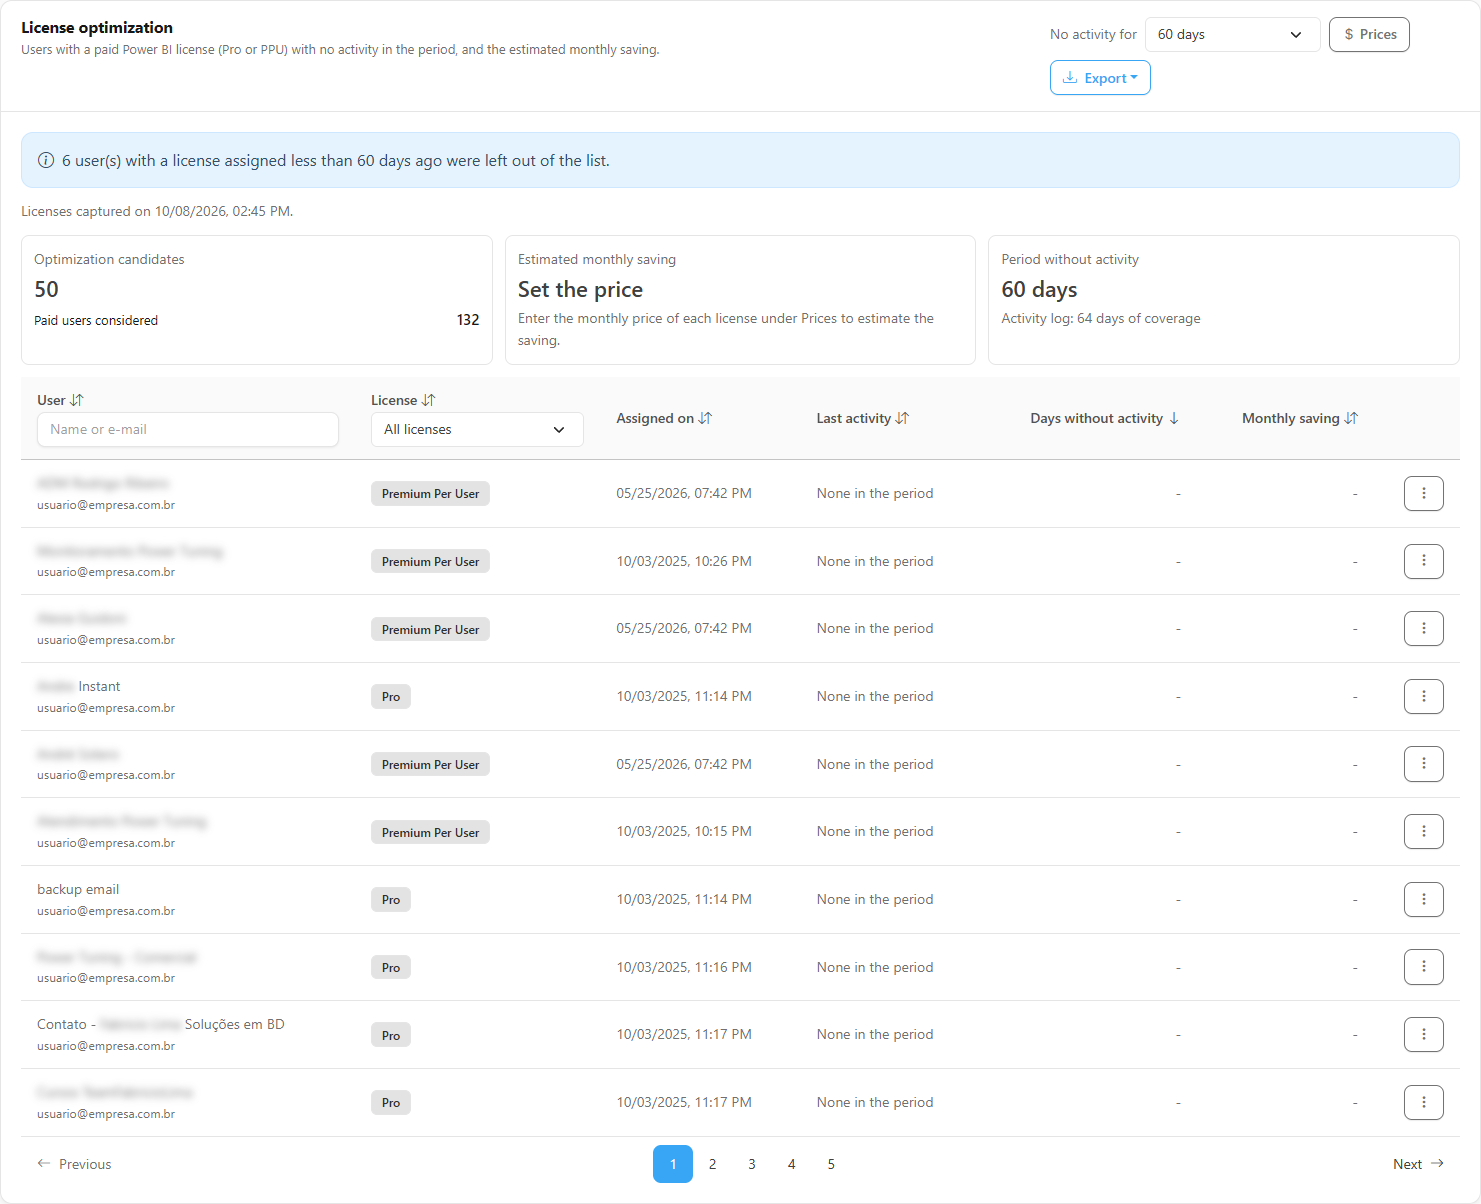
**What it is:** the **License optimization** section (*Users with a paid Power BI license (Pro or PPU) with no activity in the period, and the estimated monthly saving*), between the opportunities and the findings. It is **exclusive to Administrators**: other profiles see only the notice *Only administrators can see license optimization.*

**What it is for:** listing, person by person, who has a paid Pro or PPU and **used nothing in the period you choose**, and estimating the monthly saving with **your contract prices**, which are saved for the organization.

<figure><picture><source srcset="/files/9Q0SiZCCB6uVQpdUUnOf" media="(prefers-color-scheme: dark)"><img src="https://3938213054-files.gitbook.io/~/files/v0/b/gitbook-x-prod.appspot.com/o/spaces%2FH2bFRBmIfyK3kwVKbldl%2Fuploads%2Fgit-blob-d4ef3d42df669c7c2e5e3441d2eac25df7f6cab6%2Fpm-governanca-licencas-power-bi-otimizacao-en.png?alt=media" alt="License optimization section with the No activity for selector, the Optimization candidates, Estimated monthly saving and Period without activity indicators and the table of candidates"></picture><figcaption><p>License optimization</p></figcaption></figure>

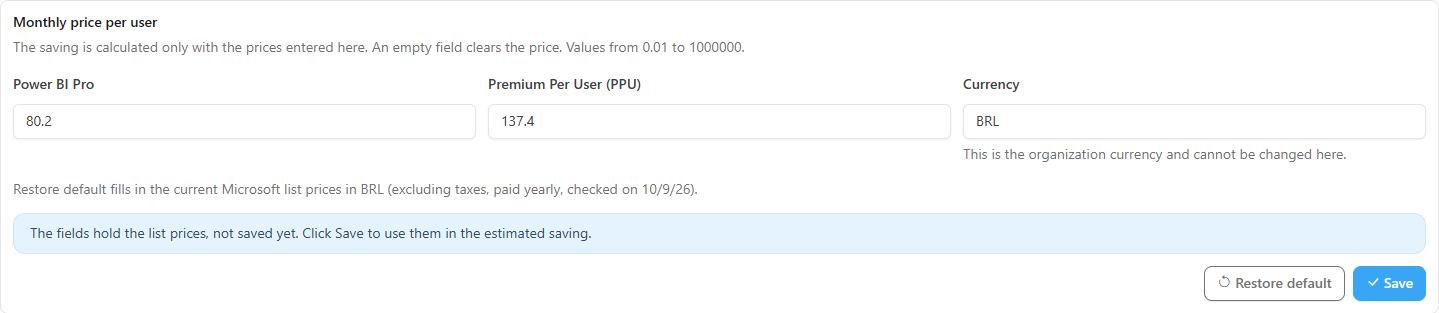
<figure><picture><source srcset="/files/161O6U1tZ8TIL8K4EpFP" media="(prefers-color-scheme: dark)"><img src="https://3938213054-files.gitbook.io/~/files/v0/b/gitbook-x-prod.appspot.com/o/spaces%2FH2bFRBmIfyK3kwVKbldl%2Fuploads%2Fgit-blob-0fd64f301a268c76f7b92c4b21adb73b537ef2cf%2Fpm-governanca-licencas-power-bi-otimizacao-precos-en.png?alt=media" alt="Monthly price per user form with the Power BI Pro, Premium per user (PPU) and Currency fields"></picture><figcaption><p>Contract prices in license optimization</p></figcaption></figure>

**How to use:**

{% stepper %}
{% step %}

### Choose the period

In **No activity for**, choose **30**, **45**, **60** (default), **90**, **120**, **180** or **365 days**. The longer the period, the more conservative the list.
{% endstep %}

{% step %}

### Enter the prices

Click **Prices** and fill in the **Monthly price per user** for **Power BI Pro** and **Premium Per User (PPU)** (values from 0.01 to 1,000,000, with up to two decimal places; an empty field clears the price). The **Currency** is the organization's and cannot be changed here. When no price has been saved yet, the fields already open with the current Microsoft list prices in the organization's currency, with the notice *The fields hold the list prices, not saved yet. Click Save to use them in the estimated saving.*; **Restore default** fills both fields with those prices again, which are only stored when you click **Save**. If Microsoft does not publish a list price in the organization's currency, nothing is filled in or converted and the hint asks for your contract prices. With no prices, the saving shows as **Set the price**; with only one of the prices, the estimate is partial (*Partial estimate: the price of one license type is missing*).
{% endstep %}

{% step %}

### Read the indicators

**Optimization candidates** (with **Paid users considered**), **Estimated monthly saving**, **Period without activity** and **Activity log: N days of coverage**. The line *Licenses captured on \[date]* shows the license snapshot used.
{% endstep %}

{% step %}

### Work the list

The table brings **User**, **License** (**Pro** or **Premium Per User**), **Assigned on**, **Last activity** (*None in the period* when there is none), **Days without activity** and **Monthly saving**, with the filters in the column headers of **User** (**Name or e-mail**) and **License** (**All licenses**). Blocked accounts get the **Account disabled** badge. The default order is by **Days without activity**, from highest to lowest, and all columns can be re-sorted. The table shows 10 rows per page, with the **Items per page** selector. The **More actions** menu (also opened with right-click on the row) offers **Copy user**, and **Export** generates CSV or JSON (name and UPN respect the **Hide data** button, also in the file and in what is copied).
{% endstep %}
{% endstepper %}

**How it works:**

* **"Inactive" requires proof.** If there is not enough proof of inactivity, the section **lists nobody as inactive** and shows the reason in a notice:

| Notice                                                                                       | When it appears                                                            |
| -------------------------------------------------------------------------------------------- | -------------------------------------------------------------------------- |
| *The evaluation has not been done yet: the first license or activity collection is missing.* | There is no completed collection yet                                       |
| *Your profile sees only some of the workspaces, so the activity seen here is partial.*       | The reader has a restricted workspace scope                                |
| *No activity log has been collected.*                                                        | The activity event collection has never run                                |
| *The activity log has stopped (last event on \[date]).*                                      | Log ingestion has stopped                                                  |
| *The activity log covers N days, less than the M days chosen.*                               | The history does not cover the period yet. Choose a shorter period or wait |

* **A bundle license does not reduce the bill.** When the license comes from a bundle (for example, Microsoft 365 E5), the row warns that releasing it does not reduce the bill and it is not counted in the estimated saving.
* Users with a license assigned more recently than the chosen period are left out and the section reports how many.
* **Difference from the Savings opportunities card:** here you choose the period (from 30 to 365 days) and the prices are stored for the organization; on the **Savings opportunities** card, the periods are fixed (30 and 90 days) and the prices stay only in the browser.

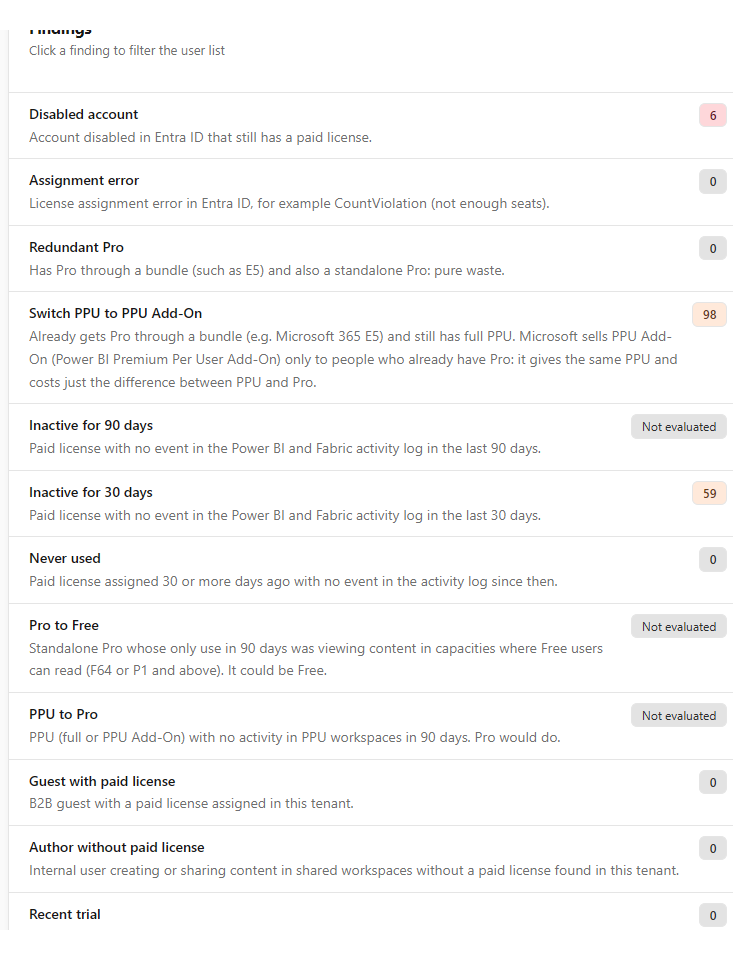
### Findings

**What it is:** the **Findings** card (*Click a finding to filter the user list*), with one item per finding type, the short description and the number of users.

**What it is for:** seeing at a glance which problems exist and going straight to the people affected.

<figure><picture><source srcset="/files/Yc4DDHLcbvyz4CMxl28Y" media="(prefers-color-scheme: dark)"><img src="https://3938213054-files.gitbook.io/~/files/v0/b/gitbook-x-prod.appspot.com/o/spaces%2FH2bFRBmIfyK3kwVKbldl%2Fuploads%2Fgit-blob-7a2d95d705991defa04d104d632f951b5ebd701c%2Fpm-governanca-licencas-power-bi-achados-en.png?alt=media" alt="Findings card with the list of findings and the number of users"></picture><figcaption><p>Findings</p></figcaption></figure>

**How to use:**

1. Click a finding with a count greater than zero. The [Users](#user-list) list is filtered by it and the page scrolls down to it; the active finding gets a funnel icon.
2. Click the same finding again to remove the filter.

| Finding                         | When it appears                                                                                                                                                                                         |
| ------------------------------- | ------------------------------------------------------------------------------------------------------------------------------------------------------------------------------------------------------- |
| **Disabled account**            | Account blocked in Entra ID (usually someone who left the company) that still has a paid license                                                                                                        |
| **Assignment error**            | Entra ID could not assign the license, for example because of **CountViolation** (not enough seats) or a conflict between plans                                                                         |
| **Redundant Pro**               | Gets Pro through a bundle (such as Microsoft 365 E5) **and** has a standalone Pro                                                                                                                       |
| **Switch PPU to PPU Add-On**    | Gets Pro through a bundle and still has full PPU; PPU Add-On would provide the same PPU for the price difference                                                                                        |
| **Inactive for 90 days**        | Paid license with **no event** in the Power BI and Fabric activity log in the last 90 days                                                                                                              |
| **Inactive for 30 days**        | Paid license with no event in the last 30 days                                                                                                                                                          |
| **Never used**                  | Paid license assigned between 30 and 90 days ago with no event since the assignment                                                                                                                     |
| **Pro to Free**                 | Standalone Pro whose only use in 90 days was **viewing** reports and dashboards in workspaces on **F64 or P1 and above** capacities, where Free users can read, without creating or publishing anything |
| **PPU to Pro**                  | PPU (full or PPU Add-On) with no activity in PPU workspaces in 90 days                                                                                                                                  |
| **Guest with paid license**     | B2B guest (from another company) with a paid license assigned in this tenant                                                                                                                            |
| **Author without paid license** | Internal user who created, published or shared Power BI content in a shared workspace in the last 90 days without a paid license in this tenant                                                         |
| **Recent trial**                | Started a free Pro or PPU trial in the last 90 days                                                                                                                                                     |

**How it works:**

* The colors indicate severity: **red** for disabled account and assignment error, **yellow** for inactivity, downgrade and redundancy, **blue** for guest, author without license and trial.
* Findings with zero users are shown in gray and are not clickable.
* Findings that depend on the log window (inactivity, never used and downgrades) appear as **Not evaluated** when the log does not cover the required window; hover over them to see the reason. They are never shown as zero in this case.

### Distributions

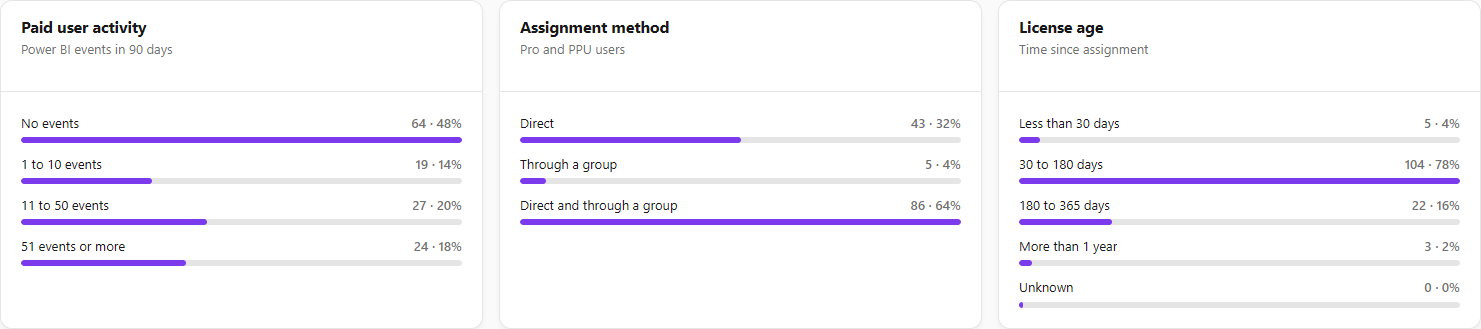
**What it is:** three cards with proportional bars about paid users (Pro and PPU): **Paid user activity** (events in 90 days: **No events**, **1 to 10 events**, **11 to 50 events**, **51 events or more**), **Assignment method** (**Direct**, **Through a group**, **Direct and through a group**) and **License age** (**Less than 30 days**, **30 to 180 days**, **180 to 365 days**, **More than 1 year**, **Unknown**).

**What it is for:** understanding the profile of the paid estate: how much of it is idle, whether licenses are managed through groups and how long ago they were assigned.

<figure><picture><source srcset="/files/S12fBXFEoMp7vMbWZ5ci" media="(prefers-color-scheme: dark)"><img src="https://3938213054-files.gitbook.io/~/files/v0/b/gitbook-x-prod.appspot.com/o/spaces%2FH2bFRBmIfyK3kwVKbldl%2Fuploads%2Fgit-blob-69dddb1446993d8f702f15d9052382a520c98683%2Fpm-governanca-licencas-power-bi-distribuicoes-en.png?alt=media" alt="Paid user activity, Assignment method and License age cards with proportional bars"></picture><figcaption><p>Paid user distributions</p></figcaption></figure>

**How it works:** each bar shows the count and the percentage of the total paid users. With no paid users, *No paid users in this collection.* is displayed.

### Departments

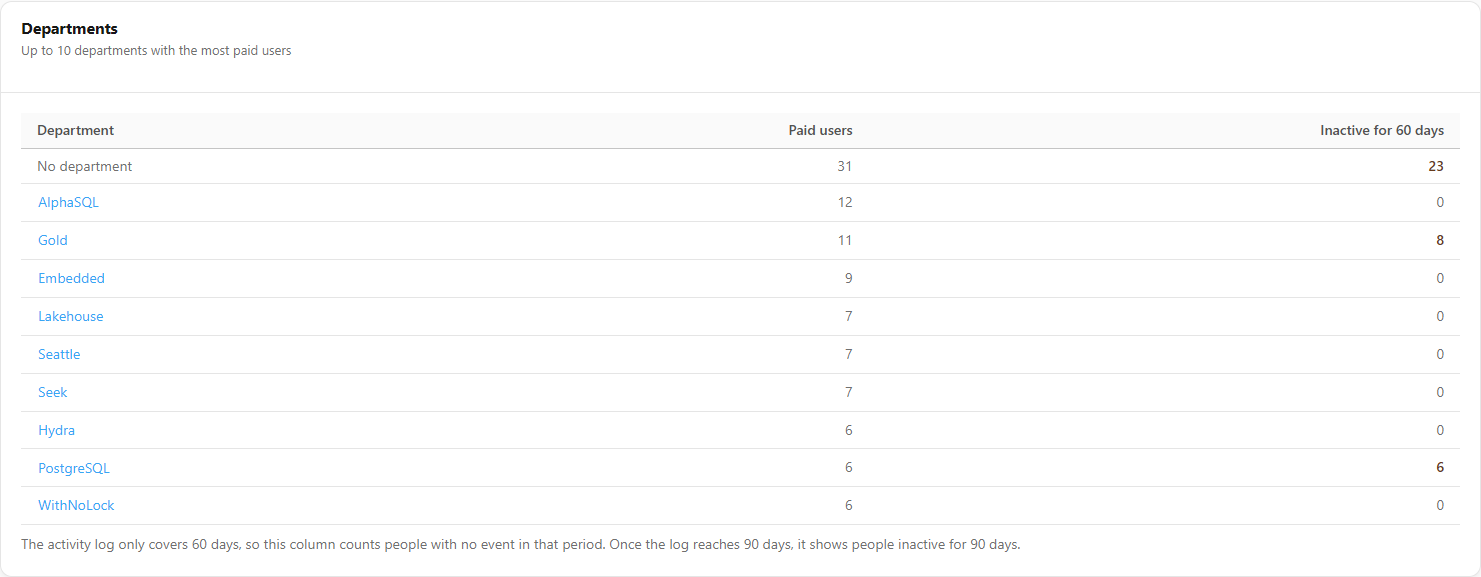
**What it is:** the **Departments** table (*Up to 10 departments with the most paid users*), with the **Department**, **Paid users** and **Inactive for N days** columns, where N is the window actually evaluated (90 when the log already covers 90 days).

**What it is for:** knowing which areas hold the paid licenses and where there are more idle licenses, so you can talk to the right manager.

<figure><picture><source srcset="/files/AkV5EVjyqR8vqydaeIme" media="(prefers-color-scheme: dark)"><img src="https://3938213054-files.gitbook.io/~/files/v0/b/gitbook-x-prod.appspot.com/o/spaces%2FH2bFRBmIfyK3kwVKbldl%2Fuploads%2Fgit-blob-e42b741dd64c4ac26bcb3683a5f668cb936006d7%2Fpm-governanca-licencas-power-bi-departamentos-en.png?alt=media" alt="Departments table with the Department, Paid users and Inactive for 90 days columns"></picture><figcaption><p>Departments</p></figcaption></figure>

**How to use:** click a department name to filter the user list by it.

**How it works:** the department is the one filled in on each person's Entra ID profile. Users without a department are grouped under **No department** (this row does not filter the list). When the log covers less than 90 days but at least 7, the column counts people with no event in the available window (the title shows the number of days, for example **Inactive for 30 days**) and a note explains that, once the log reaches 90 days, it will show people inactive for 90 days. It only shows **Not evaluated** with less than 7 days of log or when the log has stopped.

### Trend

**What it is:** the **Trend** chart (*Daily series of collections, up to 180 days*), with two views: **Users** (Pro, PPU and Free lines) and **Standalone seats** (standalone Pro purchased and assigned, PPU purchased and assigned, with the "purchased" lines dashed).

**What it is for:** tracking the effect of cleanup actions (for example, the drop in assigned seats after releasing inactive users) and the growth of the estate.

**How to use:** switch between **Users** and **Standalone seats** in the corner of the card and hover over the chart to see each day's values.

**How it works:** each completed collection records one point per day. The card only appears from the **second** daily collection onward.

### User list

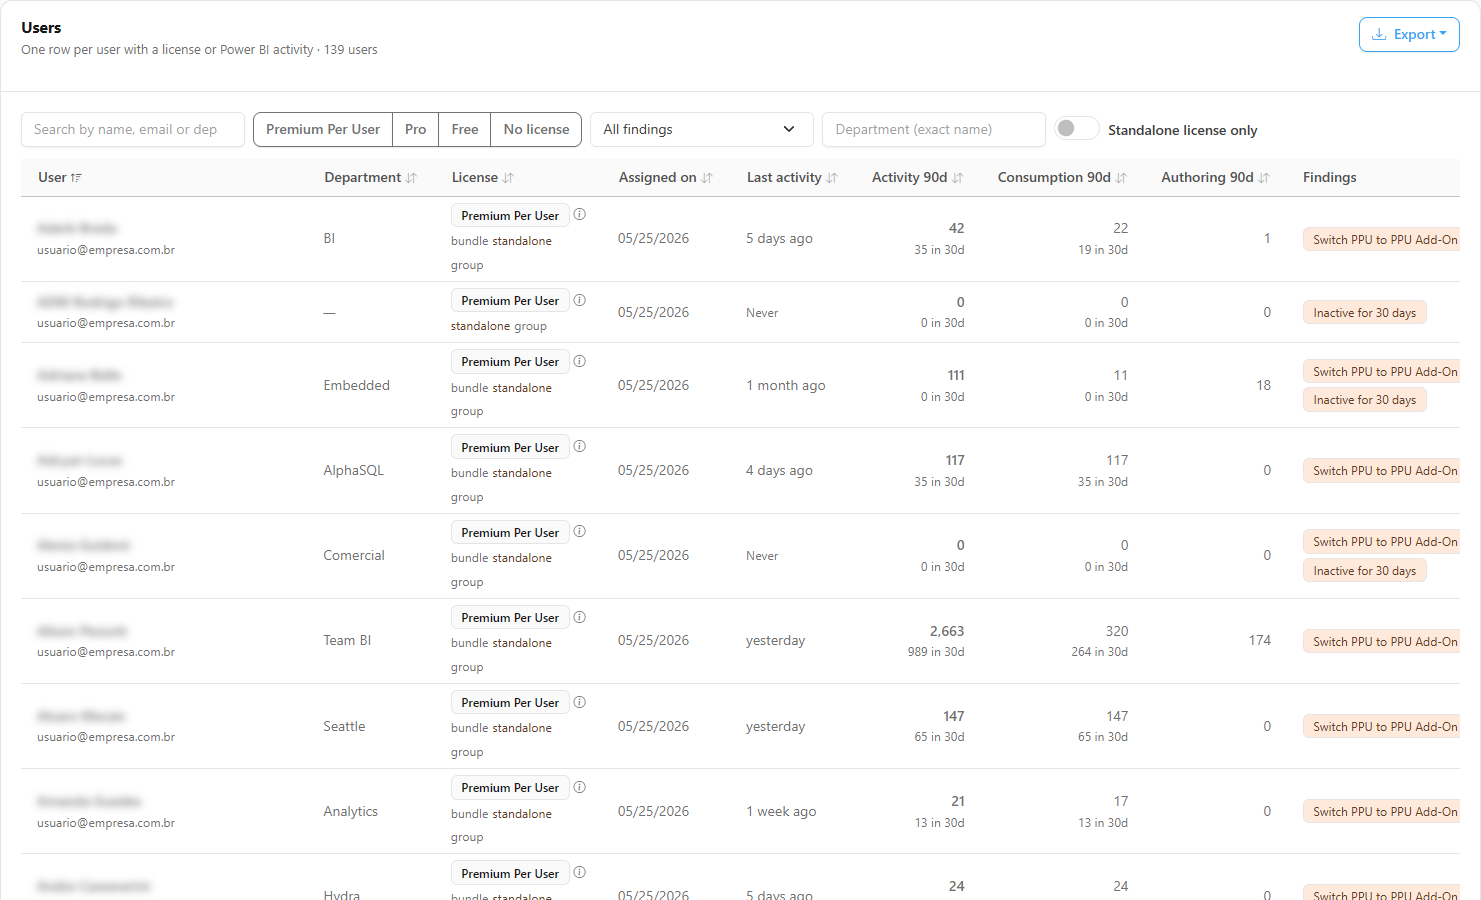
**What it is:** the **Users** table (*One row per user with a license or Power BI activity*), with the total number of users found, filters, sorting, pagination and export.

**What it is for:** seeing, person by person, which license they have, where it comes from, when it was assigned, how much they used it and which findings apply.

<figure><picture><source srcset="/files/GxVbdPt6UZurrvPaiqX4" media="(prefers-color-scheme: dark)"><img src="https://3938213054-files.gitbook.io/~/files/v0/b/gitbook-x-prod.appspot.com/o/spaces%2FH2bFRBmIfyK3kwVKbldl%2Fuploads%2Fgit-blob-5ce060a91d7d287e79057bed81b3edeae3681b42%2Fpm-governanca-licencas-power-bi-usuarios-en.png?alt=media" alt="User list with the User, Department, License, Assigned on, Last activity, Activity 90d, Consumption 90d, Authoring 90d and Findings columns"></picture><figcaption><p>User list</p></figcaption></figure>

| Column              | Content                                                                                                                                                                                                                                                                      |
| ------------------- | ---------------------------------------------------------------------------------------------------------------------------------------------------------------------------------------------------------------------------------------------------------------------------- |
| **User**            | Name and UPN, with the **Disabled** (account blocked in Entra ID) and **Guest** (B2B user) badges                                                                                                                                                                            |
| **Department**      | Department in Entra ID                                                                                                                                                                                                                                                       |
| **License**         | Level (**Premium Per User**, **Pro**, **Free** or **No license**) and the source: **bundle**, **standalone**, **group**. The **(i)** icon shows the license sources (subscription, *through a group*, state) and, if there is one, the assignment error appears in red below |
| **Assigned on**     | Assignment date of the active plan for that level                                                                                                                                                                                                                            |
| **Last activity**   | Relative date of the last event in the log (hover over it to see the date and time); **Never** when there is no event                                                                                                                                                        |
| **Activity 90d**    | **All** of the person's events in the log in 90 days (reports, notebooks, pipelines, subscriptions and other Power BI and Fabric operations) and, below, the total in 30 days. Inactivity is calculated on this total                                                        |
| **Consumption 90d** | Consumption events (viewing reports, dashboards and tiles, exporting, printing, Analyze in Excel, XMLA queries, etc.) in 90 days and, below, in 30 days                                                                                                                      |
| **Authoring 90d**   | Content creation and editing events in 90 days                                                                                                                                                                                                                               |
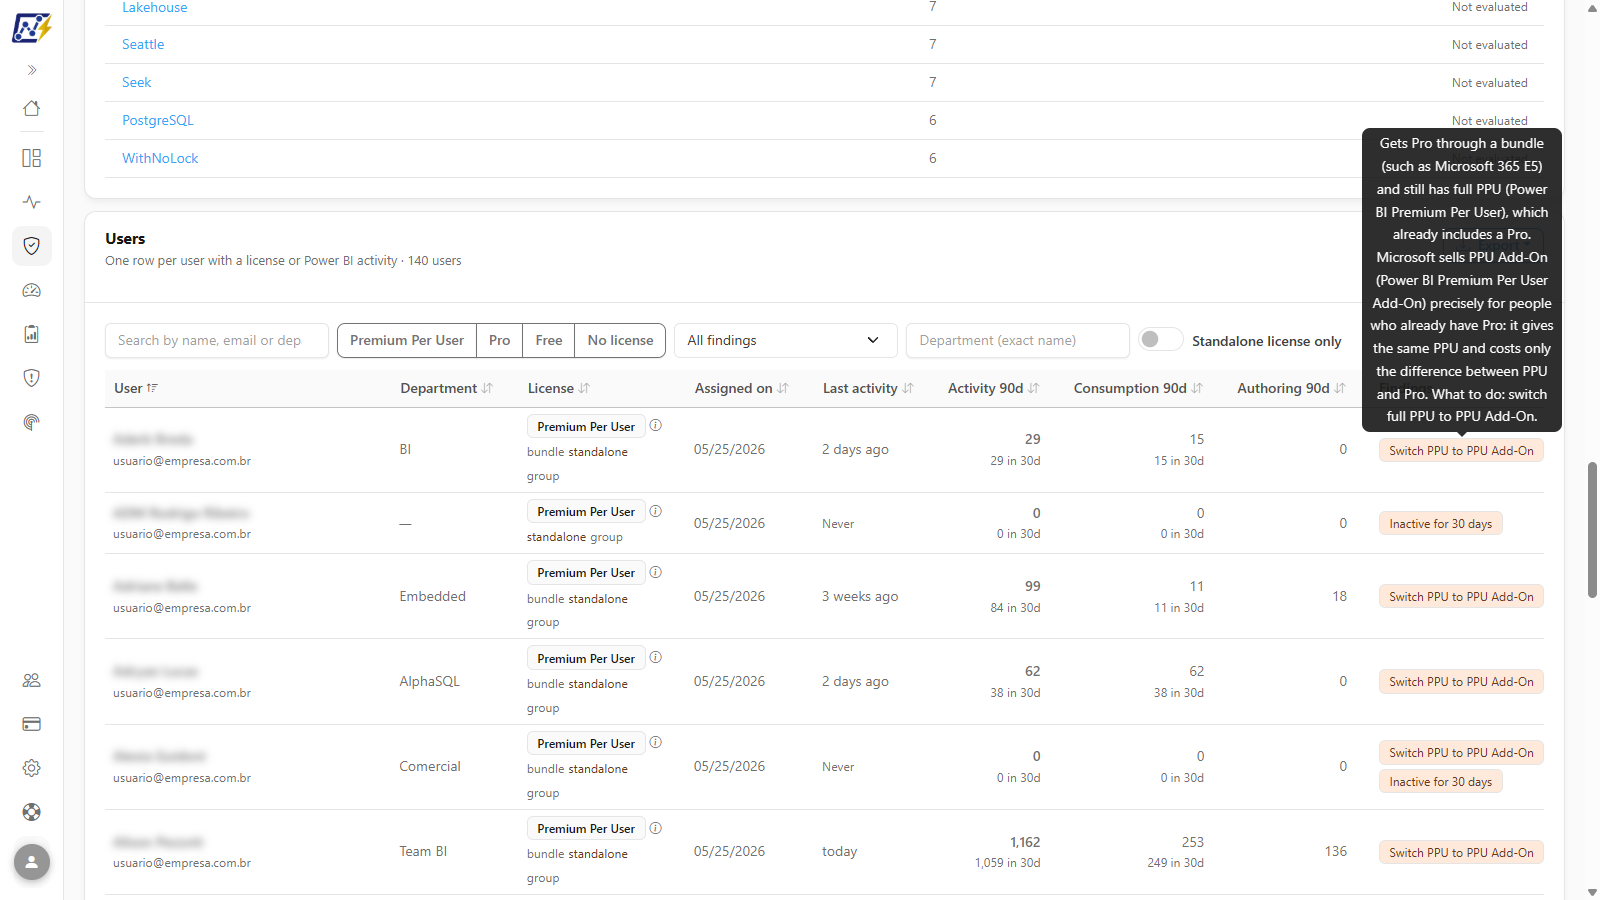
| **Findings**        | Badges with the person's [findings](#findings); hover over each badge to read what it means, how it was detected and what to do                                                                                                                                              |

<figure><picture><source srcset="/files/xeAutmJKlAWdBAadBf7r" media="(prefers-color-scheme: dark)"><img src="https://3938213054-files.gitbook.io/~/files/v0/b/gitbook-x-prod.appspot.com/o/spaces%2FH2bFRBmIfyK3kwVKbldl%2Fuploads%2Fgit-blob-92dd2a90f791bdef9dc7ffdeef598f5d84da866b%2Fpm-governanca-licencas-power-bi-achado-dica-en.png?alt=media" alt="Tooltip over a finding badge in the user list with the full explanation and what to do"></picture><figcaption><p>Explanation of a finding in the list</p></figcaption></figure>

**How to use:**

1. Click a column header to sort. Name and department start in alphabetical order; the others, from highest to lowest. Click again to reverse.
2. Use the pagination in the footer (25 users per page by default). The **Items per page** selector (10, 25, 50 or 100) appears whenever there are users and, when changed, goes back to the first page keeping the filters.

**How it works:**

* Filters, sorting and pagination are applied to the whole collection, not only to the visible page.
* The list includes people **without a license** who had activity in Power BI (for example, authors without a paid license).
* **Assigned on** is the date of the active plan recorded by Microsoft, not necessarily the purchase date: when Microsoft reprovisions a service, it may restamp the date for every user in the tenant.
* If the list does not load, *Could not load the user list.* is displayed with the **Try again** button. With no results, *No users in this collection.* is displayed or, with filters, *No users match the filters.*
* The **⋮** button on each row (**More actions**), also opened by right-clicking, offers **View user details** (see below) and **Copy user**.

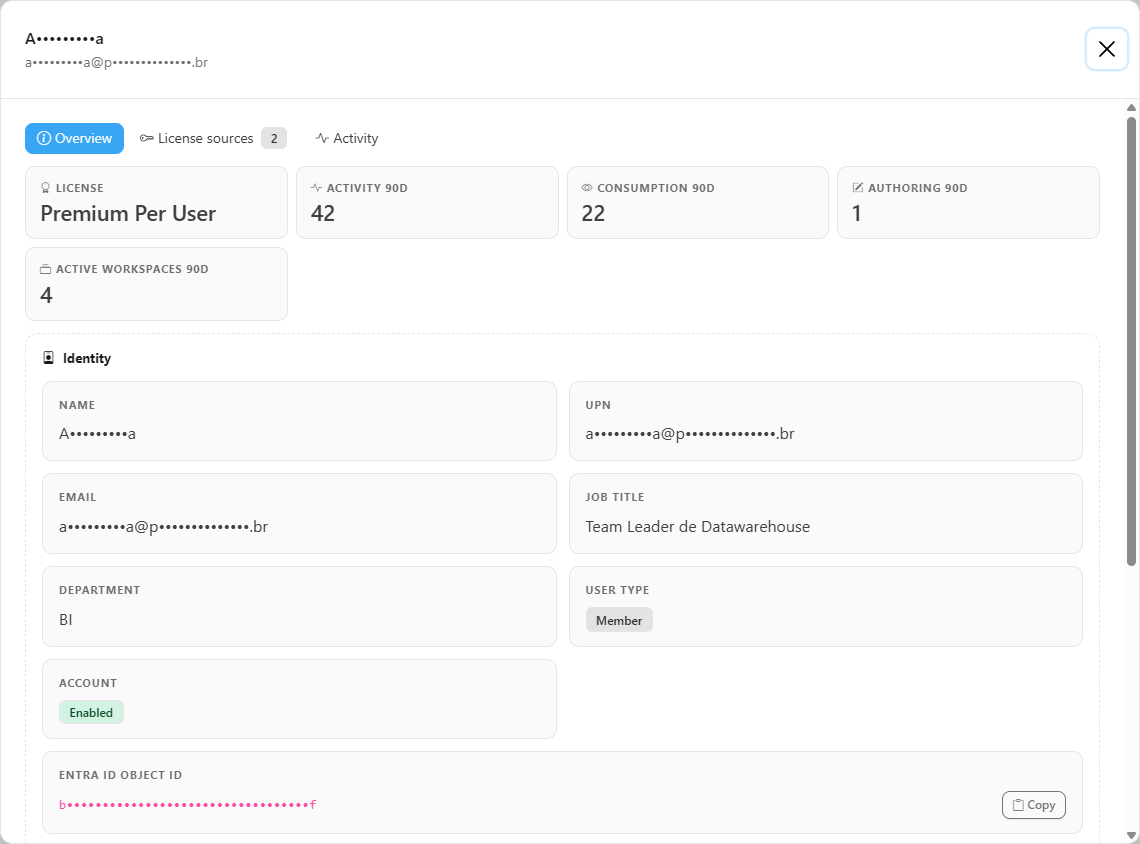
### User details

**What it is:** the modal of a user in the list, opened by **⋮ › View user details**, with the **Overview**, **License sources** and **Activity** tabs.

**What it is for:** gathering, for one person, what the table row does not show: full identity, how the license was assigned, each license source and the 30 and 90 day activity broken down by type, before deciding to remove or change a license.

<figure><picture><source srcset="/files/fOf4MXMPtuBtZNyRBDx6" media="(prefers-color-scheme: dark)"><img src="https://3938213054-files.gitbook.io/~/files/v0/b/gitbook-x-prod.appspot.com/o/spaces%2FH2bFRBmIfyK3kwVKbldl%2Fuploads%2Fgit-blob-fbab80ca00285e2892dc559a525a37b63c21d8e0%2Fpm-governanca-licencas-power-bi-modal-usuario-en.png?alt=media" alt="Details modal of a user with the License and Active workspaces 90d indicators and the Identity, License and Findings sections"></picture><figcaption><p>Details of a user</p></figcaption></figure>

**How to use:**

1. Click the row's **⋮** button (or right-click the row) and choose **View user details**.
2. Read the **Overview** tab and switch tabs using the bar at the top of the modal.

**How it works:**

| Tab                 | What it shows                                                                                                                                                                                                                                                                                                                                                                                                  |
| ------------------- | -------------------------------------------------------------------------------------------------------------------------------------------------------------------------------------------------------------------------------------------------------------------------------------------------------------------------------------------------------------------------------------------------------------- |
| **Overview**        | **License** and **Active workspaces 90d** indicators and the **Identity** (Name, UPN, Email, Job title, User type, Account enabled or disabled and Entra ID Object Id), **License** (Direct or group assignment, whether the user has a paid standalone license, last trial opt-in) and **Findings** sections. It follows the [common structure](/en/power-monitor/governanca/relatorios.md#the-overview-tab). |
| **License sources** | One row per source, with **SKU**, **Type**, **Granted tier**, **Origin** (*Direct* or *Via group*) and **State**.                                                                                                                                                                                                                                                                                              |
| **Activity**        | **All events**, **Consumption (viewing)** and **Authoring (create, edit, publish)** over **30 days** and **90 days**, the date of the last event and the workspaces active in 90 days.                                                                                                                                                                                                                         |

Everything comes from the collection already loaded on the screen, without a new query. With **Hide data** on, name, UPN, e-mail and Object Id appear masked.

### List filters

**What it is:** the filter bar above the list: search, license level buttons, finding selection, department, the **Standalone license only** switch and **Clear filters**.

**What it is for:** building action lists, for example "all standalone Pro users inactive for 90 days in the Finance department".

<figure><picture><source srcset="/files/QyAQxaVPv4yelnVhBBNk" media="(prefers-color-scheme: dark)"><img src="https://3938213054-files.gitbook.io/~/files/v0/b/gitbook-x-prod.appspot.com/o/spaces%2FH2bFRBmIfyK3kwVKbldl%2Fuploads%2Fgit-blob-9ca9fdc447f000c68a8727559d2d15212cbf69d4%2Fpm-governanca-licencas-power-bi-filtros-en.png?alt=media" alt="User list filter bar with search, license levels, finding, department and Standalone license only"></picture><figcaption><p>User list filters</p></figcaption></figure>

| Filter                                                  | How it works                                                                                                                                                 |
| ------------------------------------------------------- | ------------------------------------------------------------------------------------------------------------------------------------------------------------ |
| **Search by name, email or department...**              | Searches for part of the text, applied as you type                                                                                                           |
| **Premium Per User**, **Pro**, **Free**, **No license** | Buttons that can be combined (for example, Pro and PPU together). None selected = all levels                                                                 |
| **All findings**                                        | Shows only people with the chosen finding. It is the same filter applied when you click the [Findings](#findings) card                                       |
| **Department (exact name)**                             | Exact department name; the box suggests the departments from the [Departments](#departments) card. It is the same filter applied when you click a department |
| **Standalone license only**                             | Shows only people with a paid license purchased separately (Pro, PPU or PPU Add-On)                                                                          |
| **Clear filters**                                       | Appears when any filter is active and returns the list to its initial state                                                                                  |

**How it works:** the filters are combined. They also define what is exported.

### Export

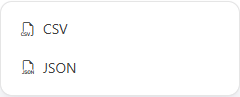
**What it is:** the **Export** button in the corner of the **Users** card, with the **CSV** and **JSON** options, and the **Export PDF** and **Export PNG** buttons in the page header.

**What it is for:** taking the list of people to a review spreadsheet with the managers, or recording the state of the screen in a report.

<figure><picture><source srcset="/files/AJHSqnL7q6LLHvMoQvTl" media="(prefers-color-scheme: dark)"><img src="https://3938213054-files.gitbook.io/~/files/v0/b/gitbook-x-prod.appspot.com/o/spaces%2FH2bFRBmIfyK3kwVKbldl%2Fuploads%2Fgit-blob-81ac9c41373a97bd9715e4b4ed543d2ba2ea6770%2Fpm-governanca-licencas-power-bi-exportar-en.png?alt=media" alt="Export menu open with the CSV and JSON options on the Users card"></picture><figcaption><p>User list export</p></figcaption></figure>

**How to use:**

1. Apply the filters you want to the list.
2. Click **Export** and choose **CSV** or **JSON**. The file is downloaded with the name `licencas-power-bi`.
3. For an image or PDF of the whole screen (cards, tables and charts), use **Export PDF** or **Export PNG** at the top of the page.

**How it works:**

* The file contains **all** users that match the filters, not only the visible page.
* With **Hide data** on, **Name**, **UPN** and **Email** are masked in the CSV and the JSON, and also in the table.
* The CSV has the **Name**, **UPN**, **Email**, **Department**, **Job title**, **Account enabled**, **User type**, **License**, **Assigned on**, **Standalone license**, **Assigned through a group**, **Assigned directly**, **License sources**, **Total activity 30d**, **Total activity 90d**, **Consumption 30d**, **Consumption 90d**, **Authoring 90d**, **Active workspaces 90d**, **Last activity**, **Last trial started** and **Findings** columns.
* The **Export** button is disabled while the list is loading or when it is empty. If the export fails, *Could not export the user list. Try again in a few moments.* is displayed.

{% hint style="warning" %}
The exported file contains employees' personal data. Store it in a location with restricted access and avoid attaching it to open channels or sending it outside the company.
{% endhint %}

### Collection

**What it is:** the **Collection** line, right below the title (*last run on \[date]*, *running since \[date]*, *last run on \[date], failed* or *no run recorded*), with the **View/manage collection →** link.

**What it is for:** knowing at a glance whether the daily license collection is running and going straight to the collection management page.

**How to use:** click **View/manage collection →** to open *Mapping › Power BI Licenses*. There, an Administrator can click **Run now** (there is no confirmation; the message *Run queued. The history updates when it starts.* confirms the request), follow the **Run in progress** badge, **Pause** and **Resume**, and read the run history (**Trigger**, **Started**, **Finished**, **Duration**, **Status**, **Items processed**, **Failures** and **Error**). When the run shows as **Completed**, reload this page to see the updated numbers.

**How it works:** the collection remains daily and automatic. The manual run buttons are only on the Mapping page, not on this screen.

### Empty state and error state

**What it is:** what the screen shows when there is no data yet or when it cannot load it.

| Situation                                         | What appears                                                                                                                                                                                                                         | What to do                                                                                                                                                               |
| ------------------------------------------------- | ------------------------------------------------------------------------------------------------------------------------------------------------------------------------------------------------------------------------------------ | ------------------------------------------------------------------------------------------------------------------------------------------------------------------------ |
| No collection completed                           | The **No collection has finished yet** card, explaining that the daily collection reads licenses from Microsoft Graph and cross-references each user with the activity log. The **Collection** line shows the status of the last run | Wait for the next daily collection or, as an Administrator, click **Run now** in *Mapping › Power BI Licenses*                                                           |
| Last collection denied due to missing permissions | The same card, with the notice that the collection was denied by Microsoft Graph and the **Go to Additional Permissions** button                                                                                                     | Grant the permission in [Additional Permissions › Power BI licenses](/en/power-monitor/configuracoes/permissoes-adicionais.md#power-bi-licenses) and trigger **Run now** |
| Collection failed for another reason              | The **No collection has finished yet** card, without a permission request                                                                                                                                                            | See the message in the **Error** column of the run history in *Mapping › Power BI Licenses*                                                                              |
| Failure loading the screen                        | *Could not load the audit* with the **Try again** button                                                                                                                                                                             | Try again in a few moments                                                                                                                                               |
| Service Principal not configured                  | *Finish the installation to use this audit*, with the **Go to Settings** button                                                                                                                                                      | Complete the configuration in [Organization](/en/power-monitor/configuracoes/organizacao.md)                                                                             |

{% hint style="info" %}
The screen only asks for permission when the last collection was **actually refused** by Microsoft Graph. A Service Principal that already has `Directory.Read.All` (such as the one created by the automatic installation) does not need any extra grant.
{% endhint %}

## Rules and behavior

* **Where the licenses come from:** Microsoft Graph, read by the organization's Service Principal: the tenant subscriptions that include Power BI and the users with those subscriptions assigned. Power Monitor **only reads**; it never assigns or removes licenses.
* **Each person's level:** comes from the user's active service plans, not from the subscription name. That is why someone who gets Power BI Pro within Microsoft 365 E5 (or another bundle) is counted as Pro. The order is PPU > Pro > Free.
* **Only effective assignments count:** an assignment with an error (for example, **CountViolation** on a group) is not considered a delivered license. This avoids recommending the removal of the only license that actually works.
* **Where the activity comes from:** from the Power BI and Fabric activity log already collected by Power Monitor (see [Mapping › Audit](/en/power-monitor/mapeamento/auditorias.md) and [Events Overview](/en/power-monitor/auditoria/geral-de-eventos.md)), in a 90-day window with a 30-day sub-window. Guests are also matched in the log by their home email.
* **Active × inactive user:** a person is considered **inactive** in a window (30 or 90 days) when they have a paid license, the account is active in Entra ID, the license was assigned before the start of the window and **there is no event from them in the log**, of any type. Any event counts as activity: opening a report, refreshing a model, running a notebook or pipeline, receiving a subscription, etc. So people who only use notebooks or pipelines are **active**.
* **Log coverage:** a window's findings are only evaluated when the log covers the whole window (30 days for 30-day inactivity and "never used"; 90 days for 90-day inactivity and downgrades). At the beginning, the first log ingestion retrieves about 27 days, and coverage grows by one day per day. When the last event in the log is more than 3 days old, coverage is treated as zero.
* **Downgrade to Free:** only suggested when **all** consumption in 90 days was plain reading in **F64 or P1 and above** capacities and the person created or published nothing. Usage in a workspace outside the Power Monitor inventory counts as possible creation and blocks the suggestion.
* **Frequency:** daily by default, at **09:45** (Brasília time, UTC-3), after the morning activity log ingestion, for organizations with a Service Principal configured. In [Settings › Monitoring](/en/power-monitor/configuracoes/monitoramento.md) › **Scans and Collections**, **Others** group, **Power BI licenses** item, the collection can be turned off and the frequency can be changed to **Weekly** or **Monthly** (see [Run frequency](/en/power-monitor/configuracoes/monitoramento.md#run-frequency)); in that case the screen shows the last collection until the next run. **Run now** works even with the switch turned off.
* **Required permission:** `LicenseAssignment.Read.All` and `User.Read.All` as Microsoft Graph application permissions, **or** `Directory.Read.All`, which covers both. Grant them in [Settings › Additional Permissions › Power BI licenses](/en/power-monitor/configuracoes/permissoes-adicionais.md#power-bi-licenses).
* **Snapshot replaced on each collection:** each completed collection fully replaces the previous one and records a daily point for the [Trend](#trend) chart. If a collection fails, the screen keeps showing the last successful collection.
* **Access:** **Administrators** only. The page also appears in [Users › Page access](/en/power-monitor/usuarios.md#page-access), but that does not grant access to people with the **User** role.

## How to use: common tasks

### How to clean up idle licenses

{% stepper %}
{% step %}

### Check the log coverage

Open *Governance › Tenant › Power BI Licenses* and check whether there are coverage or outdated log notices. With the outdated log notice, fix the ingestion before deciding on any removal.
{% endstep %}

{% step %}

### Filter the candidates

On the **Findings** card, click **Disabled account** and then **Inactive for 90 days**. Turn on **Standalone license only** to see only the licenses that can actually be released.
{% endstep %}

{% step %}

### Export and validate with the managers

Click **Export** › **CSV** and review the list with the managers of each department.
{% endstep %}

{% step %}

### Remove the licenses and check

Remove the licenses in the Microsoft 365 admin center (or from the groups that assign them). Then an Administrator clicks **Run now** in *Mapping › Power BI Licenses* and, once the run is **Completed**, reloads the screen.
{% endstep %}
{% endstepper %}

### How to estimate the savings with your contract prices

1. On the **Savings opportunities** card, enter the monthly price per user for **Power BI Pro**, **Premium Per User** and **PPU Add-On** and the **Currency**.
2. Read the **Estimated monthly savings** and the **Estimated annual savings**.
3. To find out who is behind each row, click the corresponding finding on the **Findings** card and export the list.

### How to assess whether Power Embedded pays off

1. If the **Power Embedded** card is visible, click **How we calculated it**.
2. Check under **Who moves** how many viewers are included in the calculation and how many authors are left out.
3. Under **Capacity**, see whether the calculation uses a capacity the organization already has (zero cost) or a new one.
4. Click **Redo the math in the calculator** to simulate other scenarios, or **Learn about Power Embedded** to talk to the product team.

## Frequently asked questions

<details>

<summary>The screen does not appear in my menu.</summary>

It is exclusive to Administrators, because it contains personal data and each person's usage. Ask an Administrator of your organization.

</details>

<details>

<summary>"No collection has finished yet" is displayed.</summary>

The first collection has not finished yet. Check the **Collection** line and open *Mapping › Power BI Licenses*: if there is no run, click **Run now**; if there is one marked **Failed**, read the message in the **Error** column. The permission request only appears when the failure was a missing permission in Microsoft Graph.

</details>

<details>

<summary>The inactivity findings appear as "Not evaluated".</summary>

The activity log does not yet cover the required window (30 or 90 days) or is outdated. This is common in the first weeks of using Power Monitor. The screen shows "Not evaluated" instead of zero so as not to suggest that nobody is inactive.

</details>

<details>

<summary>A person appears as inactive, but they say they use Power BI.</summary>

Inactivity considers any event in the tenant's Power BI and Fabric activity log. Check in [Events Overview](/en/power-monitor/auditoria/geral-de-eventos.md) whether there are events from them and whether the log ingestion is up to date. Views made through other channels that do not generate an event in the tenant's activity log (for example, content accessed in another tenant) do not count.

</details>

<details>

<summary>Why does a user with Microsoft 365 E5 appear as Pro?</summary>

E5 includes Power BI Pro. Each person's level comes from the service plans they receive, not from the subscription name. In the **License** column, the **bundle** indication shows that Pro comes from E5.

</details>

<details>

<summary>The "Assigned on" date is the same for almost everyone.</summary>

The date shown is that of the active plan recorded by Microsoft, which can be restamped for the whole tenant when a service is reprovisioned. It is not necessarily the date of the purchase or of the first assignment.

</details>

<details>

<summary>The prices I entered disappeared on another computer.</summary>

The prices on the **Savings opportunities** card are saved only in the browser where they were entered. In another browser or computer, the amounts go back to the reference list prices.

</details>

<details>

<summary>The Power Embedded card does not appear.</summary>

It only appears when there are positive monthly savings and at least one viewer who could move. It also does not appear for organizations that already use Power Embedded. If the card appears with only the notice that the estimate is unavailable, there is no US dollar exchange rate for the organization's currency. The other cards on the screen do not depend on it.

</details>

<details>

<summary>The savings on the Power Embedded card are different from those in Savings opportunities.</summary>

They are different calculations. **Savings opportunities** uses the prices you enter and adds up all license adjustments (inactive, redundant, downgrades). **Power Embedded** uses list prices, considers only the viewers who would no longer need a license and subtracts the platform and capacity cost.

</details>

<details>

<summary>I removed licenses and the numbers did not change.</summary>

The collection is daily. In *Mapping › Power BI Licenses*, click **Run now** and, when the run is **Completed**, reload the page.

</details>

## Related pages

* [Governance](/en/power-monitor/governanca.md)
* [Settings › Additional Permissions](/en/power-monitor/configuracoes/permissoes-adicionais.md#power-bi-licenses)
* [Settings › Monitoring](/en/power-monitor/configuracoes/monitoramento.md)
* [Mapping › Audit](/en/power-monitor/mapeamento/auditorias.md)
* [Events Overview](/en/power-monitor/auditoria/geral-de-eventos.md)
* [Departed Owners](/en/power-monitor/governanca/conformidade/responsaveis-desligados.md)
* [Capacities](/en/power-monitor/governanca/infraestrutura/capacidades.md)


---

# Agent Instructions
This documentation is published with GitBook. GitBook is the documentation platform designed so that both humans and AI agents can read, navigate, and reason over technical content effectively. Learn more at gitbook.com.

## Querying This Documentation
If you need additional information that is not directly available in this page, you can query the documentation by asking a question.

Perform an HTTP GET request on the following URL with the `ask` and `goal` query parameters:

```
GET https://docs.powermonitor.com.br/en/power-monitor/governanca/tenant/licencas-power-bi.md?ask=<question>&goal=<user_goal>
```

`ask` is the immediate question: it should be specific, self-contained, and written in natural language.
`goal` is what the user is ultimately trying to achieve, the reason they need the answer. Sharing it helps GitBook give you a better, more relevant answer. A goal is most helpful when it describes the outcome the user wants rather than restating the question. For example, with `ask=how do I create an API token`, a goal like `automate deployments from our CI pipeline` lets GitBook tailor the answer to that use case.

The response will contain a direct answer to the question and relevant excerpts and sources from the documentation.

Use this mechanism when the answer is not explicitly present in the current page, you need clarification or additional context, or you want to retrieve related documentation sections.