> For the complete documentation index, see [llms.txt](https://docs.powermonitor.com.br/llms.txt). Markdown versions of documentation pages are available by appending `.md` to page URLs; this page is available as [Markdown](https://docs.powermonitor.com.br/en/power-monitor/governanca/workspaces.md).

# Workspaces

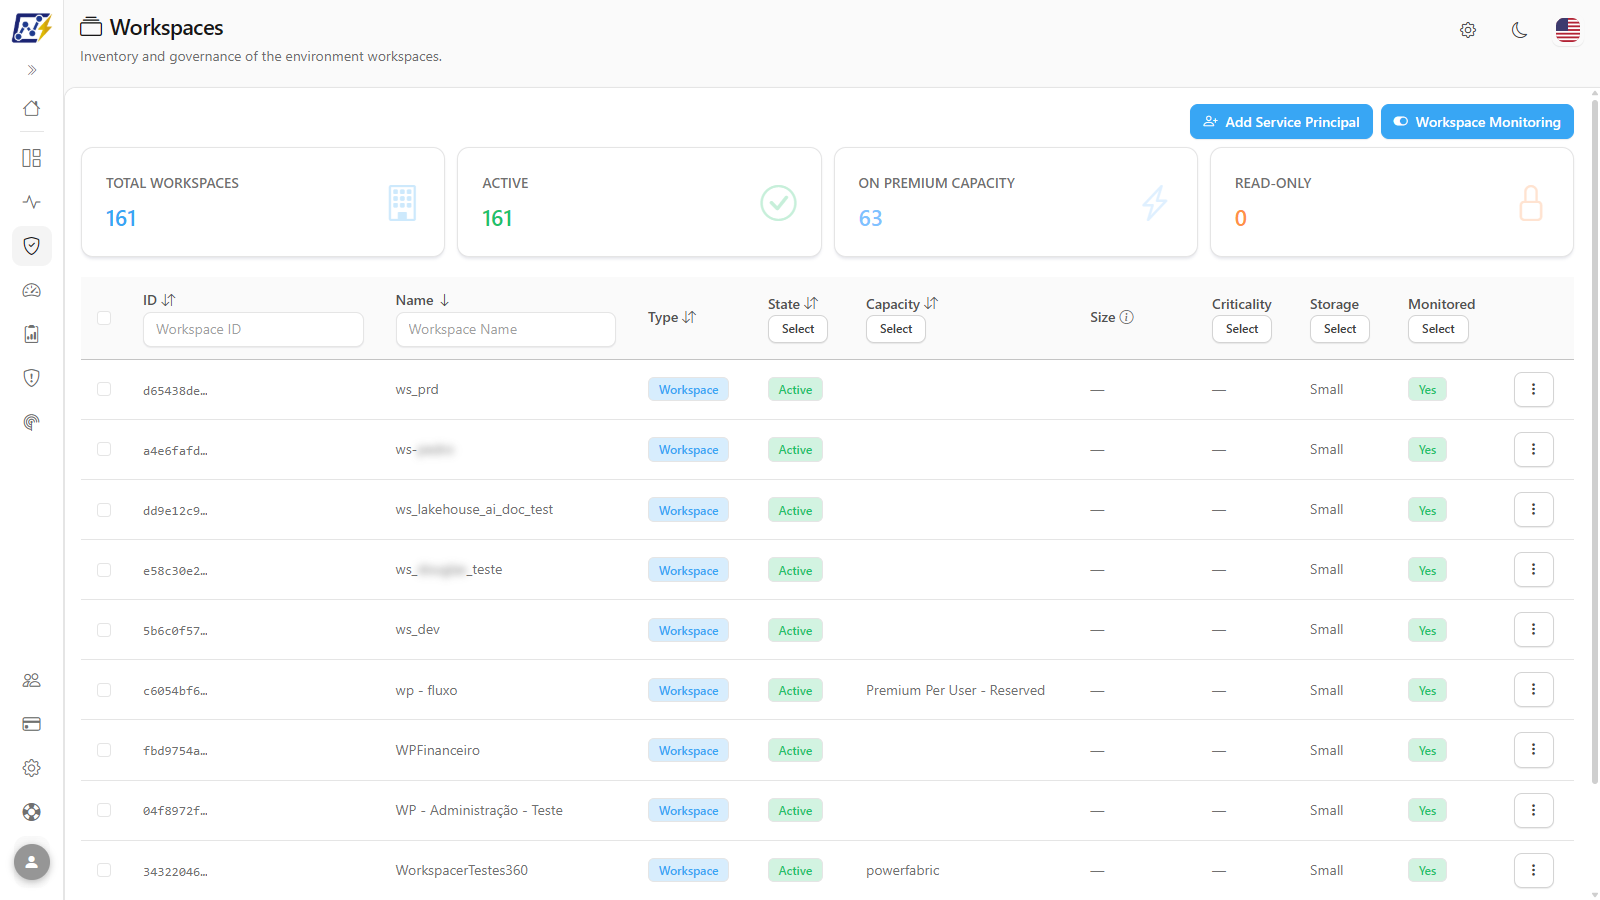
Inventory of the tenant's workspaces, choice of which workspaces are monitored (and billed), governance metadata, size, details and actions per workspace.

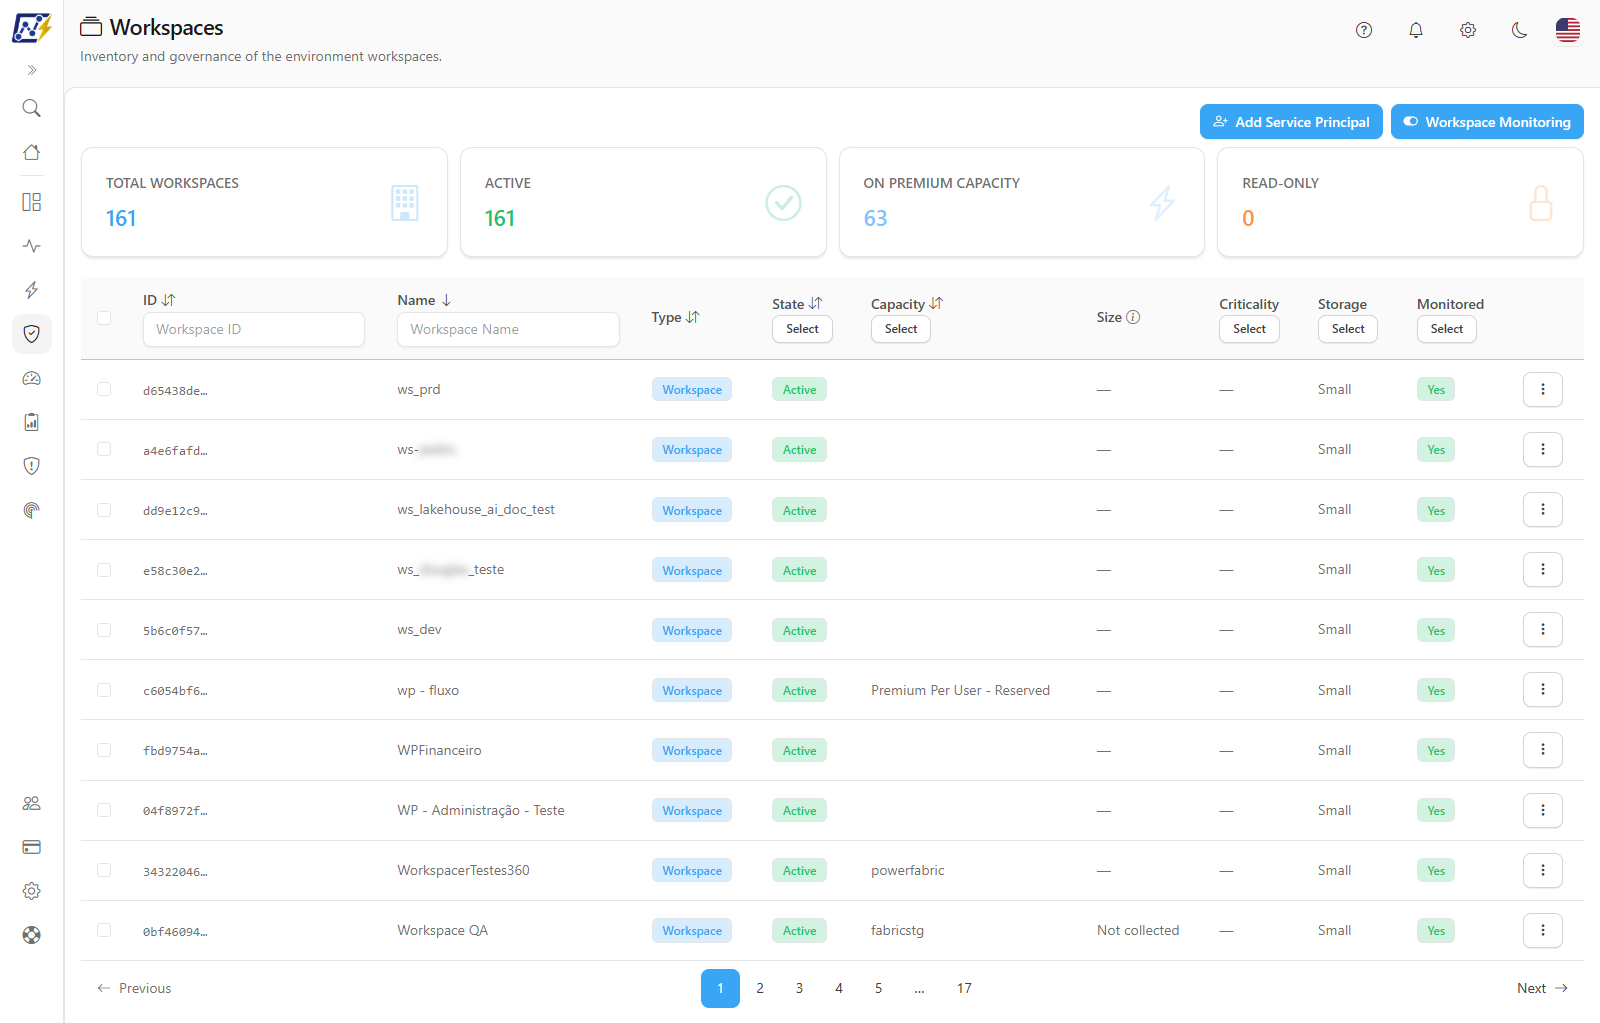
The **Workspaces** screen is the starting point for governance in Power Monitor. It lists the Microsoft Fabric / Power BI tenant's workspaces with capacity, size, criticality and monitoring status, and it is from here that the Administrator decides **which workspaces Power Monitor monitors**: a decision that defines the scope of scans, alerts and the billing item count.

**How to access:** menu *Governance › Workspaces*. The screen is available to all profiles; the **Add Service Principal** and **Workspace Monitoring** buttons, bulk selection (governance editing and capacity change), governance editing, the deviation monitoring switch and **workspace management** (name, description, capacity and access, changed directly in Fabric) are exclusive to **Administrator**.

<figure><picture><source srcset="/files/2lI5wubV5va5U9kH8Pxe" media="(prefers-color-scheme: dark)"><img src="https://3938213054-files.gitbook.io/~/files/v0/b/gitbook-x-prod.appspot.com/o/spaces%2FH2bFRBmIfyK3kwVKbldl%2Fuploads%2Fgit-blob-6b6aed5aec5c29653309cc17ec6d96a49856bd72%2Fpm-governanca-workspaces-en.png?alt=media" alt="Workspaces screen with the totals cards, the administration buttons and the workspaces table"></picture><figcaption><p>Workspaces inventory</p></figcaption></figure>

## What it is for

* **Define the monitoring scope:** choose which workspaces are included in the Daily Full Scan, in semantic model alerts, in Fabric Jobs monitoring and in the billing item count.
* **Have an asset view of the environment:** how many workspaces exist, which are on dedicated capacity, which are read-only, how much space the semantic models of each one take up.
* **Assign responsibility:** record the technical owner, business area contact, criticality and business area/sub-area of each workspace: the basis for alerts, cost reports by business area and audits.
* **Audit access:** see who has access to each workspace and which artifacts it contains.
* **Manage the workspace without opening Fabric:** rename it, change the description, change the capacity (of one workspace or of several at once) and add, change or remove access, with a history of each change.
* **Make a quick backup:** download all the reports of a workspace at once.

## Features

### Totals cards

**What it is:** four cards at the top of the screen (**Total Workspaces**, **Active**, **On Premium Capacity** and **Read-only**) with the count of the workspaces in the list.

**What it is for:** give, at a glance, the size of the environment and how much of it is on dedicated capacity or locked for editing, for example, to answer "how many production workspaces do we have on Premium?".

<figure><picture><source srcset="/files/JRN4i9hqysMqFcjAb4sl" media="(prefers-color-scheme: dark)"><img src="https://3938213054-files.gitbook.io/~/files/v0/b/gitbook-x-prod.appspot.com/o/spaces%2FH2bFRBmIfyK3kwVKbldl%2Fuploads%2Fgit-blob-375426806bb1c327443558c36f1f5bd20e674187%2Fpm-governanca-workspaces-kpis-en.png?alt=media" alt="Total Workspaces, Active, On Premium Capacity and Read-only cards"></picture><figcaption><p>Totals cards of the Workspaces screen</p></figcaption></figure>

**How to use:**

1. Go to *Governance › Workspaces* and read the numbers on the cards.
2. Adjust the table filters (for example, **Monitored** = *All* or a specific **Capacity**): the cards are recalculated for the chosen subset.

**How it works:**

| Card                    | What it counts                                                              |
| ----------------------- | --------------------------------------------------------------------------- |
| **Total Workspaces**    | Workspaces in the list, according to the filters applied.                   |
| **Active**              | Workspaces in the *Active* state.                                           |
| **On Premium Capacity** | Workspaces hosted on dedicated capacity (Fabric, Premium, Embedded or PPU). |
| **Read-only**           | Workspaces marked as read-only in Power BI.                                 |

The cards are informational only (they are not clickable) and always reflect the loaded list with the current filters.

### Column filters

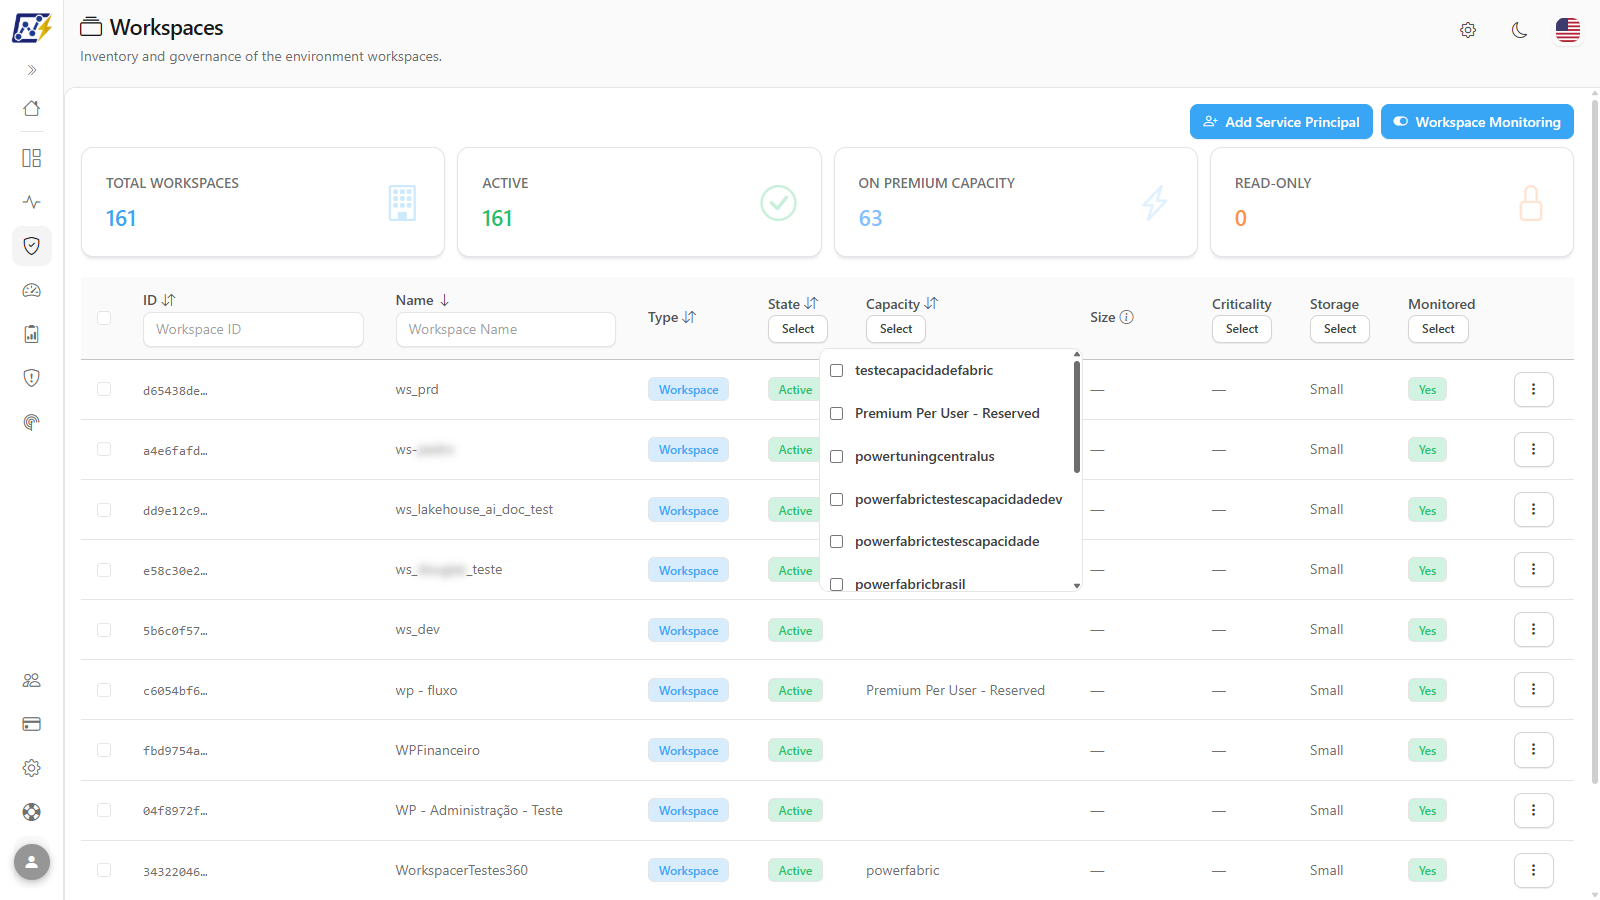
**What it is:** text boxes and selection lists in the header of each table column, which restrict the workspaces displayed.

**What it is for:** build subsets of the inventory: the workspaces of a production capacity, those with **High**/**Critical** criticality, those outside monitoring or those deleted in Power BI.

<figure><picture><source srcset="/files/Uz6yCNZtYChXDSE3N5hr" media="(prefers-color-scheme: dark)"><img src="https://3938213054-files.gitbook.io/~/files/v0/b/gitbook-x-prod.appspot.com/o/spaces%2FH2bFRBmIfyK3kwVKbldl%2Fuploads%2Fgit-blob-2162e4de429ad7843a1c36ec33e4848196ebd7cb%2Fpm-governanca-workspaces-filtro-capacidade-en.png?alt=media" alt="Selection list of the Capacity filter open, with the tenant&#x27;s capacities and the No capacity option"></picture><figcaption><p>Capacity column filter</p></figcaption></figure>

**How to use:**

{% stepper %}
{% step %}

#### Open the screen

Go to *Governance › Workspaces*. The list opens filtered by **State** = *Active* and **Monitored** = *Monitored*.
{% endstep %}

{% step %}

#### Filter by text

Type the term in the filter box below the title of the **Name** (*Workspace Name*) or **ID** (*Workspace ID*) column. The table is filtered automatically.
{% endstep %}

{% step %}

#### Filter by list

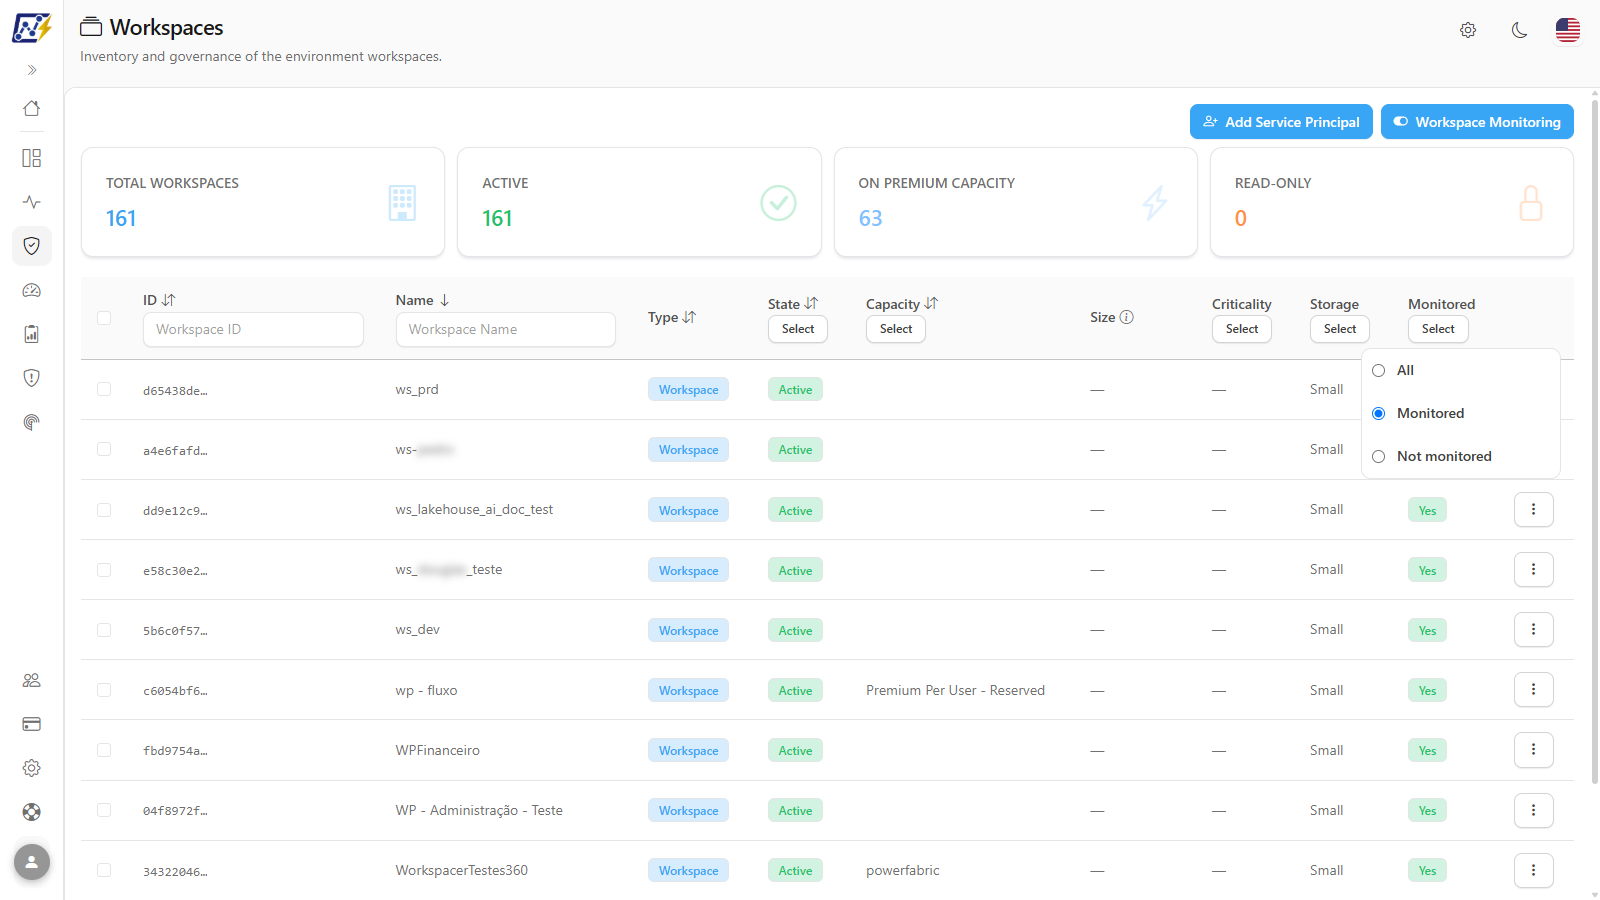
In the **State**, **Capacity**, **Criticality**, **Storage** and **Monitored** columns, click **Select** and check the desired options. In **Capacity**, the **No capacity** option brings the workspaces on shared capacity. In **Storage** and **Monitored** the choice is single; clicking the already selected option again removes the filter.
{% endstep %}
{% endstepper %}

<figure><picture><source srcset="/files/4Y40cURHfTDfQ70ePTOf" media="(prefers-color-scheme: dark)"><img src="https://3938213054-files.gitbook.io/~/files/v0/b/gitbook-x-prod.appspot.com/o/spaces%2FH2bFRBmIfyK3kwVKbldl%2Fuploads%2Fgit-blob-feb30b31ec59f40a74a343ab4ff2bbb33dc12007%2Fpm-governanca-workspaces-filtro-monitorado-en.png?alt=media" alt="Monitored filter list open with the All, Monitored and Not monitored options"></picture><figcaption><p>Monitored column filter</p></figcaption></figure>

**How it works:**

| Filter          | Type                    | Options                                             |
| --------------- | ----------------------- | --------------------------------------------------- |
| **ID**          | Text (*Workspace ID*)   | —                                                   |
| **Name**        | Text (*Workspace Name*) | —                                                   |
| **State**       | Multiple selection      | **Active** (default), **Deleted**                   |
| **Capacity**    | Multiple selection      | Tenant capacities and **No capacity**               |
| **Criticality** | Multiple selection      | **Low**, **Medium**, **High**, **Critical**         |
| **Storage**     | Single selection        | **Small**, **Large**                                |
| **Monitored**   | Single selection        | **All**, **Monitored** (default), **Not monitored** |

Any filter change reloads the list after a short pause and returns to the first page. The totals cards and the pagination then reflect the filtered subset.

{% hint style="info" %}
To see workspaces deleted in Power BI, check **Deleted** in the **State** filter. To see those outside the monitoring scope, choose **All** or **Not monitored** in the **Monitored** filter.
{% endhint %}

### Sorting and pagination

**What it is:** sorting by clicking the column titles and navigation between pages in the table footer.

**What it is for:** visually group workspaces by capacity, state or type, or put them in alphabetical order for checking.

**How to use:**

1. Click the title of the **ID**, **Name**, **Type**, **State** or **Capacity** column. The first click sorts in descending order; click again to reverse it. The arrow next to the title indicates the current column and direction.
2. Use the footer controls to navigate between pages.

**How it works:** the **Size**, **Criticality**, **Storage** and **Monitored** columns are not sortable. The list shows 10 workspaces per page by default; the **Items per page** selector in the footer switches to 10, 25, 50 or 100 and returns to the first page.

### Workspaces table

**What it is:** the list of the tenant's workspaces with the main properties of each one.

**What it is for:** check, row by row, where the workspace is hosted, how much space it takes up, what criticality has been assigned and whether it is in the monitoring scope.

**How to use:** read the row's columns; click the row to open the details (see [Workspace details: Overview](#workspace-details-overview)); hover over the **ID** to see the full identifier and over **Size** to see the exact value.

**How it works:**

| Column          | Description                                                                                                                                                                     |
| --------------- | ------------------------------------------------------------------------------------------------------------------------------------------------------------------------------- |
| *(selection)*   | Checkbox for bulk governance editing. Administrator only.                                                                                                                       |
| **ID**          | GUID of the workspace in Power BI (displayed abbreviated; hover to see the full value).                                                                                         |
| **Name**        | Name of the workspace.                                                                                                                                                          |
| **Type**        | **Workspace** or **Admin Workspace**. Personal workspaces are not listed.                                                                                                       |
| **State**       | **Active** or **Deleted**.                                                                                                                                                      |
| **Capacity**    | Name of the capacity where the workspace is hosted.                                                                                                                             |
| **Size**        | Sum of the size of the workspace's semantic models (see [Size column](#size-column)).                                                                                           |
| **Criticality** | **Low**, **Medium**, **High** or **Critical** badge ("—" when not classified).                                                                                                  |
| **Storage**     | Default storage format of the workspace's semantic models: **Small** or **Large** (large semantic model format). When Power BI does not report it, the default *Small* applies. |
| **Monitored**   | Green **Yes** or gray **No** badge: whether the workspace is in the monitoring scope.                                                                                           |
| **⋮**           | Row actions menu (see [Actions menu](#actions-menu)).                                                                                                                           |

### Size column

**What it is:** the in-memory size (VertiPaq) summed across all semantic models of the workspace.

**What it is for:** find the workspaces that consume the most capacity memory: the first candidates for model optimization or for migration to another capacity.

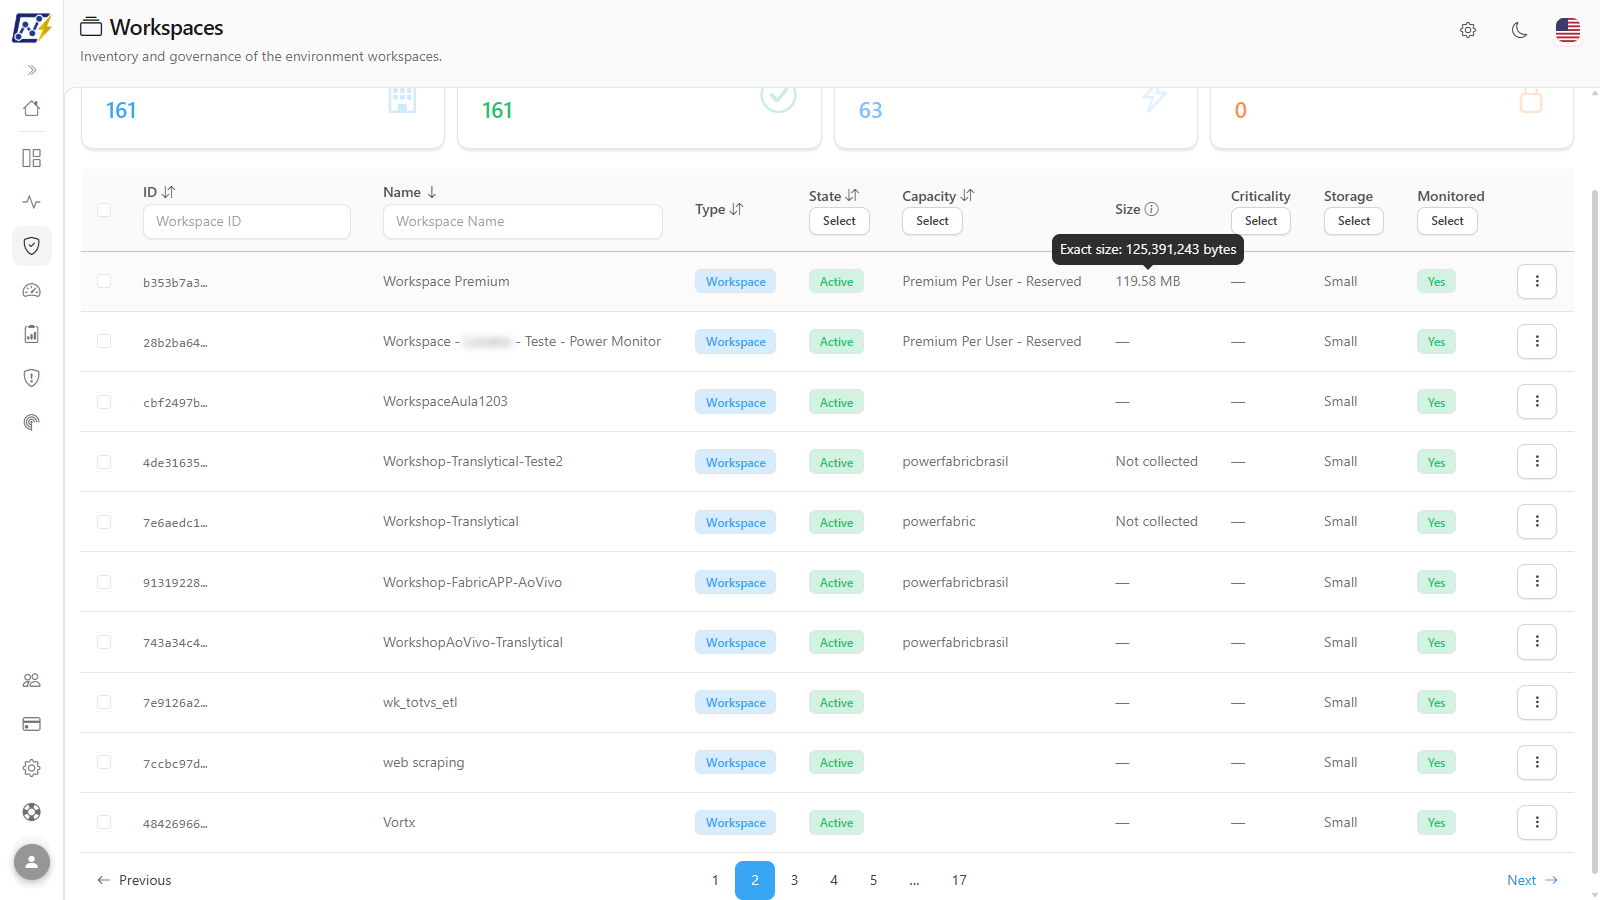
<figure><picture><source srcset="/files/U1IK74y7545nn402SEle" media="(prefers-color-scheme: dark)"><img src="https://3938213054-files.gitbook.io/~/files/v0/b/gitbook-x-prod.appspot.com/o/spaces%2FH2bFRBmIfyK3kwVKbldl%2Fuploads%2Fgit-blob-599e6afeda5fac56586fb51bdfddf6b8e6a7ec84%2Fpm-governanca-workspaces-tamanho-tooltip-en.png?alt=media" alt="Tooltip on the Size column showing the exact size in bytes and the coverage of measured models"></picture><figcaption><p>Size column tooltip</p></figcaption></figure>

**How to use:**

1. Locate the **Size** column in the table. Hover over the information icon next to the title to see the explanation of the column.
2. Hover over a row's value to see the exact size in bytes and, if coverage is partial, how many models were measured.

**How it works:** the size comes from the daily capture via XMLA (see [Semantic Models](/en/power-monitor/governanca/modelos-semanticos.md#size-column)) and only exists for workspaces on Fabric, Power BI Embedded, Premium or PPU capacity:

| Value             | Meaning                                                                                                                                                                                         |
| ----------------- | ----------------------------------------------------------------------------------------------------------------------------------------------------------------------------------------------- |
| **—**             | Workspace without dedicated capacity (or without semantic models): the data does not apply.                                                                                                     |
| **Not collected** | No model in the workspace has had its size collected yet.                                                                                                                                       |
| Size (KB/MB/GB)   | Sum of the models already measured. The tooltip shows the exact value in bytes and, if coverage is partial, how many models were measured (e.g.: "8 of 10 semantic models with captured size"). |

### Actions menu

**What it is:** the menu opened by the **⋮** button at the end of each row (or by right-clicking anywhere on the row), with the actions available for that workspace.

**What it is for:** reach the details, governance editing, report download or the workspace in Power BI in one click.

<figure><picture><source srcset="/files/a5piPWnEEr5QZokesCtL" media="(prefers-color-scheme: dark)"><img src="https://3938213054-files.gitbook.io/~/files/v0/b/gitbook-x-prod.appspot.com/o/spaces%2FH2bFRBmIfyK3kwVKbldl%2Fuploads%2Fgit-blob-e8c773cb476da800284f2ead6784c01a6cfb0da2%2Fpm-governanca-workspaces-menu-acoes-en.png?alt=media" alt="Actions menu of a workspace with the Open details submenu open"></picture><figcaption><p>Actions menu of a workspace</p></figcaption></figure>

**How to use:**

1. Click the row's **⋮** button, or right-click the row.
2. Click the desired action. To go straight to a details tab, hover over **Open details** and choose the tab in the submenu.

**How it works:**

| Action                   | What it does                                                                                                                | Who sees it   |
| ------------------------ | --------------------------------------------------------------------------------------------------------------------------- | ------------- |
| **Open details**         | Opens the details modal on the *Overview* tab. The submenu opens *Overview*, *Users & Permissions* or *Artifacts* directly. | Everyone      |
| **Edit governance**      | Opens the workspace's governance metadata modal.                                                                            | Administrator |
| **Download all reports** | Downloads all the workspace's reports (see [Download all reports](#download-all-reports)).                                  | Everyone      |
| **Open in Power BI**     | Opens the workspace in Power BI, in a new browser tab.                                                                      | Everyone      |

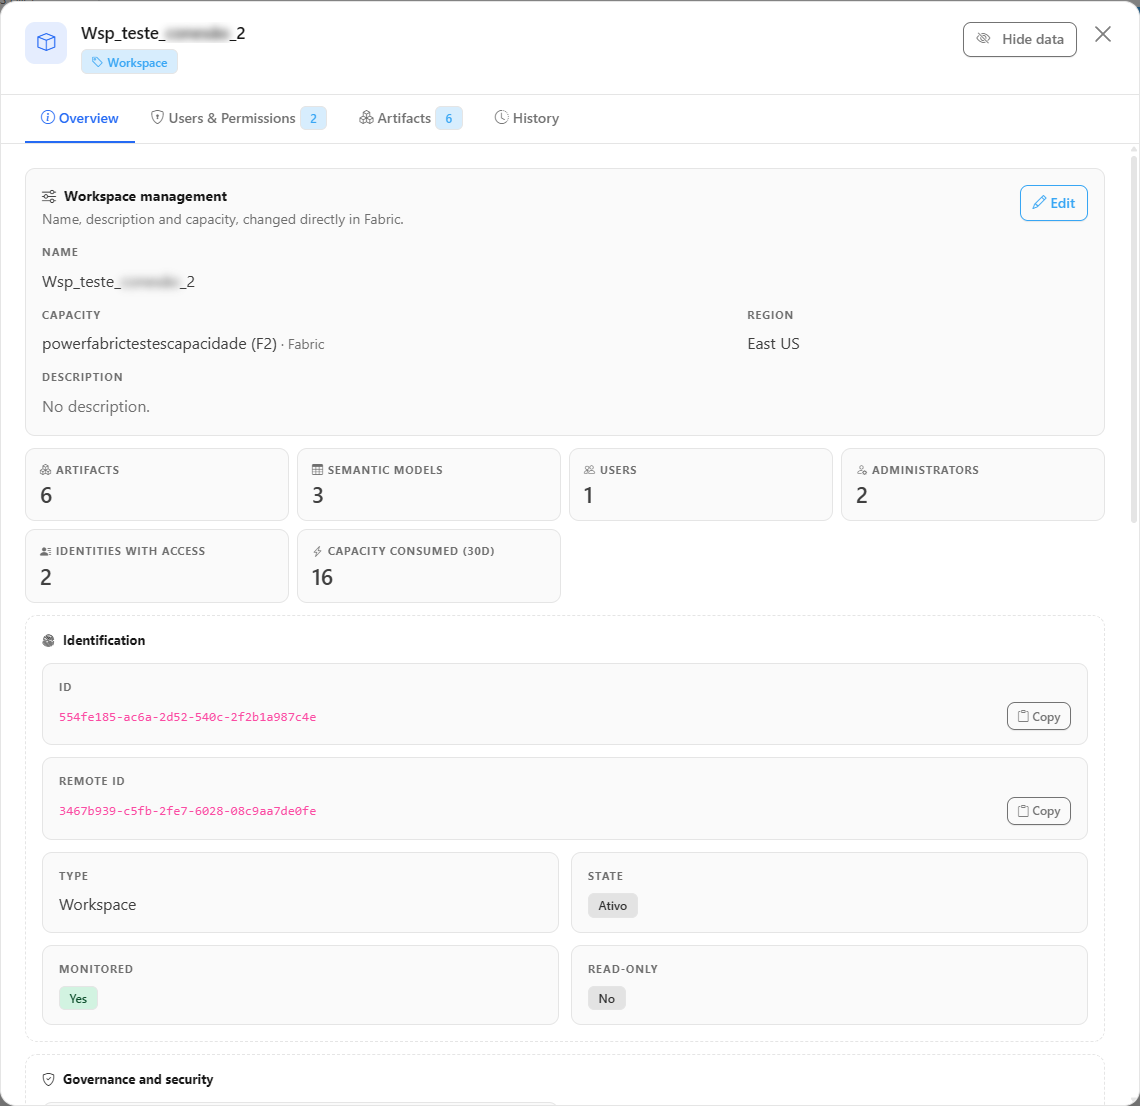
### Workspace details: Overview

**What it is:** the first tab of the details modal, with the **Workspace management** card at the top, followed by the workspace's properties organized in sections.

**What it is for:** check, in one place, the identifier, capacity, region, size, storage format and the people responsible for the workspace, turn on execution duration deviation monitoring and, for the Administrator, change the name, description and capacity.

<figure><picture><source srcset="/files/RD6eygcaXSkHqNMqpXKY" media="(prefers-color-scheme: dark)"><img src="https://3938213054-files.gitbook.io/~/files/v0/b/gitbook-x-prod.appspot.com/o/spaces%2FH2bFRBmIfyK3kwVKbldl%2Fuploads%2Fgit-blob-7fa5d7fc597cd8c425c57303a6fe795e2718237c%2Fpm-governanca-workspaces-modal-visao-geral-en.png?alt=media" alt="Workspace details modal, Overview tab, with the Workspace management card, the property sections and the deviation monitoring switch"></picture><figcaption><p>Workspace details: Overview</p></figcaption></figure>

**How to use:**

1. Click the workspace row, or the **⋮** button › **Open details**. The modal opens on the **Overview** tab.
2. Read the **Workspace management** card (name, capacity with its type, **Region** and description) and the sections below it.
3. Click **Copy** next to the ID to copy the workspace identifier (the button shows **Copied!**).
4. Close the modal with the **X** in the upper right corner or by clicking outside it.

**How it works:** below the card, the tab follows the [common Overview structure](/en/power-monitor/governanca/relatorios.md#the-overview-tab) (indicators at the top and the **Identification**, **Dates**, **Governance and security**, **Capacity and location** and **Content** sections). Name, description and capacity are shown only in the **Workspace management** card, without being repeated in the sections. The **Capacity and location** section has **Size**, **Default Storage Format** and **Workspace-level Settings**; the **Governance and security** section has the **Monitor execution duration deviation** switch and, when filled in, Responsible person, Business Area Contact, Criticality, Business Area and Business Sub-Area. Each field only appears when the data exists.

### Workspace management

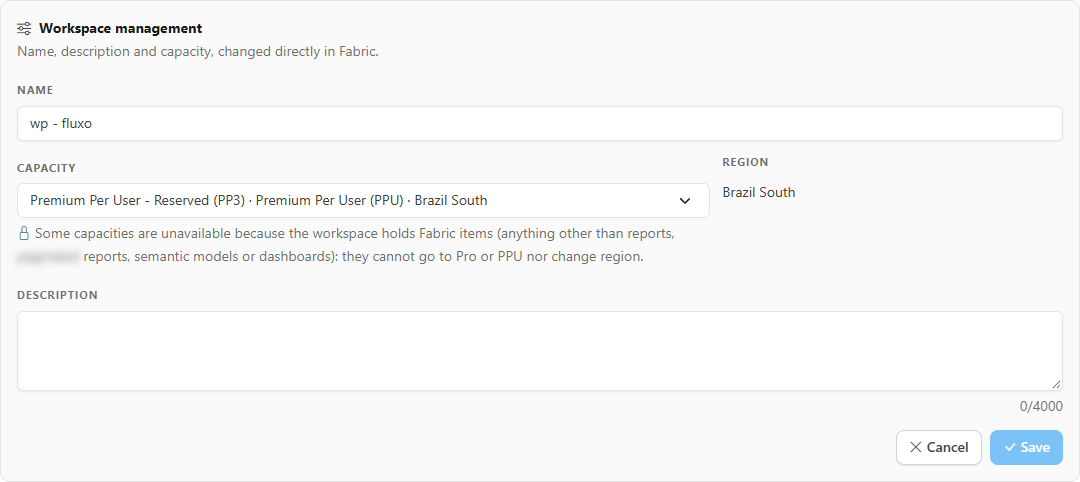
**What it is:** the **Workspace management** card (*Name, description and capacity, changed directly in Fabric.*), at the top of the **Overview** tab, with the **Edit** button.

**What it is for:** rename a workspace, fix its description or move it to another capacity (or take it out of the capacity) without opening the Fabric portal.

<figure><picture><source srcset="/files/TR5XHcbQPzbyOW0i9Zyc" media="(prefers-color-scheme: dark)"><img src="https://3938213054-files.gitbook.io/~/files/v0/b/gitbook-x-prod.appspot.com/o/spaces%2FH2bFRBmIfyK3kwVKbldl%2Fuploads%2Fgit-blob-1f7febdcfa96f759cb3d8301b74a20f71c869eeb%2Fpm-governanca-workspaces-modal-gestao-editar-en.png?alt=media" alt="Workspace management card in edit mode, with the Name, Capacity, Region and Description fields and the Cancel and Save buttons"></picture><figcaption><p>Editing the workspace name, description and capacity</p></figcaption></figure>

{% hint style="info" %}
Requires the **Administrator** profile. For the other profiles, the card shows the known values and the **Edit** button appears disabled with the hint "This action is restricted to organization administrators.".
{% endhint %}

{% stepper %}
{% step %}

#### Enter edit mode

Open the workspace details and, on the **Workspace management** card, click **Edit**. The button is only enabled after Power Monitor loads the workspace's current data from Fabric.
{% endstep %}

{% step %}

#### Change the fields

Change the **Name** (required), the **Description** (the counter shows how many characters are left) and, if you want, choose another **Capacity**. The capacity list is grouped by type and, within each type, by region: first **No capacity** (**Pro workspace (shared)** and the **PPU workspace** capacities), then **Fabric capacities**, **Power BI Premium capacities**, and **Power BI Embedded capacities**. Each option shows the name, the SKU and the state of the capacity (**On**, **Paused**, **Pausing**, **Provisioning**, etc.; F0 capacities show **On-demand** and the Pro and PPU options have no state), and the workspace's current capacity has the **Current** badge; next to the field, **Region** shows the region of the chosen capacity. The list can also be used with the keyboard (arrows, Enter, and Esc).
{% endstep %}

{% step %}

#### Save

Click **Save** (or **Cancel** to discard). The **Save** button is only enabled when something changed. If the new capacity is in another region, if it is not turned on or if you chose **Pro workspace (shared)**, Power Monitor asks for confirmation before sending (see the table below).
{% endstep %}
{% endstepper %}

<figure><picture><source srcset="/files/qNnsOHWfAUYqsUAERB8Y" media="(prefers-color-scheme: dark)"><img src="https://3938213054-files.gitbook.io/~/files/v0/b/gitbook-x-prod.appspot.com/o/spaces%2FH2bFRBmIfyK3kwVKbldl%2Fuploads%2Fgit-blob-2be65c5b5edab8b9c55a29dc104c33ccb1c59c5c%2Fpm-governanca-workspaces-confirmar-capacidade-en.png?alt=media" alt="Move to a capacity in another region? confirmation with the notice about migrating the content and the enterprise gateways"></picture><figcaption><p>Confirmation before moving the workspace to a capacity in another region</p></figcaption></figure>

**How it works:**

* The changes are made **directly in Fabric**, right away, and are recorded on the [History](#workspace-details-history) tab. Only what changed is sent.
* **Blocked capacities:** if the workspace has **Fabric items** (anything other than a report, paginated report, semantic model or dashboard), some capacities appear disabled in the list, with the reason in the option text itself, and the notice below the field explains the rule. Only Fabric items block the change; a workspace with only reports, paginated reports, semantic models and dashboards can go to any capacity.

| Reason in the option                                                   | When it appears                                                                                              |
| ---------------------------------------------------------------------- | ------------------------------------------------------------------------------------------------------------ |
| **Fabric items cannot change region (current:&#x20;*****region*****)** | The target capacity is in another region and the workspace has Fabric items.                                 |
| **Fabric items cannot go to Pro or PPU**                               | The target is **Pro workspace (shared)** or a **PPU workspace** capacity and the workspace has Fabric items. |

* **Changes that ask for confirmation:** they are allowed, but show the consequences before saving.

| Confirmation                                | When it appears                                                                                                            | What it warns                                                                                                                                                                                                  |
| ------------------------------------------- | -------------------------------------------------------------------------------------------------------------------------- | -------------------------------------------------------------------------------------------------------------------------------------------------------------------------------------------------------------- |
| **Move to a capacity in another region?**   | The target capacity is in another region.                                                                                  | The workspace content is migrated to the target region, and content that uses enterprise gateways may need adjusting to refresh again.                                                                         |
| **Move to a capacity that is turned off?**  | The target capacity is not turned on (for example, **Paused**). It appears after the region confirmation, when both apply. | The workspace content becomes unavailable (reports, semantic models and Fabric items do not open or refresh) until the capacity is turned on. The change is not blocked.                                       |
| **Remove the workspace from the capacity?** | The target is **Pro workspace (shared)**.                                                                                  | Only users with a Power BI Pro license will have access, the content moves back to its home region, enterprise gateways may need adjusting and usage and performance logs stop flowing to Azure Log Analytics. |

* If the capacity list does not load, only the current capacity is available ("Could not load the capacity options. Only the current capacity is available."); the change is blocked instead of taking a risk.
* Workspaces that are not active in Fabric cannot be changed: the card shows the reason and the **Edit** button is disabled.
* **Capacity overage:** for administrators, the card shows the **Capacity overage** row with the overage status of the workspace's current capacity, for example **Enabled (limit N CU-hours)** or **Disabled**. The row does not appear for workspaces without a capacity or for SKUs without overage. See [Overage](/en/power-monitor/governanca/infraestrutura/capacidades.md#overage).
* To change the capacity of several workspaces at once, see [Change capacity in bulk](#change-capacity-in-bulk).

### Workspace details: Users & Permissions
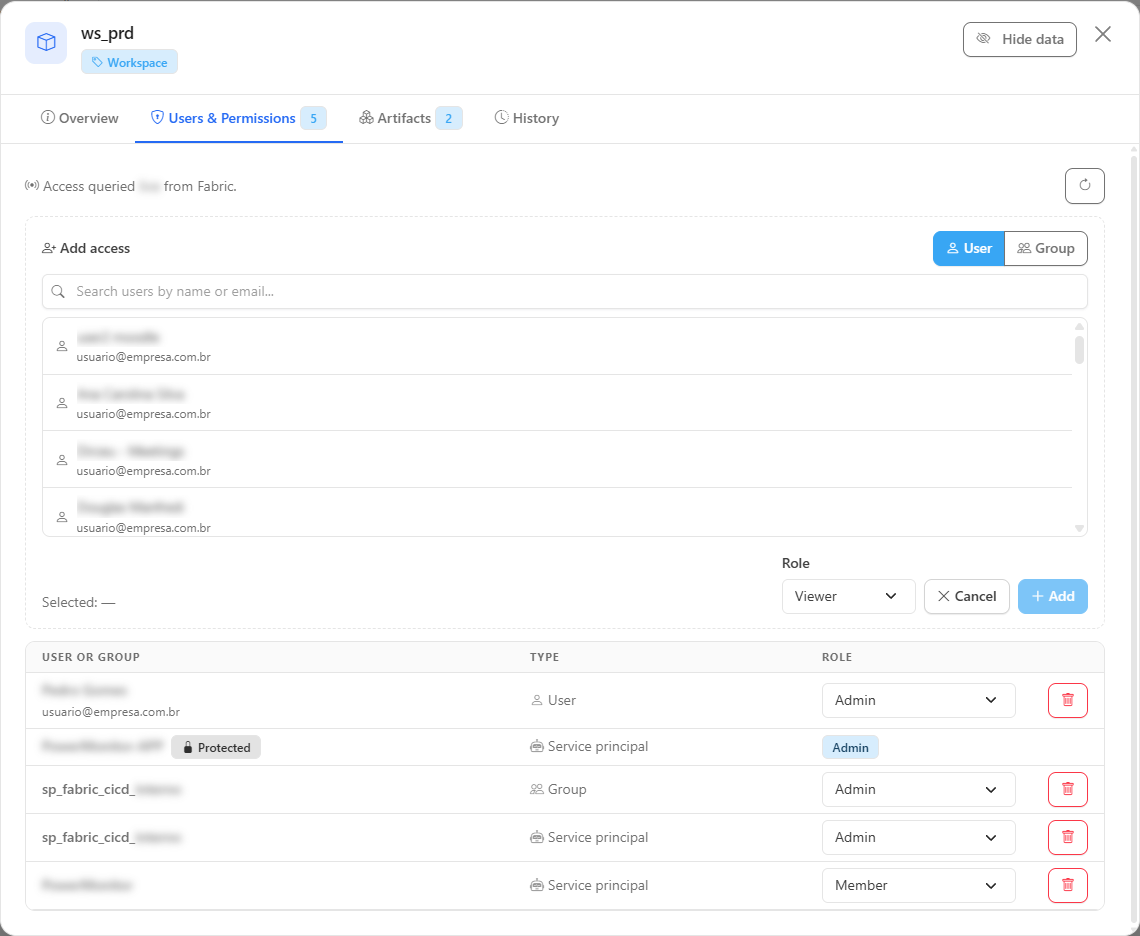
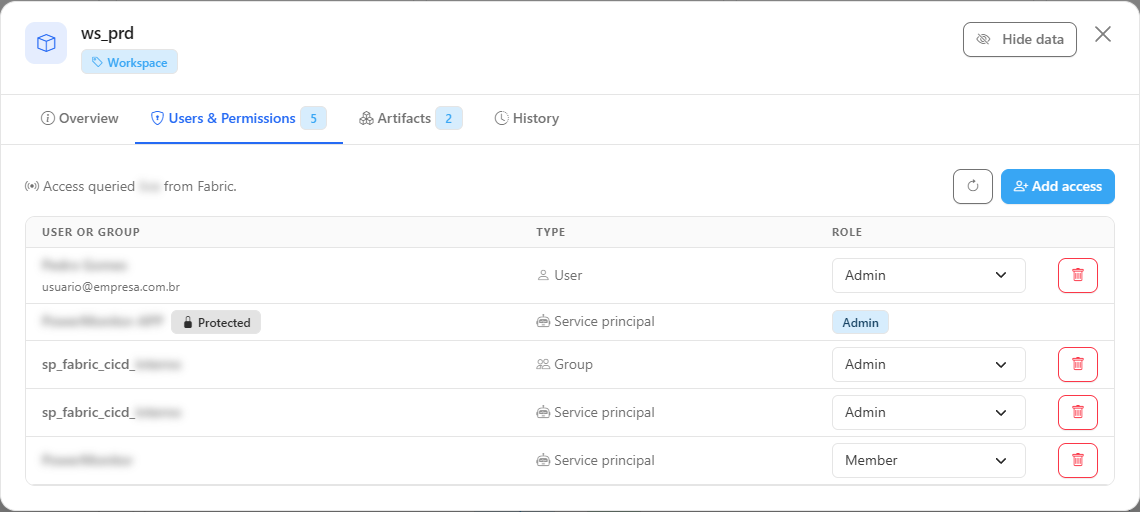
**What it is:** the tab that lists who has access to the workspace and with which role. For the Administrator, the list is queried **live in Fabric** (*Access queried live from Fabric.*) and lets you add, change and remove access.

**What it is for:** audit access before a change, identify external guests, confirm whether the Power Monitor Service Principal is already an administrator of the workspace and fix access without opening Fabric.

<figure><picture><source srcset="/files/vZB7Ko1wcjrQQC9QYYQV" media="(prefers-color-scheme: dark)"><img src="https://3938213054-files.gitbook.io/~/files/v0/b/gitbook-x-prod.appspot.com/o/spaces%2FH2bFRBmIfyK3kwVKbldl%2Fuploads%2Fgit-blob-15f7535a7fc25aa1f617a45654a0e970bb0bbabc%2Fpm-governanca-workspaces-modal-usuarios-en.png?alt=media" alt="Users &#x26; Permissions tab of the workspace modal with the User or group, Type and Role columns, the Protected badge and the Add access button"></picture><figcaption><p>Workspace details: Users &#x26; Permissions</p></figcaption></figure>

**How to use:**

1. In the workspace's **⋮** menu, hover over **Open details** and choose **Users & Permissions** (or open the details and click the tab).
2. Read the **User or group**, **Type** (User, Group, Service principal or Service principal profile) and **Role** columns. Use the refresh button to query Fabric again.
3. To **change the role** of an access, choose another role in the **Role** column list: **Admin**, **Member**, **Contributor** or **Viewer**. The change is applied right away, without confirmation.
4. To **remove** an access, click the row's trash button (**Remove access**) and confirm. The question shows the name, the role and the workspace, and the removal is applied immediately in Fabric.
5. To **add** an access, see [Add access](#add-access).

**How it works:**

* **Protected badge:** some rows cannot be changed or removed by Power Monitor. They show the **Protected** badge and the fixed role; hover over the badge to see the reason.

| Protected row                   | Reason                                                                                                                             |
| ------------------------------- | ---------------------------------------------------------------------------------------------------------------------------------- |
| Power Monitor Service Principal | Removing or downgrading it would stop scanning and management of this workspace.                                                   |
| Last admin                      | Add another admin before changing this access.                                                                                     |
| Group                           | Power Monitor may depend on the group to access the workspace. Grant Admin directly to the Service Principal to unlock the action. |

* After each change, the list is read again from Fabric.
* **Other profiles**, or when the live query fails, the tab shows the list from the last scan, read-only, with the **User**, **Identifier**, **Principal Type**, **Category** (Member or Guest/External) and **Access Level** columns and the **Search by name, email or identifier...** search. For the Administrator, the failure shows the notice "Could not query live access in Fabric. Showing the list from the last scan, read-only." and the **Try again** button. The **Add access** button is disabled in these cases.

### Add access

**What it is:** the form opened by the **Add access** button, on the **Users & Permissions** tab, which grants a role in the workspace to an Entra ID user or group.

**What it is for:** give access to a person or a group without opening Fabric, for example to include a new team member or a group of readers.

<figure><picture><source srcset="/files/oKGIgGYsrrL6pjAg9cC3" media="(prefers-color-scheme: dark)"><img src="https://3938213054-files.gitbook.io/~/files/v0/b/gitbook-x-prod.appspot.com/o/spaces%2FH2bFRBmIfyK3kwVKbldl%2Fuploads%2Fgit-blob-8156017808a1962e5b8f4c2cb0a63320b0c18c81%2Fpm-governanca-workspaces-modal-adicionar-acesso-en.png?alt=media" alt="Add access form with the User or Group selector, the directory search, the result list and the role to grant"></picture><figcaption><p>Adding access to a workspace</p></figcaption></figure>

{% hint style="info" %}
Requires the **Administrator** profile.
{% endhint %}

{% stepper %}
{% step %}

#### Open the form

On the **Users & Permissions** tab, click **Add access**.
{% endstep %}

{% step %}

#### Choose the principal type

In **Principal type**, choose **User** or **Group**.
{% endstep %}

{% step %}

#### Search the directory

Type in the search (*Search users by name or email...* or *Search groups by name...*) and click the desired result. Anyone who already has access appears with the **Has access** badge and cannot be chosen.
{% endstep %}

{% step %}

#### Choose the role and add

Check the principal under **Selected**, choose the **Role** and click **Add**. The access is granted in Fabric and the list is read again.
{% endstep %}
{% endstepper %}

**How it works:** the search queries the Entra ID directory. If the directory does not respond, "Could not search the directory." appears; if nothing is found, "No results found.". To change the role of someone who already has access, use the **Role** column of the list.

### Workspace details: Artifacts

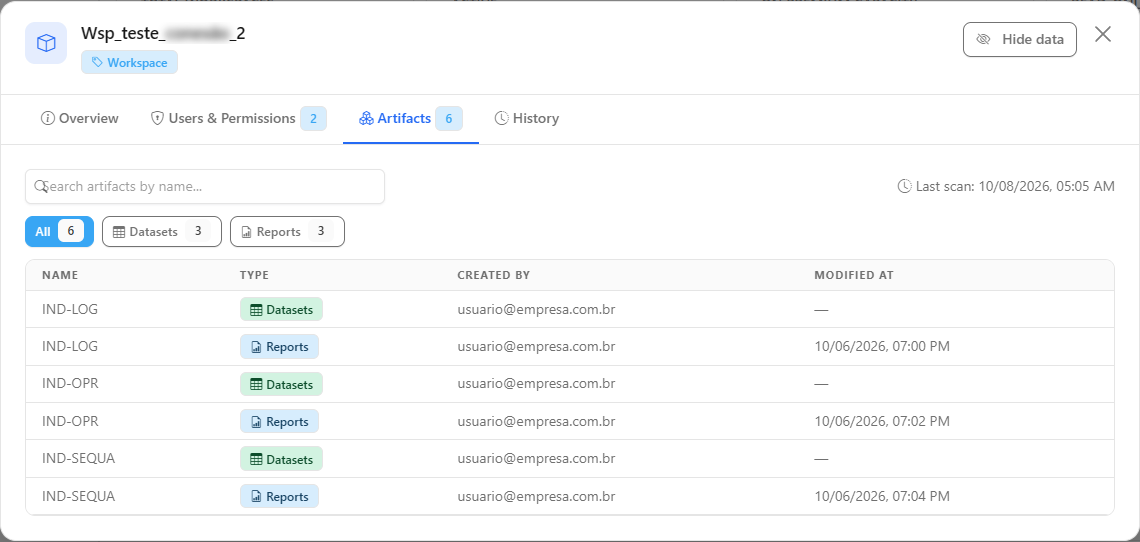
**What it is:** the tab that lists the workspace's artifacts, with search, a filter by type and the date of the last scan.

**What it is for:** understand the content of the workspace (which reports, semantic models, lakehouses, pipelines etc.) without opening each inventory screen.

<figure><picture><source srcset="/files/ifNrAWhUbpT0E1dK71V4" media="(prefers-color-scheme: dark)"><img src="https://3938213054-files.gitbook.io/~/files/v0/b/gitbook-x-prod.appspot.com/o/spaces%2FH2bFRBmIfyK3kwVKbldl%2Fuploads%2Fgit-blob-71a01abb30b38fca2570ece518ea364f1f2b6837%2Fpm-governanca-workspaces-modal-artefatos-en.png?alt=media" alt="Artifacts tab of the workspace modal with the search, the filter-by-type buttons, the last scan and the artifacts table"></picture><figcaption><p>Workspace details: Artifacts</p></figcaption></figure>

**How to use:**

1. In the workspace's **⋮** menu, hover over **Open details** and choose **Artifacts** (or open the details and click the tab).
2. Type in the **Search artifacts by name...** search to find an item.
3. Click one of the type buttons (**Filter by type**), each with its count, to see only that type; **All** returns to the full list.

**How it works:**

* The table shows **Name**, **Type**, **Created by** and **Modified at**, with 25 artifacts per page.
* The data is from the last inventory scan, shown at the top as **Last scan:&#x20;*****date*** (or *Last scan: not scanned yet*).
* The tab is available to all profiles.

### Workspace details: History

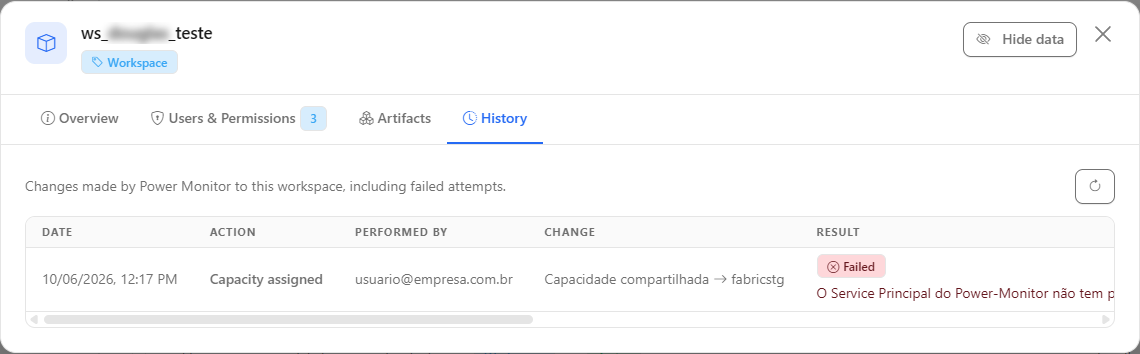
**What it is:** the modal's **History** tab, with the changes made by Power Monitor to the workspace, including failed attempts.

**What it is for:** find out who renamed the workspace, changed its capacity or changed access through Power Monitor, and why a change failed.

<figure><picture><source srcset="/files/BYVIHtrBEbLMK2QmbQfS" media="(prefers-color-scheme: dark)"><img src="https://3938213054-files.gitbook.io/~/files/v0/b/gitbook-x-prod.appspot.com/o/spaces%2FH2bFRBmIfyK3kwVKbldl%2Fuploads%2Fgit-blob-33101fd516bc8fd1d8ce8a067df8af34446cab7e%2Fpm-governanca-workspaces-modal-historico-en.png?alt=media" alt="History tab of the workspace modal with the Date, Action, Performed by, Change and Result columns"></picture><figcaption><p>Workspace change history</p></figcaption></figure>

{% hint style="info" %}
The tab only appears for the **Administrator** profile.
{% endhint %}

**How to use:** open the workspace details and click the **History** tab. Use the refresh button to reload the list.

**How it works:**

| Column           | Description                                                                                                                          |
| ---------------- | ------------------------------------------------------------------------------------------------------------------------------------ |
| **Date**         | Date and time of the change.                                                                                                         |
| **Action**       | **Name/description changed**, **Capacity assigned**, **Capacity removed**, **Access added**, **Role changed** or **Access removed**. |
| **Performed by** | Who made the change.                                                                                                                 |
| **Change**       | The **Target** (the user or group, for access actions) and the previous value → the new value.                                       |
| **Result**       | **Success** or **Failed**; for failures, the error message appears below the badge.                                                  |

Only changes made by Power Monitor are shown here; changes made directly in Fabric do not appear.

### Monitor execution duration deviation

**What it is:** the switch, on the **Overview** tab of the details, that includes **all** eligible items of the workspace (semantic models, pipelines, dataflows, notebooks and copy jobs) in average execution time deviation monitoring.

**What it is for:** be alerted when a run deviates from its usual duration (see [Average Execution Time](/en/power-monitor/performance/tempo-medio-de-execucao.md)) for all items of a critical workspace, without checking item by item.

**How to use:**

{% hint style="info" %}
Requires the **Administrator** profile. The deviation alert must be enabled in [Settings › Monitoring](/en/power-monitor/configuracoes/monitoramento.md).
{% endhint %}

1. Open the workspace details (click the row).
2. On the **Overview** tab, turn on the **Monitor execution duration deviation** switch.
3. To remove the workspace from deviation monitoring, turn off the same switch.

**How it works:**

* The change is saved immediately. If saving fails, the switch returns to its previous position and the message "Failed to update the execution duration deviation monitoring." appears.
* An item is monitored when **the item itself** or **its workspace** is checked.
* For profiles other than Administrator, the switch appears disabled, with the tooltip "This action is restricted to organization administrators.".
* If the **Apply to all items** option is turned on in the average execution time deviation settings (see [Settings › Monitoring](/en/power-monitor/configuracoes/monitoramento.md)), all items with run history are already monitored and this switch changes nothing.

### Governance metadata

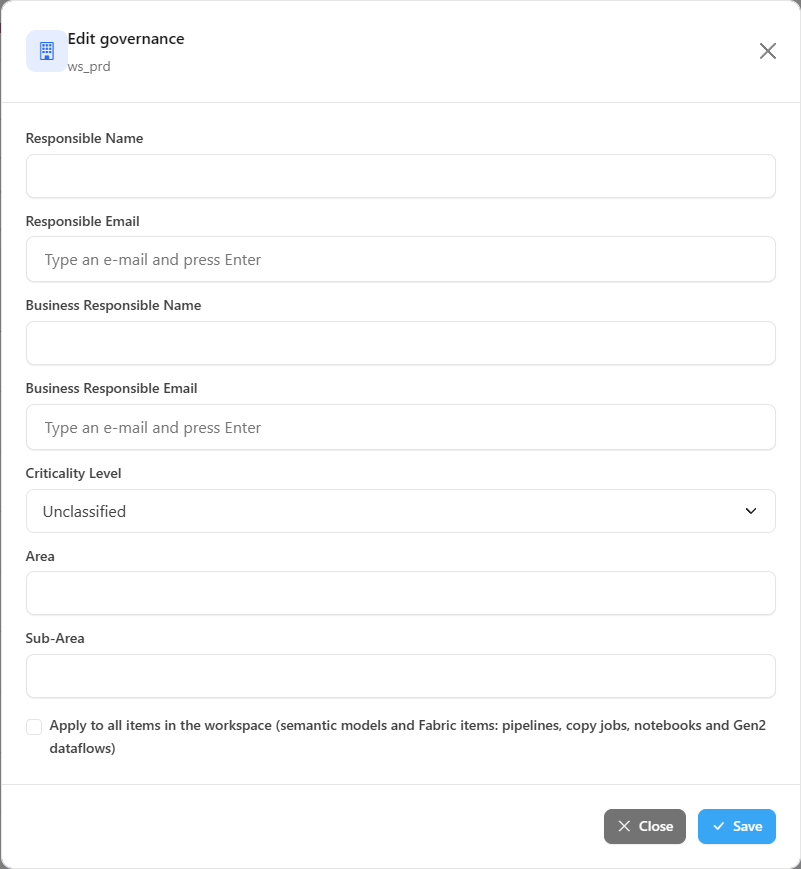
**What it is:** the **Edit governance** modal, which records the technical owner, the business contact, the criticality and the business area of a workspace.

**What it is for:** assign an owner and criticality to each workspace: information used as the recipient of alerts, as a filter for failure emails and in the cost views by business area.

<figure><picture><source srcset="/files/L0hhPfXztQ59TXUdP2WS" media="(prefers-color-scheme: dark)"><img src="https://3938213054-files.gitbook.io/~/files/v0/b/gitbook-x-prod.appspot.com/o/spaces%2FH2bFRBmIfyK3kwVKbldl%2Fuploads%2Fgit-blob-39596194c1a12192f72ac4591ebb153bcca5cb0b%2Fpm-governanca-workspaces-editar-governanca-en.png?alt=media" alt="Workspace Edit governance modal with the owner, criticality, area and sub-area fields"></picture><figcaption><p>Editing the governance metadata of a workspace</p></figcaption></figure>

#### How to edit the governance metadata

{% hint style="info" %}
Requires the **Administrator** profile.
{% endhint %}

{% stepper %}
{% step %}

#### Open the modal

In the workspace row's **⋮** menu, click **Edit governance**. The **Edit governance** modal opens filled in with the current values.
{% endstep %}

{% step %}

#### Fill in the fields

Enter **Responsible Name** and **Responsible Email**, **Business Responsible Name** and **Business Responsible Email**, **Criticality Level**, **Area** and **Sub-Area**. In the email fields, type each address and press **Enter** to add it; use the remove button next to an email to delete it.
{% endstep %}

{% step %}

#### Propagate, if you want

Check **Apply to all items in the workspace** to save the same values also on all semantic models and on the workspace's Data Pipelines, Copy Jobs, Notebooks and Dataflows Gen2 (Area and Sub-Area remain only on the workspace).
{% endstep %}

{% step %}

#### Save

Click **Save**. The message "Governance updated for 1 item(s)." confirms the save, the modal closes and the **Criticality** column and the **Governance** block of the details show the new values. In individual mode, all fields are saved; leaving a field empty erases the previous value.
{% endstep %}
{% endstepper %}

**How it works:**

| Field                                                          | Note                                                                                                                                                                                                                                                                                                                                                        |
| -------------------------------------------------------------- | ----------------------------------------------------------------------------------------------------------------------------------------------------------------------------------------------------------------------------------------------------------------------------------------------------------------------------------------------------------- |
| **Responsible Name** / **Responsible Email**                   | Technical owner. Accepts multiple emails (type and press Enter).                                                                                                                                                                                                                                                                                            |
| **Business Responsible Name** / **Business Responsible Email** | Business contact. Accepts multiple emails.                                                                                                                                                                                                                                                                                                                  |
| **Criticality Level**                                          | Low, Medium, High, Critical or Unclassified.                                                                                                                                                                                                                                                                                                                |
| **Area** / **Sub-Area**                                        | Business area and sub-area (free text, e.g.: "Sales" / "Domestic Sales"). They exist only for workspaces and feed the **Cost by Business Area** and **Cost by Business Sub-Area** views (see [Capacity Cost](/en/power-monitor/dashboards/custo-de-capacidade.md)).                                                                                         |
| **Apply to all items in the workspace**                        | Applies the same values (except Area and Sub-Area) also to **all semantic models** and to **all Fabric items that generate alerts** in the workspace: Data Pipelines, Copy Jobs, Notebooks and Dataflows Gen2 (see [Data Engineering](/en/power-monitor/governanca/dados-e-engenharia/engenharia-de-dados.md#how-to-edit-the-governance-of-a-fabric-item)). |

{% hint style="info" %}
The owner and business area contact emails can be used as recipients in alerts (for example, the option to notify the workspace contacts in data refresh delay alerts).
{% endhint %}

{% hint style="info" %}
The workspace's **Criticality Level** (and that of the items) can be used to filter the failure emails of semantic models and Fabric items: for example, notify the team only of failures in **High** or **Critical** workspaces. See [Settings › Notifications](/en/power-monitor/configuracoes/notificacoes.md#how-to-receive-failure-alerts-only-from-the-most-critical-workspaces-or-items).
{% endhint %}

### Bulk governance editing

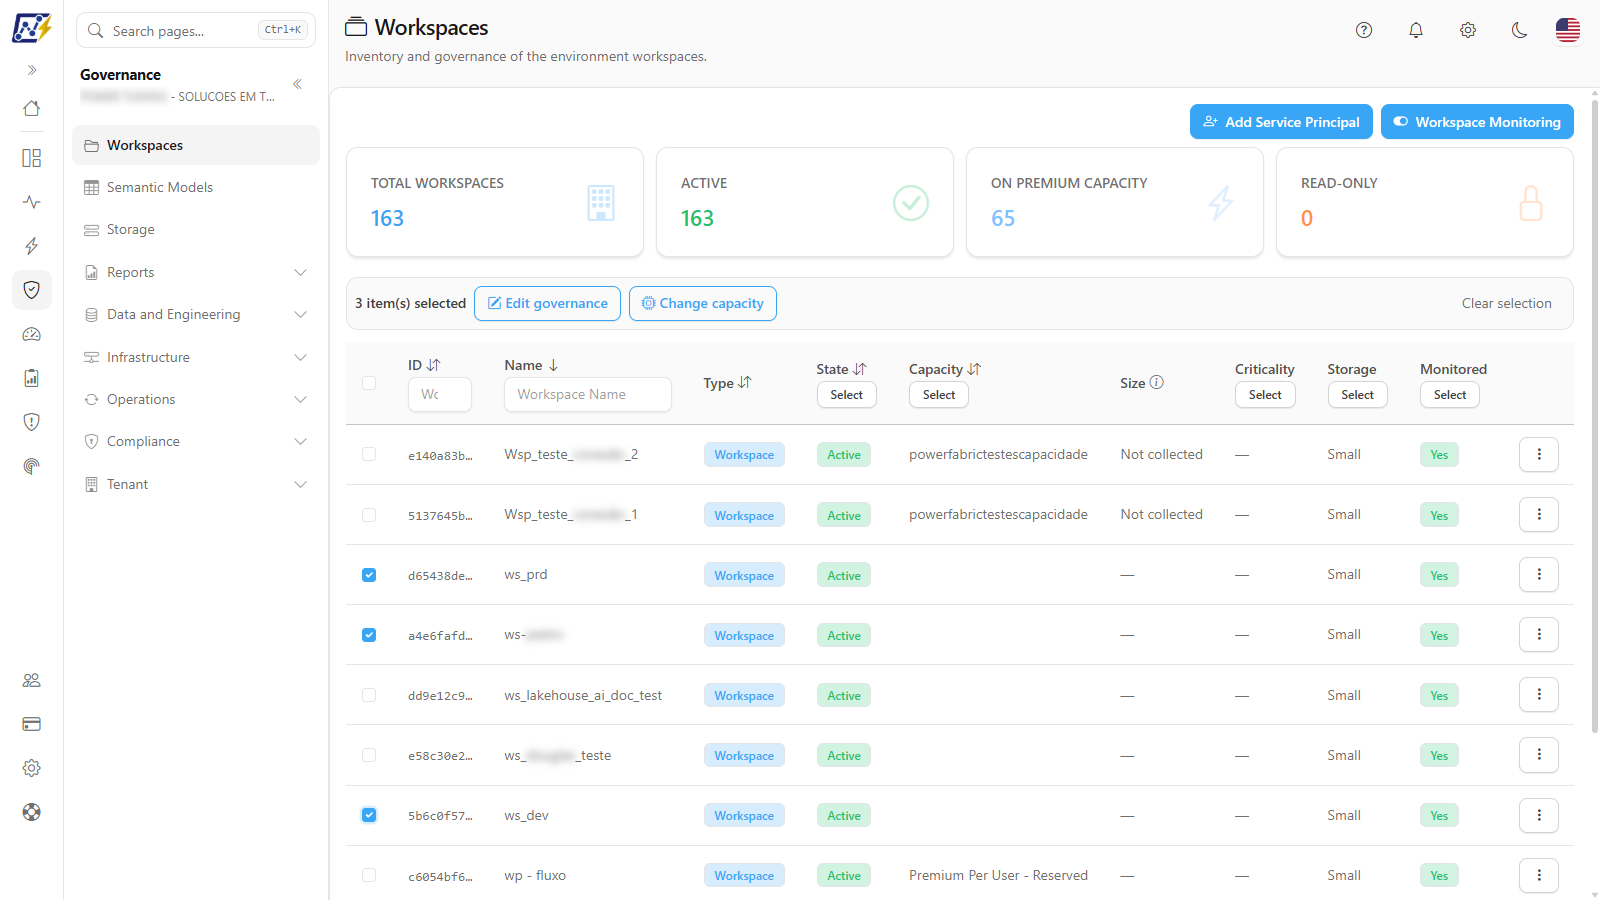
**What it is:** selecting several rows of the table and editing, at once, the governance metadata of all the selected workspaces.

**What it is for:** quickly classify many workspaces: for example, mark all workspaces of a production capacity as **Critical**, or define the same technical owner for all workspaces of an area.

<figure><picture><source srcset="/files/M4sJfq49mz3q4wj7V8hu" media="(prefers-color-scheme: dark)"><img src="https://3938213054-files.gitbook.io/~/files/v0/b/gitbook-x-prod.appspot.com/o/spaces%2FH2bFRBmIfyK3kwVKbldl%2Fuploads%2Fgit-blob-59de2aae3534be95a67a2ad98bbddb5c2c6ea758%2Fpm-governanca-workspaces-selecao-em-massa-en.png?alt=media" alt="Workspaces table with two rows checked and the 2 item(s) selected bar with the Edit governance and Clear selection buttons"></picture><figcaption><p>Bulk selection bar</p></figcaption></figure>

#### How to bulk edit metadata

{% hint style="info" %}
Requires the **Administrator** profile.
{% endhint %}

{% stepper %}
{% step %}

#### Select the workspaces

Filter the table (for example, by the production **Capacity**) and check the checkbox to the left of each workspace, or the header checkbox to check all on the current page. The "*N* item(s) selected" bar appears above the table; the selection is kept when changing pages.
{% endstep %}

{% step %}

#### Open bulk editing

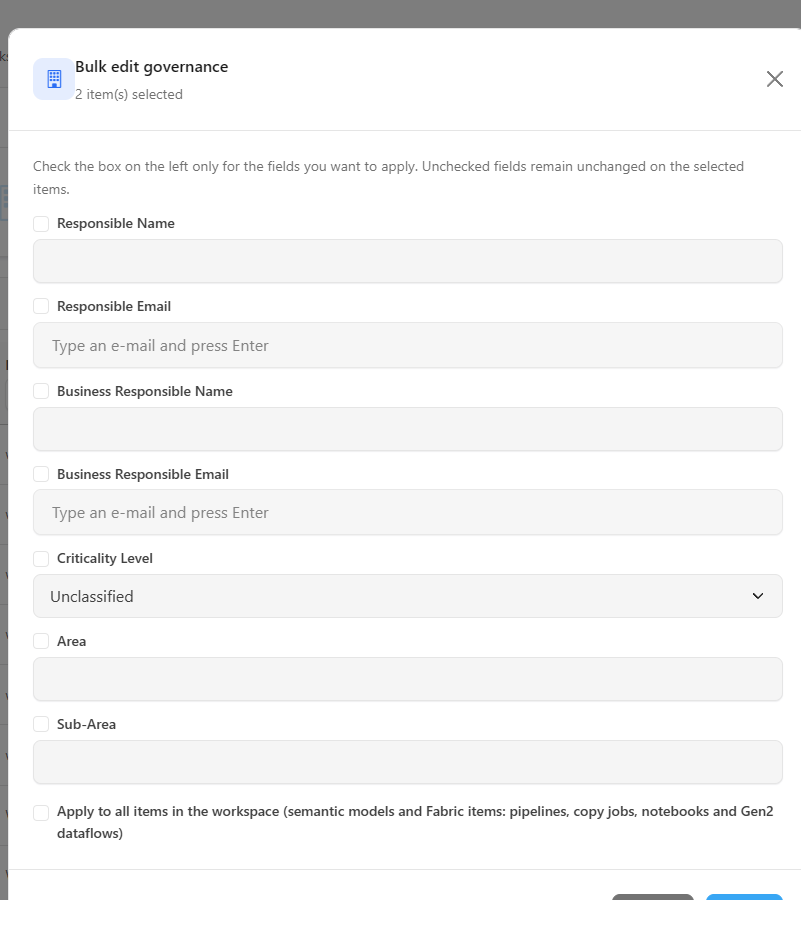
Click **Edit governance** on the bar. The **Bulk edit governance** modal shows how many items were selected.
{% endstep %}

{% step %}

#### Check only the fields to apply

Check the box to the left of each field you want to save (for example, *Criticality Level*) and fill in the value. Unchecked fields are locked and remain unchanged on each workspace. If you want to propagate the values to the semantic models and to the Fabric items that generate alerts (pipelines, copy jobs, notebooks and Gen2 dataflows), check **Apply to all items in the workspace**.
{% endstep %}

{% step %}

#### Save

Click **Save**. The message "Governance updated for *N* item(s)." confirms the save, the selection is cleared and the list is reloaded. If no field is checked, "Select at least one field to apply." appears and nothing is saved.
{% endstep %}
{% endstepper %}

<figure><picture><source srcset="/files/2KVLwEmPwTY4sOE3kDjj" media="(prefers-color-scheme: dark)"><img src="https://3938213054-files.gitbook.io/~/files/v0/b/gitbook-x-prod.appspot.com/o/spaces%2FH2bFRBmIfyK3kwVKbldl%2Fuploads%2Fgit-blob-ef9791c4f82e3e3129d111e290e9e26b3f49e16e%2Fpm-governanca-workspaces-editar-governanca-massa-en.png?alt=media" alt="Bulk edit governance modal with the field inclusion checkboxes and the selected items bar"></picture><figcaption><p>Bulk governance editing</p></figcaption></figure>

**How it works:** in bulk mode, each field gets a checkbox to the left of its name (*Include this field*): only the checked fields are saved. To undo the selection without editing, click **Clear selection** on the bar. The same bar has the **Change capacity** button (see below).

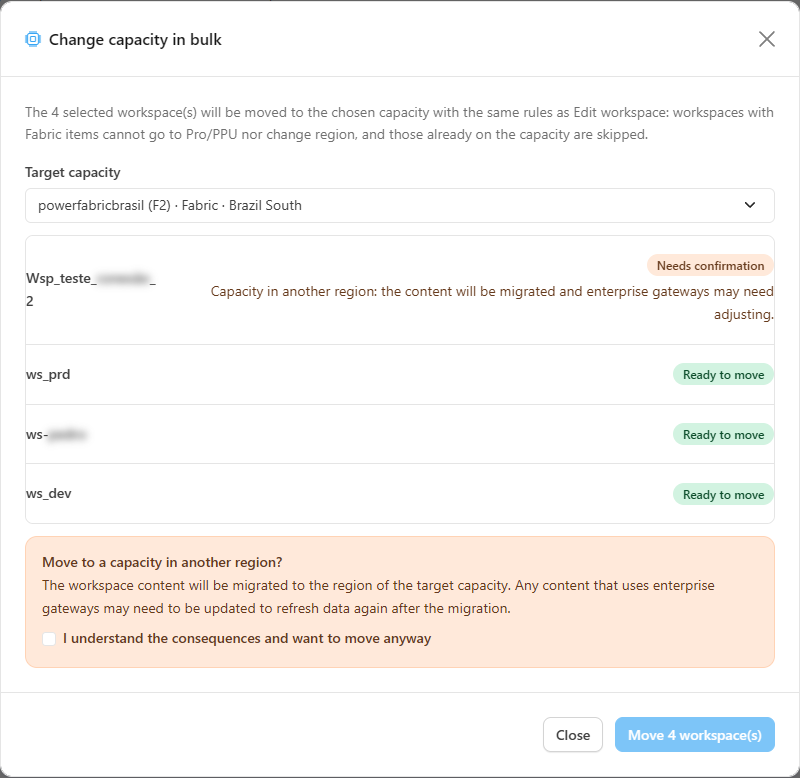
### Change capacity in bulk

**What it is:** the **Change capacity** button on the selection bar, which opens the **Change capacity in bulk** modal to move all the selected workspaces to the same capacity.

**What it is for:** reorganize capacities at once, for example to take all test workspaces off a production capacity or to empty a capacity before turning it off.

<figure><picture><source srcset="/files/VZm8QHfGsfpUhQTX3NaU" media="(prefers-color-scheme: dark)"><img src="https://3938213054-files.gitbook.io/~/files/v0/b/gitbook-x-prod.appspot.com/o/spaces%2FH2bFRBmIfyK3kwVKbldl%2Fuploads%2Fgit-blob-5fe708cec5606c93cf74fb8544422363d820bb15%2Fpm-governanca-workspaces-alterar-capacidade-massa-en.png?alt=media" alt="Change capacity in bulk modal with the Target capacity chosen and the list of workspaces with the Ready to move, Needs confirmation, Blocked and Already on this capacity statuses"></picture><figcaption><p>Change capacity in bulk modal</p></figcaption></figure>

{% hint style="info" %}
Requires the **Administrator** profile.
{% endhint %}

{% stepper %}
{% step %}

#### Select the workspaces

Check the workspaces in the table and click **Change capacity** on the "*N* item(s) selected" bar.
{% endstep %}

{% step %}

#### Choose the target

In **Target capacity**, choose the capacity (or **Pro workspace (shared)**) in the same selector, grouped by type and region, used when editing a workspace. The list below shows **Selected workspaces (*****N*****)**. While *Evaluating the workspaces...* is shown, Power Monitor checks, for each workspace, whether the change is possible.
{% endstep %}

{% step %}

#### Check the list

Each workspace gets a status (see the table below). Blocked ones show the reason and those that need confirmation show the notice right below.
{% endstep %}

{% step %}

#### Confirm, if needed

If any workspace needs confirmation, read the notices in the yellow box and check **I understand the consequences and want to move anyway**. When the target capacity is not turned on, the box also warns that the content will be unavailable until it is turned on; the same checkbox covers the region and turned-off capacity notices.
{% endstep %}

{% step %}

#### Move

Click **Move&#x20;*****N*****&#x20;workspace(s)**. The workspaces are moved one at a time; at the end, the message "Capacity changed: *X* moved, *Y* failed, *Z* skipped." summarizes the result and the list is reloaded.
{% endstep %}
{% endstepper %}

**How it works:**

| Status                            | Meaning                                                                                                                         |
| --------------------------------- | ------------------------------------------------------------------------------------------------------------------------------- |
| **Ready to move**                 | The change is allowed and does not need confirmation.                                                                           |
| **Needs confirmation**            | The change is allowed, but takes the workspace to another region or out of the capacity. It requires the confirmation checkbox. |
| **Blocked**                       | The workspace has Fabric items and the target is in another region or is Pro/PPU. It is not moved.                              |
| **Already on this capacity**      | The workspace is already on the target and is skipped.                                                                          |
| **Moving**, **Moved**, **Failed** | Progress of each workspace during the run.                                                                                      |

* The rules are the same as in [Workspace management](#workspace-management): each workspace is evaluated individually.
* If no selected workspace can go to the target, "None of the selected workspaces can be moved to this capacity." appears and the move button is disabled.
* Each change is recorded on the workspace's [History](#workspace-details-history) tab.

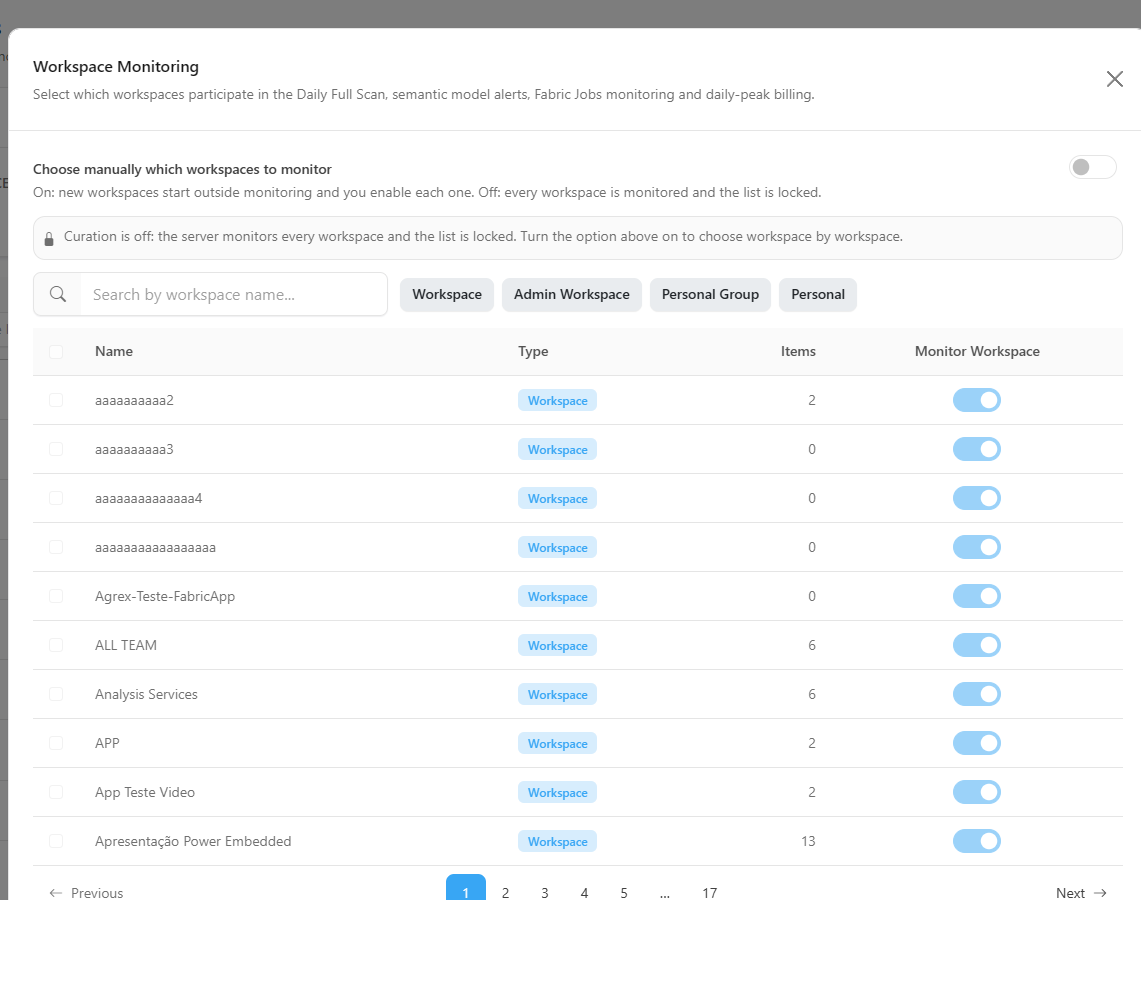
### Workspace Monitoring

**What it is:** the modal opened by the **Workspace Monitoring** button, at the top of the screen, in which the Administrator chooses which workspaces participate in the **Daily Full Scan**, **semantic model alerts**, **Fabric Jobs monitoring** and **daily-peak billing**.

**What it is for:** limit Power Monitor to the workspaces that matter (production, critical areas) and, with that, control the volume of alerts and the billing item count.

<figure><picture><source srcset="/files/ebZHammCqPNr6YsF4eFP" media="(prefers-color-scheme: dark)"><img src="https://3938213054-files.gitbook.io/~/files/v0/b/gitbook-x-prod.appspot.com/o/spaces%2FH2bFRBmIfyK3kwVKbldl%2Fuploads%2Fgit-blob-89123d104af8baef14abd7221ea704d0b33b3caa%2Fpm-governanca-workspaces-modal-monitoramento-en.png?alt=media" alt="Workspace Monitoring modal with the curation toggle, type filters and the workspace list with the Monitor Workspace switch"></picture><figcaption><p>Workspace Monitoring modal</p></figcaption></figure>

**How to use:**

{% hint style="info" %}
Requires the **Administrator** profile.
{% endhint %}

{% stepper %}
{% step %}

#### Open the modal

Click **Workspace Monitoring** at the top of the screen. The modal syncs the list with Fabric when it opens (the message "Loading workspaces..." appears in the meantime).
{% endstep %}

{% step %}

#### Confirm the curation

Check whether the **Choose manually which workspaces to monitor** toggle is on. If it is off, the list is locked and all workspaces are monitored (see [Manual curation](#manual-curation)).
{% endstep %}

{% step %}

#### Locate the workspaces

Type in the **Search by workspace name...** search and, if you want, click the type buttons (**Workspace**, **Admin Workspace**, **Personal Group**, **Personal**) to narrow the list.
{% endstep %}

{% step %}

#### Enable or disable

Turn on the row's **Monitor Workspace** switch to enable it; the message "Monitoring enabled for 1 workspace(s)." confirms. To disable, turn off the switch, read the warning of the **Disable monitoring** confirmation and click **Disable** (or **Cancel**). For several workspaces at once, see [Bulk enable and disable](#bulk-enable-and-disable).
{% endstep %}

{% step %}

#### Wait for the next scan

Click **Close**. The enabled workspaces start being scanned in the next cycle, and the billing item count is updated in the next daily snapshot. The table's **Monitored** column reflects the change.
{% endstep %}
{% endstepper %}

**How it works:**

* When it opens, the modal syncs the list with the Fabric Admin API to discover new workspaces. If that is not possible (for example, without Power BI access consent), it shows the list already known to Power Monitor.
* List columns: **Name**, **Type**, **Items** (number of artifacts) and **Monitor Workspace** (switch). Personal workspaces do not appear. The list is paginated (10 per page by default) and has the same **Items per page** selector.
* Effects of an **unmonitored** workspace:
  * It **remains listed** on the Workspaces screen (with *Monitored = No*, visible with the *All* or *Not monitored* filter).
  * Its artifacts **no longer appear** on the other Governance inventory screens (Reports, Semantic Models, Storage etc.).
  * Its items **are not included in the billing count** from the next daily snapshot onward. Snapshots already recorded are not recalculated.

### Manual curation

**What it is:** the **Choose manually which workspaces to monitor** toggle, at the top of the **Workspace Monitoring** modal. It is the master switch that decides whether new workspaces start inside or outside monitoring.

**What it is for:** in large tenants, turning curation on prevents each new workspace created by a user from automatically entering monitoring (and billing); in small tenants, turning it off ensures nothing is left out.

**How to use:**

{% hint style="info" %}
Requires the **Administrator** profile.
{% endhint %}

1. Click **Workspace Monitoring**.
2. Click the **Choose manually which workspaces to monitor** toggle. The change is saved immediately, without confirmation, and the list is reloaded.
3. The message "Workspace curation updated." confirms the save.

If the toggle position cannot be loaded, the modal shows "Could not load this setting." with the **Try again** button.

**How it works:**

| Position | New workspace                                       | Workspace list                                                        |
| -------- | --------------------------------------------------- | --------------------------------------------------------------------- |
| **On**   | Starts **outside** monitoring; you enable each one. | Editable: you turn each workspace on and off.                         |
| **Off**  | Starts monitored.                                   | **Locked**: all workspaces are monitored. A notice explains the lock. |

When you turn the toggle **off**, all workspaces become monitored, and Power Monitor remembers which ones were out. When you turn it **back on**, those same workspaces go back to being outside monitoring; workspaces discovered while the toggle was off remain monitored.

{% hint style="warning" %}
The choice made in the installation wizard defines the initial position: **Scan Everything** leaves curation off (everything monitored); **Select Workspaces** leaves curation on. When you run a manual or scheduled scan selecting specific workspaces, the new workspaces it discovers start monitored, because you chose them explicitly.
{% endhint %}

### Bulk enable and disable

**What it is:** selecting several workspaces in the **Workspace Monitoring** modal and the "*N* workspace(s) selected" bar, with the **Enable Monitoring**, **Disable Monitoring** and **Clear selection** buttons.

**What it is for:** include or remove from scope, at once, a group of workspaces: for example, all test workspaces found by the search.

**How to use:**

1. In the **Workspace Monitoring** modal, check the box to the left of each workspace (or the header box, to check all on the page).
2. On the "*N* workspace(s) selected" bar, click **Enable Monitoring**. The message "Monitoring enabled for *N* workspace(s)." confirms.
3. To remove from monitoring, click **Disable Monitoring**. In the **Disable monitoring** confirmation, which shows how many workspaces were selected, read the warning and click **Disable** (or **Cancel**). The message "Monitoring disabled for *N* workspace(s)." confirms.

**How it works:** enabling does not ask for confirmation; **disabling always does**. The warning reminds you that the workspace will no longer be scanned in the Daily Full Scan, will not send semantic model failure alerts, will not have Fabric Jobs monitored and that the change will be reflected in the count of the next daily billing scans. With curation off, the checkboxes and switches are locked.

### Add Service Principal

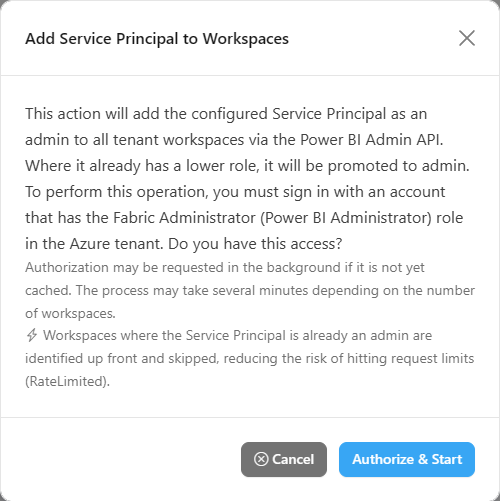
**What it is:** the **Add Service Principal** button, at the top of the screen, which makes the Service Principal configured in Power Monitor an **administrator** of all the tenant's workspaces, through the Power BI Admin API (where it already had a lesser role, it is promoted).

**What it is for:** enable reading of resources that the Admin API does not cover (such as model size via XMLA, the SQL endpoint in [Performance Analysis](/en/power-monitor/governanca/armazenamento/analise-de-performance-sql.md) and some schedule data) without having to add the Service Principal workspace by workspace.

<figure><picture><source srcset="/files/Ym3AzoEW8fyAMAemhE3E" media="(prefers-color-scheme: dark)"><img src="https://3938213054-files.gitbook.io/~/files/v0/b/gitbook-x-prod.appspot.com/o/spaces%2FH2bFRBmIfyK3kwVKbldl%2Fuploads%2Fgit-blob-47cdba9f93087746de6031e0d3fdcd7893941755%2Fpm-governanca-workspaces-adicionar-service-principal-en.png?alt=media" alt="Add Service Principal to Workspaces modal with the explanation of the operation and the Authorize &#x26; Start button"></picture><figcaption><p>Add Service Principal to Workspaces modal</p></figcaption></figure>

**How to use:**

{% hint style="info" %}
Requires the **Administrator** profile in Power Monitor and sign-in with an account that has the **Fabric Administrator** (Power BI Administrator) role in the tenant.
{% endhint %}

{% stepper %}
{% step %}

#### Open the modal

Click **Add Service Principal** at the top of the screen. The **Add Service Principal to Workspaces** modal explains what will be done and warns that the workspaces where the Service Principal is already an administrator are identified up front and skipped.
{% endstep %}

{% step %}

#### Authorize

Click **Authorize & Start**. If the authorization is not yet cached, the browser may ask you to sign in with the Fabric Administrator account.
{% endstep %}

{% step %}

#### Follow the progress

The modal shows how many workspaces were processed, added or promoted, how many already had the Service Principal as administrator (with how many of them were **checked up front**, with no API call) and how many failed. The process can take a few minutes; you can click **Close (continues in background)**.
{% endstep %}

{% step %}

#### Check the result

At the end, "Process completed successfully!" or "Process completed with failures." appears, with the summary. In case of error, use **Try again**.
{% endstep %}
{% endstepper %}

**How it works:** the process runs on the server, workspace by workspace. Before starting, Power Monitor identifies the workspaces where the Service Principal **is already an administrator** and skips them, which reduces the risk of hitting the API request limit (*RateLimited*); the final summary reports how many were checked up front. Failures usually indicate that the tenant does not allow Service Principals to use the Power BI Admin APIs. If no processing is found after 30 seconds, the modal asks you to check whether the authorization was completed and try again.

### Download all reports

**What it is:** the **Download all reports** action in the **⋮** menu, which downloads all the workspace's reports (`.pbix` and, for paginated reports, `.rdl`).

**What it is for:** make a quick backup of a workspace before a migration, reorganization or deletion.

**How to use:**

1. In the workspace row's **⋮** menu, click **Download all reports**. If the browser asks, allow the download of multiple files.
2. Follow the notice "Downloading *N* reports (3 at a time)..."; meanwhile, the row's **⋮** button shows a loading indicator.
3. At the end, the message "*N* reports downloaded." (or "*X* reports downloaded, *Y* failed.") reports the result. If the workspace has no reports, "This workspace has no reports to download." appears.

**How it works:** the files are obtained from Power BI three at a time. It is available to all profiles. Reports that Power BI does not allow to be downloaded, or that were removed after the last scan, are counted as failures.

### Open in Power BI

**What it is:** the **Open in Power BI** action in the **⋮** menu.

**What it is for:** go from the inventory straight to the workspace in the portal to act on it (manage access, move items, change settings).

**How to use:**

1. In the workspace row's **⋮** menu, click **Open in Power BI**.
2. The workspace opens in Power BI in a new browser tab.

**How it works:** you need access to the workspace in Power BI to view it.

## Rules and behavior

* **Data source:** the list comes from the inventory scans (Fabric/Power BI Admin API). See [Inventory Scan](/en/power-monitor/mapeamento/inventarios.md).
* **Workspaces deleted in Power BI** are not erased from Power Monitor: they receive the **Deleted** state, preserving the history. Use the *State* filter to see them.
* **Types:** the screen lists shared workspaces (*Workspace*) and *Admin Workspace*.
* **Personal workspaces out of the system:** personal workspaces (*My workspace*) do not appear on any Power Monitor screen: selectors, lists, dashboards, consumption screens and alerts. Their consumption is still added to the capacity totals and, on the screens that must match the cost, appears grouped as **Workspaces pessoais e fora do inventário**. Personal workspaces that were monitored had their monitoring turned off and no longer generate health checks or alerts.
* **User scope:** users with restricted visibility see only the workspaces granted to them.
* **Governance Dashboard link:** the inactive workspaces card of the [Governance Dashboard](/en/power-monitor/dashboards/dashboard-de-governanca.md) opens this screen already filtered by the workspaces with no activity in the last 30 days.
* **Permissions:** governance editing, the monitoring modal, the Service Principal button, the deviation switch and all workspace management (name, description, capacity, access and the **History** tab) are refused by the server for anyone who is not an Administrator. For these profiles, the top buttons, the checkboxes, the **Edit governance** item and the **History** tab do not appear, and the deviation switch, the **Edit** button of the **Workspace management** card and the **Add access** button appear disabled.
* **Management directly in Fabric:** name, description, capacity and access are changed in Fabric right away, by the Power Monitor Service Principal. Workspaces that are not active in Fabric cannot be changed. Each change, successful or failed, is recorded on the workspace's **History** tab.
* **Capacity and Fabric items:** a workspace with Fabric items cannot change region or go to Pro or PPU; changes to another region, to a capacity that is turned off or out of the capacity ask for confirmation. The rule applies both to the individual change and to the bulk change.
* **Workspace X-Ray:** the same details modal, opened from the [Workspace X-Ray](/en/power-monitor/qualidade-de-dados/raio-x-de-workspace.md) screen, remains read-only. Management exists only on this screen.
* **Filters applied automatically:** any filter change reloads the list after a short pause and returns to the first page.

## Frequently asked questions

<details>

<summary>I created a workspace in Power BI and it does not appear in the list.</summary>

Check the **Monitored** filter: with curation on, new workspaces start **outside** monitoring and the list shows, by default, only the monitored ones: change the filter to *All*. If it still does not appear, wait for the next inventory scan or open the **Workspace Monitoring** modal, which syncs the list with Fabric when it opens.

</details>

<details>

<summary>Does disabling monitoring of a workspace reduce the invoice amount?</summary>

The items of unmonitored workspaces are no longer included in the monitored item count from the next daily billing snapshot onward. Days already recorded are not recalculated. See the Billing page to understand how the daily average defines the invoice tier.

</details>

<details>

<summary>Why can't I change the switches in the monitoring modal?</summary>

The **Choose manually which workspaces to monitor** toggle is off: in this mode all workspaces are monitored and the list is locked. Turn the toggle on to choose workspace by workspace.

</details>

<details>

<summary>Why does the Size of some workspaces appear as "—" or "Not collected"?</summary>

"—" indicates a workspace without dedicated capacity (size via XMLA only exists on Fabric, Power BI Embedded, Premium or PPU). "Not collected" indicates that no model in the workspace has been measured yet: usually because the Service Principal is not a member of the workspace. Use **Add Service Principal** to fix it.

</details>

<details>

<summary>Why do some capacities appear disabled when editing the workspace?</summary>

The workspace has Fabric items (lakehouses, notebooks, pipelines and any item that is not a report, paginated report, semantic model or dashboard). These items cannot change region or go to Pro or PPU, so capacities in another region, the **Pro workspace (shared)** option and PPU capacities are blocked, with the reason in the option text. To unlock the change, move or remove the Fabric items first.

</details>

<details>

<summary>Why can't I change or remove an access marked as "Protected"?</summary>

Power Monitor protects its own Service Principal (removing it would stop scanning and management), the workspace's last admin and the groups through which the Service Principal may be accessing the workspace. Hover over the **Protected** badge to see the reason. For the last admin, add another admin first; for the group, grant Admin directly to the Service Principal.

</details>

<details>

<summary>I changed a workspace's name or capacity in Fabric. Does it appear in the History?</summary>

No. The **History** tab records only changes made by Power Monitor. The **Workspace management** card and the **Users & Permissions** tab query Fabric when they open, so they show the current state; the screen's list is updated on the next inventory scan.

</details>

<details>

<summary>"Download all reports" downloaded only some of the files.</summary>

The final message reports how many reports failed. Failures happen when Power BI does not allow a specific report to be downloaded or when it was removed after the last scan. Also check whether the browser blocked multiple downloads.

</details>

## Related pages

* [Governance Dashboard](/en/power-monitor/dashboards/dashboard-de-governanca.md)
* [Semantic Models](/en/power-monitor/governanca/modelos-semanticos.md)
* [Reports](/en/power-monitor/governanca/relatorios.md)
* [Capacities](/en/power-monitor/governanca/infraestrutura/capacidades.md)
* [Average Execution Time](/en/power-monitor/performance/tempo-medio-de-execucao.md)
* [Inventory Scan](/en/power-monitor/mapeamento/inventarios.md)
* [Users](/en/power-monitor/usuarios.md)


---

# Agent Instructions
This documentation is published with GitBook. GitBook is the documentation platform designed so that both humans and AI agents can read, navigate, and reason over technical content effectively. Learn more at gitbook.com.

## Querying This Documentation
If you need additional information that is not directly available in this page, you can query the documentation by asking a question.

Perform an HTTP GET request on the following URL with the `ask` and `goal` query parameters:

```
GET https://docs.powermonitor.com.br/en/power-monitor/governanca/workspaces.md?ask=<question>&goal=<user_goal>
```

`ask` is the immediate question: it should be specific, self-contained, and written in natural language.
`goal` is what the user is ultimately trying to achieve, the reason they need the answer. Sharing it helps GitBook give you a better, more relevant answer. A goal is most helpful when it describes the outcome the user wants rather than restating the question. For example, with `ask=how do I create an API token`, a goal like `automate deployments from our CI pipeline` lets GitBook tailor the answer to that use case.

The response will contain a direct answer to the question and relevant excerpts and sources from the documentation.

Use this mechanism when the answer is not explicitly present in the current page, you need clarification or additional context, or you want to retrieve related documentation sections.