> For the complete documentation index, see [llms.txt](https://docs.powermonitor.com.br/llms.txt). Markdown versions of documentation pages are available by appending `.md` to page URLs; this page is available as [Markdown](https://docs.powermonitor.com.br/en/power-monitor/interface-e-navegacao.md).

# Interface and navigation

How to find your way around Power Monitor, with the two-level menu, Favorites, page search, top-of-page actions, theme, language, notices, exports, error screens and use on mobile.

This page explains the elements common to all Power Monitor screens: the two-level side menu, Favorites and page search, the buttons at the top of the page (help, what's new, settings, theme, language, installation on mobile), the notices that may appear at the top, dashboard exports, error screens and how the system behaves on mobile.

<figure><picture><source srcset="/files/EnqR08tiKzIViSgBlame" media="(prefers-color-scheme: dark)"><img src="https://3938213054-files.gitbook.io/~/files/v0/b/gitbook-x-prod.appspot.com/o/spaces%2FH2bFRBmIfyK3kwVKbldl%2Fuploads%2Fgit-blob-a912011835dc8979c76c4fffa3bed4bf9301c3db%2Fpm-interface-visao-geral-menus-en.png?alt=media" alt="Power Monitor screen with the domains menu, the search field, the module menu and the top actions"></picture><figcaption><p>Interface elements</p></figcaption></figure>

## What it is for

* **Find any screen** quickly through the two-level menu, the page search or your Favorites.
* **Adjust the interface** to the way you work: theme, language and collapsed menu.
* **Understand the notices and locks** that may appear (trial, payment, app credential, error screens).
* **Use Power Monitor on mobile** and install it as an app.

## Features

### Main menu (domains)

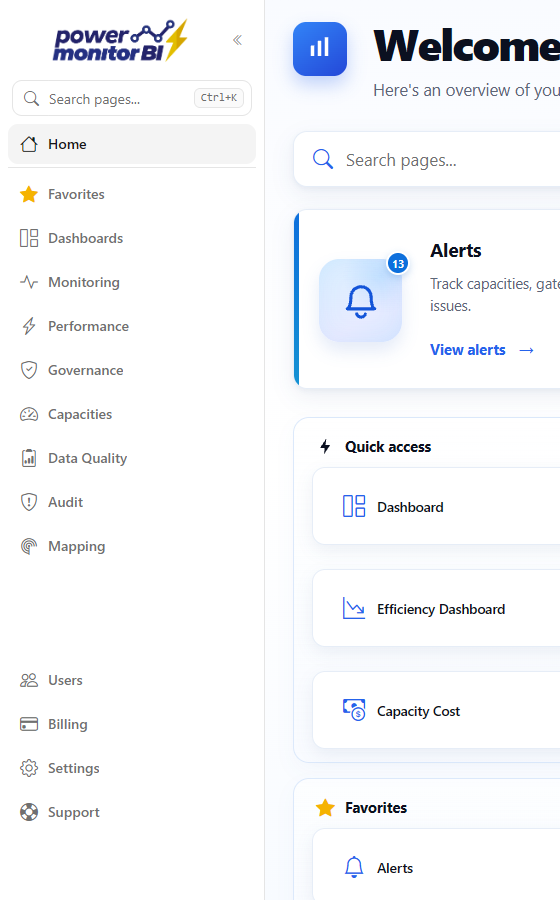
**What it is:** the leftmost column of the side menu, with the **Home** button, the **Favorites** menu (when you have favorites), the product domains and, in the footer, the utilities and your user.

**What it is for:** switch work areas (monitor, govern, audit etc.) with one click, from any screen.

<figure><picture><source srcset="/files/WbFq1JWNuiQMAMIoHNEm" media="(prefers-color-scheme: dark)"><img src="https://3938213054-files.gitbook.io/~/files/v0/b/gitbook-x-prod.appspot.com/o/spaces%2FH2bFRBmIfyK3kwVKbldl%2Fuploads%2Fgit-blob-226e642ce6b53243489d8e76d1c79dc41e0104d5%2Fpm-interface-menu-principal-expandido-en.png?alt=media" alt="Main menu expanded with the search field, Home, Favorites and the domain names"></picture><figcaption><p>Main menu with the domain names</p></figcaption></figure>

The domains appear in this order:

| Domain                            | Screens                                                                                                                                                                                                                                                                                                                                                                                                                                                                                                                                                                                                                                                                                                                                                                                              |
| --------------------------------- | ---------------------------------------------------------------------------------------------------------------------------------------------------------------------------------------------------------------------------------------------------------------------------------------------------------------------------------------------------------------------------------------------------------------------------------------------------------------------------------------------------------------------------------------------------------------------------------------------------------------------------------------------------------------------------------------------------------------------------------------------------------------------------------------------------- |
| **Home**                          | The [Home](/en/power-monitor/pagina-inicial.md) screen, the first one shown after sign-in.                                                                                                                                                                                                                                                                                                                                                                                                                                                                                                                                                                                                                                                                                                           |
| **Favorites**                     | Your favorite screens, in the order you defined. It only appears when there is at least one favorite that you can open. See [Favorites and page search](/en/power-monitor/favoritos-e-busca.md).                                                                                                                                                                                                                                                                                                                                                                                                                                                                                                                                                                                                     |
| **Dashboards**                    | Dashboard, Governance Dashboard, Capacity Dashboard, Capacity Overview, Efficiency Dashboard, Monitoring Dashboard, Report Access Dashboard, Permissions Dashboard, Capacity Cost and Artifact Refreshes.                                                                                                                                                                                                                                                                                                                                                                                                                                                                                                                                                                                            |
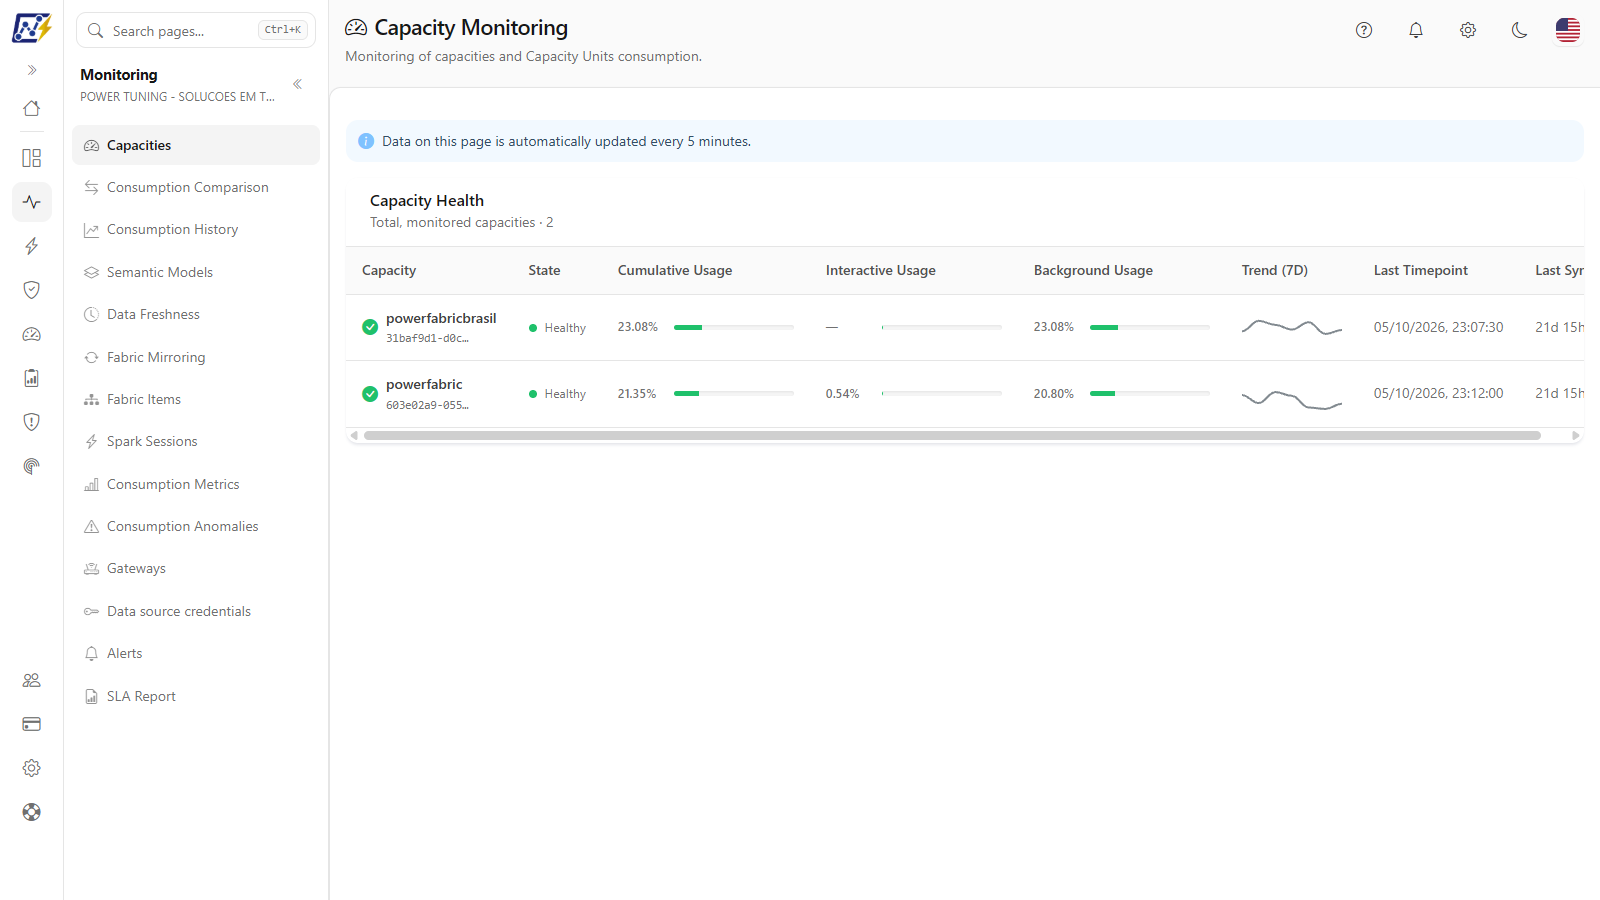
| **Monitoring**                    | Capacities, Consumption Comparison, Consumption History, Semantic Models, Data Freshness, Fabric Mirroring, Fabric Items, Spark Sessions, Consumption Metrics, Consumption Anomalies, Gateways, Data source credentials, Alerts and SLA Report (Administrators only).                                                                                                                                                                                                                                                                                                                                                                                                                                                                                                                                |
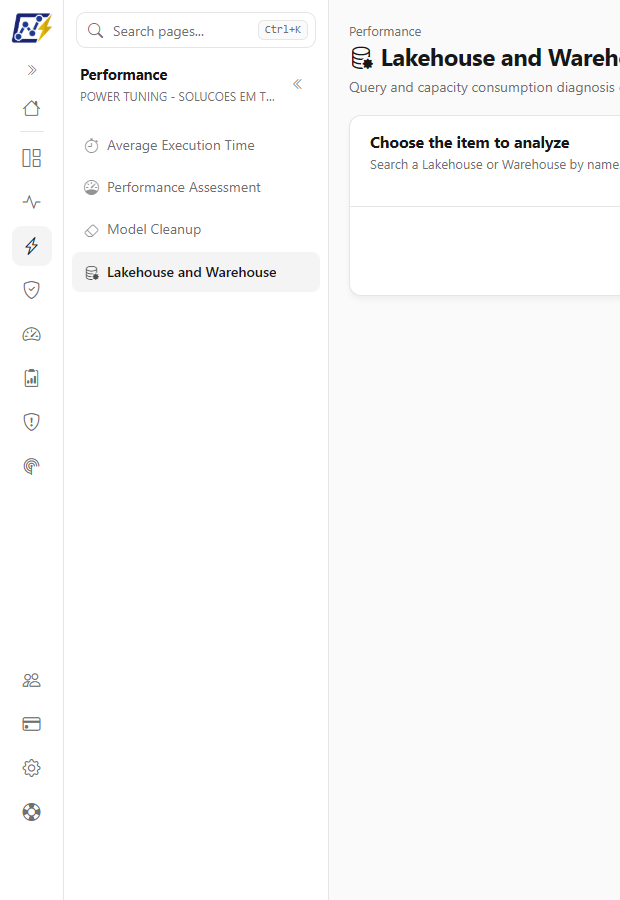
| **Performance**                   | Average Execution Time, Performance Assessment, Model Cleanup and Lakehouse and Warehouse.                                                                                                                                                                                                                                                                                                                                                                                                                                                                                                                                                                                                                                                                                                           |
| **Governance**                    | Workspaces, Semantic Models and Storage; **Reports** group (Reports, Paginated Reports, Dashboards, KQL Dashboards, Apps, Explorations, Metric Sets); **Data and Engineering** group (Fabric Mirroring, Data Engineering, Data Science, Development, Real Time); **Infrastructure** group (Capacities, Gateways, Connections, Azure Quotas); **Operations** group (Schedules, Deployment Pipelines, Deployment history, Model History, Workspace Git, Deleted Artifacts); **Compliance** group (Public Links, Organization-wide Links, Labels and Certification, Naming conventions, Personal data discovery, Privacy risks, Compliance posture, Departed Owners (Administrators only) and Access reviews); **Tenant** group (Tenant Settings, Power BI Licenses (Administrators only) and Domains). |
| **Capacities**                    | A shortcut that brings together, in one place, the capacity screens that also exist in other domains: Capacity Dashboard, Capacity Overview, Capacity Cost, Capacity Monitoring, Consumption Comparison, Consumption History, Consumption Metrics, Consumption Anomalies, Capacity Governance, Capacity Actions and (Administrators only) Capacity Scan and Capacity Cost Scan.                                                                                                                                                                                                                                                                                                                                                                                                                      |
| **Data Quality**                  | Data Lineage, Environment X-Ray (Administrators only), Data Dictionary, Best Practices Score, Report Best Practices Score, AI Score, Environment Inventory, Workspace X-Ray and Data Exposure.                                                                                                                                                                                                                                                                                                                                                                                                                                                                                                                                                                                                       |
| **Audit**                         | Events Overview, Report Views, Permissions Audit, Permission history, Behavioral risk (Administrators only), Service Principals, Row-Level Security, Direct Sharing, E-mail Subscriptions, Application Events, Email Audit and Capacity Actions.                                                                                                                                                                                                                                                                                                                                                                                                                                                                                                                                                     |
| **Mapping** (Administrators only) | Scan Logs; **Inventory** group (Inventory, Capacities, Gateways, Apps, Domains, Group Members); **Models and reports** group (Model Mapping, Model Size, Report Structure); **Capacity and cost** group (Capacity Cost, Capacity Metrics, Consumption Metrics, Azure Quotas); **Audit and compliance** group (Audit, E-mail Subscriptions, Tenant Settings, Power BI Licenses); **Operations** group (Refreshes and Schedules, Workspace Git, Deployment operations, Spark Sessions).                                                                                                                                                                                                                                                                                                                |

{% hint style="info" %}
**Performance** brings together the performance screens that used to be scattered: Average Execution Time and Performance Assessment (previously in Monitoring) and Model Cleanup (previously in Data Quality). The **Environment X-Ray**, an environment health dashboard, is in **Data Quality**, and the list that used to have that name is now called **Environment Inventory**. **Artifact Refreshes**, which was in Monitoring, moved to **Dashboards**.
{% endhint %}

**Menu footer (utilities):** [Users](/en/power-monitor/usuarios.md), [Billing](/en/power-monitor/faturamento.md) and [Settings](/en/power-monitor/configuracoes.md) (all three for Administrators only) and [Support](/en/power-monitor/suporte.md) (everyone). Below them is your user (name and email).

**How to use:** click the domain icon. The main menu then shows only the icons and the module menu opens next to it. Click **Home** or the logo to return to the **Home** screen.

**How it works:**

* From top to bottom, the main menu has the logo and the expand/collapse button, the search field (see [Favorites and page search](/en/power-monitor/favoritos-e-busca.md)), **Home**, **Favorites** (when there are favorites), the domains and, in the footer, the utilities and your user.
* While the main menu is expanded, the module menu is hidden: when you choose a domain, the main menu goes back to showing only the icons and the module menu takes its place. On computers, the double-arrow button next to the logo (**Expand main menu** / **Collapse main menu**) switches between the two formats; on phones and tablets the whole menu opens as a drawer.
* With the menu in icons only, the domain name appears in a tooltip when you hover over it.
* The footer utilities and the Administrator-only domains appear only for people with that profile. A domain whose screens were all locked for your user does not appear.

### Module menu

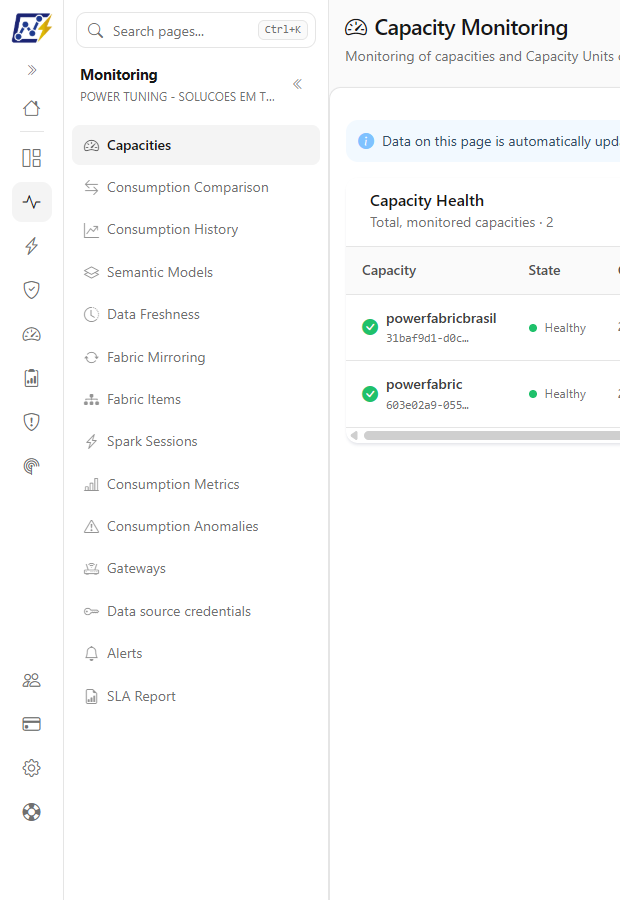
**What it is:** the list of screens of the chosen domain, opened next to the main menu. At the top are the page search field, the domain name and the name of your organization. In **Governance** and **Mapping**, the screens are organized in collapsible groups: in **Governance**, below Workspaces, Semantic Models and Storage, come **Reports**, **Data and Engineering**, **Infrastructure**, **Operations**, **Compliance** and **Tenant**; in **Mapping**, below Scan Logs, come **Inventory**, **Models and reports**, **Capacity and cost**, **Audit and compliance** and **Operations**. The group of the screen currently open is already expanded, and a group with no screen you can open is not shown.

**What it is for:** reach the right screen within the area.

<figure><picture><source srcset="/files/jnsnejxtHFFKIm4kXQ0x" media="(prefers-color-scheme: dark)"><img src="https://3938213054-files.gitbook.io/~/files/v0/b/gitbook-x-prod.appspot.com/o/spaces%2FH2bFRBmIfyK3kwVKbldl%2Fuploads%2Fgit-blob-1325f94501edc77242dd1074eec717a67c2cf68f%2Fpm-monitoramento-menu-lateral-en.png?alt=media" alt="Main menu collapsed into icons with the Monitoring module menu open"></picture><figcaption><p>Main menu and module menu</p></figcaption></figure>

<figure><picture><source srcset="/files/X1e79fRHkXZm9xKPqU6u" media="(prefers-color-scheme: dark)"><img src="https://3938213054-files.gitbook.io/~/files/v0/b/gitbook-x-prod.appspot.com/o/spaces%2FH2bFRBmIfyK3kwVKbldl%2Fuploads%2Fgit-blob-6aab8fd634ea0f4e99a8935314a0fcc6715b2151%2Fpm-interface-menu-performance-en.png?alt=media" alt="Performance module menu open with the four screens of the domain"></picture><figcaption><p>Performance module menu</p></figcaption></figure>

Next to the name of each screen there is a **star**, which marks the screen as a favorite (see [Favorites and page search](/en/power-monitor/favoritos-e-busca.md)).

**How to use:**

{% stepper %}
{% step %}

### Choose the domain

In the main menu, click the domain icon, for example **Monitoring**.
{% endstep %}

{% step %}

### Choose the screen

In the module menu, click the name of the screen, for example **Alerts**. In **Governance** and **Mapping**, first click the name of the group (for example, **Infrastructure**) to open its list of screens.
{% endstep %}

{% step %}

### Switch domains whenever you want

Click another icon in the main menu to see the screens of that domain. The open screen does not change until you choose a new screen.
{% endstep %}
{% endstepper %}

### Collapse and expand the menu

**What it is:** the three states of the side menu and the buttons that switch between them.

| State      | What it looks like                                                                 | When                                                        |
| ---------- | ---------------------------------------------------------------------------------- | ----------------------------------------------------------- |
| **Launch** | Wide main menu, with the domain names; no module menu.                             | On the **Home** screen and when clicking **Home**/the logo. |
| **Work**   | Main menu with icons only + module menu open.                                      | When choosing a domain or opening a module screen directly. |
| **Focus**  | Main menu with icons only and module menu collapsed, freeing space for the screen. | **Collapse menu** button of the module menu.                |

**What it is for:** gain space for wide tables and dashboards, or see the domain names while you are still getting familiar with the product.

**How to use:**

1. To free up space, click **Collapse menu** (at the top of the module menu). The module menu disappears (**Focus** state).
2. To reopen it, click the icon of any domain in the main menu.
3. To see the domain names, click **Expand main menu**; to go back to icons only, click **Collapse main menu**.

**How it works:** the **Focus** state is remembered in this browser on your next visit; the others follow the open screen.

### What each person sees in the menu

**What it is:** the menu is built according to the user's profile and locks.

**What it is for:** understand why a colleague sees screens you do not see (or vice versa).

**How it works:**

* Items and domains marked as "Administrators only" do not appear for those with the **User** role. Not every restricted screen is marked that way: the **Report Access Dashboard** and the **Permissions Dashboard**, for example, are no longer Administrator-only, and who sees them is defined by the page access of each user's profile.
* Once the organization customizes page access (creates or edits profiles, or edits a user's locks), the menu follows only the page locks: the "Administrators only" mark no longer hides items in the menu. Write actions and screens with personal or individual-usage data (such as Power BI Licenses, SLA Report and Behavioral risk) are still refused by the server to anyone who is not an Administrator.
* Pages locked for the user in [Users › Page access](/en/power-monitor/usuarios.md#page-access) disappear from the menu (and direct access by URL leads to the **Not allowed** screen). If all pages of a domain are locked, the domain disappears. The lock also applies to data: queries from the locked screen are refused by the server, and an administrator is never locked.
* The user's **workspace scope** does not change the menu, but it filters the data displayed on all screens.
* The **page search**, the **Favorites** and the shortcuts on the [Home page](/en/power-monitor/pagina-inicial.md) follow the same rule: they only show screens you can open.

### Favorites and page search

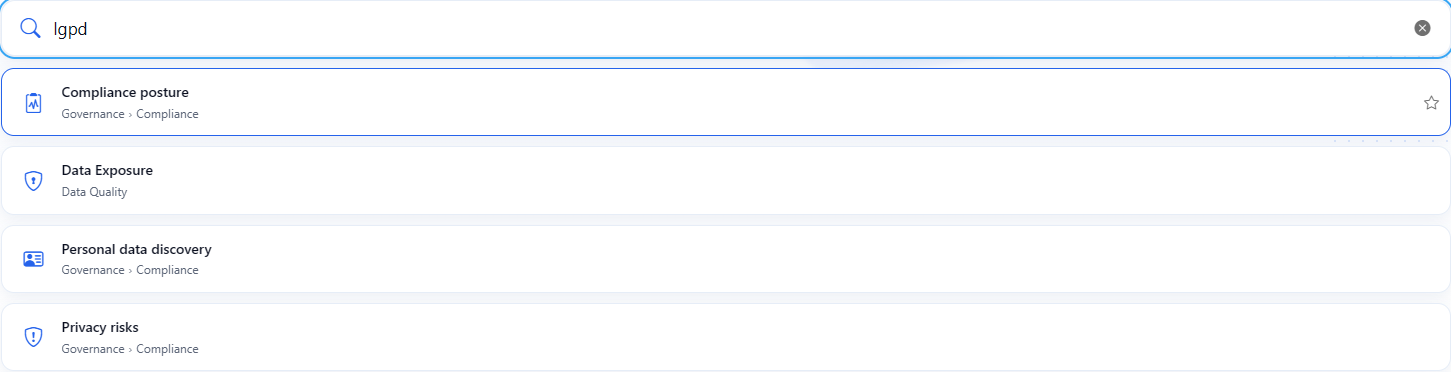
**What it is:** the **star** next to the name of each menu screen, the **Favorites** menu and the **Search pages...** field, which also opens with **Ctrl+K** (**⌘K** on a Mac) or with the slash (**/**).

**What it is for:** reach the screens you use most without navigating domain by domain, and find a screen by name or by topic (for example, "lgpd") without knowing where it is.

<figure><picture><source srcset="/files/6jbe5eDqxyCzOZy9OzLp" media="(prefers-color-scheme: dark)"><img src="https://3938213054-files.gitbook.io/~/files/v0/b/gitbook-x-prod.appspot.com/o/spaces%2FH2bFRBmIfyK3kwVKbldl%2Fuploads%2Fgit-blob-023a8a3277584cf18f2d6ff533741d0b180195c6%2Fpm-interface-busca-paginas-en.png?alt=media" alt="Search pages field with the word lgpd typed and the list of screens found"></picture><figcaption><p>Page search</p></figcaption></figure>

**How to use:** press **Ctrl+K**, type part of the name and choose the result (click, or **↑**/**↓** and **Enter**). To favorite, click the star of a screen. The details (limit of 50 favorites, order, **Manage favorites** page, search rules) are in [Favorites and page search](/en/power-monitor/favoritos-e-busca.md).

### Top-of-page actions

**What it is:** the icons in the upper right corner of each screen, in this order, from left to right:

| Icon                                   | Function                                                                                                 |
| -------------------------------------- | -------------------------------------------------------------------------------------------------------- |
| Phone (**Install on phone**)           | Appears only on phones and tablets; opens the instructions to install Power Monitor as an app.           |
| Question mark (**Help**)               | Opens, in a new tab, the page of this documentation that explains the current screen. See [Help](#help). |
| Bell (**What's new in Power Monitor**) | Opens, in a new tab, the changelog with the news of each version. See [What's new](#whats-new).          |
| Gear                                   | Shortcut to [Settings](/en/power-monitor/configuracoes.md) (Administrators only).                        |
| Sun / moon                             | Switches between **light** and **dark** theme.                                                           |
| Flag                                   | Changes the language.                                                                                    |

<figure><picture><source srcset="/files/PauV7vYcqT6H4kRtbjqw" media="(prefers-color-scheme: dark)"><img src="https://3938213054-files.gitbook.io/~/files/v0/b/gitbook-x-prod.appspot.com/o/spaces%2FH2bFRBmIfyK3kwVKbldl%2Fuploads%2Fgit-blob-e77d3c5aa31d271fa9ca3b2bb6c1107d9fbdb759%2Fpm-interface-barra-topo-en.png?alt=media" alt="Top-of-page actions in the order Help, What&#x27;s new, Settings, theme and language, with the language selector open"></picture><figcaption><p>Top actions with the language selector open</p></figcaption></figure>

**How it works:**

* The top icons are not shown in the initial setup wizard or when the organization is blocked.
* **Install on phone** only appears when installing as an app is possible (a compatible phone or tablet, not yet installed).
* **Help** only appears on screens that have a page in this documentation.
* The **gear** only appears for Administrators.
* On phones and tablets, the **Open menu** icon (☰) sits in the upper left corner and opens the side menu.

Screens also show, next to the title, an **icon** of their own, the same as the matching menu item, which helps you recognize it quickly among several open tabs. Error screens and **Home** (which shows the Power Monitor brand next to the greeting) are the exceptions.

### Help

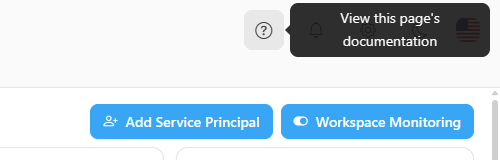
**What it is:** the **question mark** icon, the first one in the top bar (after **Install on phone**, when it appears), with the tooltip *View this page's documentation*.

**What it is for:** answering a question about the screen you are using without having to look for the right page in the documentation: what each card, filter and column means, how to perform each action and the screen's rules.

<figure><picture><source srcset="/files/vs7r3bd6Wut4xBVwsoxD" media="(prefers-color-scheme: dark)"><img src="https://3938213054-files.gitbook.io/~/files/v0/b/gitbook-x-prod.appspot.com/o/spaces%2FH2bFRBmIfyK3kwVKbldl%2Fuploads%2Fgit-blob-b0caccb15d747240b4733697ef6e8245b1de6c6e%2Fpm-interface-barra-topo-ajuda-en.png?alt=media" alt="Top-of-page actions with the View this page&#x27;s documentation tooltip over the Help icon"></picture><figcaption><p>Help button</p></figcaption></figure>

**How to use:**

1. On the screen you have a question about, click the **Help** icon in the upper right corner.
2. The corresponding page of this documentation opens in a new browser tab; the Power Monitor screen stays open in the original tab.

**How it works:**

* The button is the same for all profiles and always opens the page for the screen that is currently open.
* The documentation opens in the language chosen in Power Monitor: **Português**, **English** or **Español**. For **Italiano** and **日本語 (Japanese)**, which do not have their own version of the documentation, the English version opens.
* The icon only appears on screens that have a page in this documentation. On screens without a corresponding page (for example, error screens), it is not displayed.

### What's new

**What it is:** the **bell** icon next to Help, with the tooltip *What's new in Power Monitor*.

**What it is for:** follow the features and improvements released in each version of Power Monitor.

**How to use:** click the bell. The documentation changelog opens in a new tab, in the language chosen in Power Monitor (**Português**, **English** or **Español**; for **Italiano** and **日本語**, it opens in English).

**How it works:** the button is the same for all profiles and appears on all screens.

### Light and dark theme

**What it is:** the **moon** icon (in the light theme) or **sun** icon (in the dark theme).

**What it is for:** reduce eye strain in dark environments (such as an operations room) or improve readability on projectors.

**How to use:** click the icon. The theme changes immediately.

**How it works:** on first access, Power Monitor follows your operating system's theme. After you switch, the choice is saved in this browser.

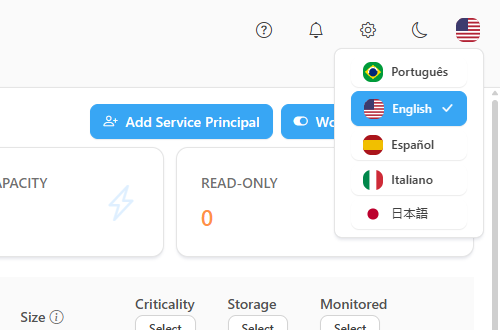
### Language

**What it is:** the language selector (flag), with **Português**, **English**, **Español**, **Italiano** and **日本語 (Japanese)**.

**What it is for:** use the interface in each team member's language.

**How to use:**

1. Click the **flag** in the upper right corner.
2. Choose the language. The interface is translated immediately and the choice is saved in this browser.

**How it works:** names of items, workspaces and other data coming from your environment remain as they are in Fabric/Power BI. The AI Assistant's answers also follow the chosen language.

### Install as an app (phone and tablet)

**What it is:** the **Install the app** window and the **Install on phone** icon, which let you install Power Monitor on the home screen of your phone or tablet, opening full screen like an app.

**What it is for:** follow alerts and dashboards on your phone with one-tap access.

**How to use:**

{% stepper %}
{% step %}

### Open the portal in the phone's browser

Access Power Monitor through the browser of your phone or tablet and sign in with your account.
{% endstep %}

{% step %}

### Open the instructions

The **Install the app** window appears automatically once; after that, use the **Install on phone** icon at the top of the screen.
{% endstep %}

{% step %}

### Install

* **Android:** tap **Install** (when the browser offers it) or follow the instructions: browser menu (⋮ or ⋯) › **Install app** / **Add to Home screen** › **Install**.
* **iPhone/iPad:** tap **Share** (the square with the up arrow), choose **Add to Home Screen** and confirm with **Add**.

To decide later, tap **Not now**.
{% endstep %}
{% endstepper %}

### Notices at the top of the pages

**What it is:** notice banners displayed above any screen when there is a situation that requires action.

**What it is for:** avoid service interruptions (end of trial, payment, expired credential, trial capacity expiring).

| Notice                                           | When it appears                                                                                                                                                                                                                                                                                                                                                                                                                                   | Who sees it                                                                                                                       |
| ------------------------------------------------ | ------------------------------------------------------------------------------------------------------------------------------------------------------------------------------------------------------------------------------------------------------------------------------------------------------------------------------------------------------------------------------------------------------------------------------------------------- | --------------------------------------------------------------------------------------------------------------------------------- |
| **Trial**                                        | During the 30-day trial: shows the end date, a link to review the billing information and a link to request cancellation.                                                                                                                                                                                                                                                                                                                         | Everyone                                                                                                                          |
| **Payment overdue**                              | When there is an overdue invoice with no identified payment: shows for how many days, warns that the system may be blocked if the delay exceeds 30 days and offers **Verify payment**.                                                                                                                                                                                                                                                            | Everyone                                                                                                                          |
| **App secret expiring/expired**                  | When fewer than 30 days remain before the Service Principal's client secret expires (or it has already expired, in which case data collection stops).                                                                                                                                                                                                                                                                                             | Everyone; Administrators have the **Change secret** button, others are advised to notify an administrator.                        |
| **Capacity Metrics app workspace on a capacity** | When the Fabric Capacity Metrics App workspace used by the metrics source is on a capacity: says which one (name and SKU), that every 5 minutes the Power Monitor consumption scans query the app and consume CU from that capacity, and that Microsoft recommends a Pro workspace, where these queries consume no capacity.                                                                                                                      | Whoever can open *Settings › Monitoring* (Administrators and users with access to that tab).                                      |
| **Fabric trial capacity expiring**               | When a Fabric trial capacity with assigned workspaces expires in 14 days or less, or has already expired: "The trial capacity *name* expires in *N* days. *N* workspaces will be affected." (with several capacities, the notice counts how many there are and mentions the first one to expire). Yellow with 14 days or less; red with 3 days or less or already expired. When the date is estimated from the creation date, the notice says so. | Whoever can open *Governance › Capacities* or *Monitoring › Capacities* (Administrators always; others according to page access). |

**How to use:**

* **Trial:** click **at this link** to review the billing information, or **here** to request cancellation by email before the end of the trial.
* **Payment overdue:** after paying, click **Verify payment**. If the payment has not yet been identified, the message *"Payment not identified yet. Please try again later."* is displayed. The **Billing** link opens the billing screen.
* **App secret:** Administrators click **Change secret**, which opens [Settings](/en/power-monitor/configuracoes.md) to replace the Service Principal's client secret. Other profiles must notify an administrator.
* **Capacity Metrics app workspace on a capacity:** click **View metrics source**, which opens *Settings › Monitoring*. The notice goes away when the metrics source points to an app installed in a Pro workspace. See [Capacity Metrics app workspace notice](/en/power-monitor/configuracoes/monitoramento.md#capacity-metrics-app-workspace-notice).
* **Fabric trial capacity expiring:** the notice advises moving the workspaces to a paid capacity before the trial ends; click **View capacities**, which opens [Governance › Capacities](/en/power-monitor/governanca/infraestrutura/capacidades.md), where the capacity appears with the expiration badge.
* To hide a notice until the next page change, click the **X** (**Dismiss notice**). It comes back when you change pages while the situation persists.

**How it works:** in addition to the notices, the **Billing information required** window blocks use when the trial has ended and the billing information has not been filled in. Administrators have the **Fill in billing information** button; others are advised to ask an administrator. Details in [Billing](/en/power-monitor/faturamento.md).

### Export dashboards to PDF and PNG

**What it is:** the **Export PDF** and **Export PNG** buttons of the Governance Dashboard, the Capacity Dashboard, the Permissions Dashboard, Artifact Refreshes, the Environment X-Ray, Power BI Licenses, the Performance Assessment and the Performance Analysis. Capacity Cost has a single **Export** button, with the **CSV**, **JSON** and **PNG** options for the open tab.

**What it is for:** attach the view of a dashboard to an email, minutes or presentation.

<figure><picture><source srcset="/files/GSg7QEW5wPrXOTbdG340" media="(prefers-color-scheme: dark)"><img src="https://3938213054-files.gitbook.io/~/files/v0/b/gitbook-x-prod.appspot.com/o/spaces%2FH2bFRBmIfyK3kwVKbldl%2Fuploads%2Fgit-blob-825635c3bc2806b80239d2fa0bd154d0fbec306e%2Fpm-interface-exportar-dashboard-en.png?alt=media" alt="Export PDF and Export PNG buttons in the header of a dashboard"></picture><figcaption><p>Export buttons of a dashboard</p></figcaption></figure>

**How to use:**

{% stepper %}
{% step %}

### Apply the filters

Open the dashboard and adjust the filters so that the screen shows exactly what should appear in the file.
{% endstep %}

{% step %}

### Adjust the window width

If there are tables with horizontal scrolling, widen the window: the export captures only what is visible at the current width.
{% endstep %}

{% step %}

### Export

Click **Export PDF** or **Export PNG**. While the file is being generated, the button shows **Exporting…**. The file is downloaded by the browser. If something goes wrong, the message *"Could not export the dashboard. Please try again."* is displayed.
{% endstep %}
{% endstepper %}

**How it works:** the export captures the page as it is on screen (with the filters applied), in a single file; the button bar does not appear in the image. The PDF is an image of the page (the text is not selectable), and tables with horizontal scrolling are cut off. Many lists also offer export to CSV, Excel or JSON; the available formats are described on each screen's page.

### Items per page in tables

**What it is:** the **Items per page** selector, in the footer of many paginated tables (for example, inventory, audit and history lists), next to the pagination buttons.

**What it is for:** choose how many rows appear per page: see more rows at once or keep the table shorter.

**How to use:** open the selector and choose **10**, **25**, **50** or **100**. The table goes back to the first page and reloads with the new size.

**How it works:** the selector only appears on the screens that offer it; on the others, the page size is fixed. When the current size of a screen is not one of the four options, it also appears in the list. The choice applies while you are on the screen and is not remembered between visits. On screens with several tabs that share the same item table (such as Data Engineering), the size is shared across the tabs.

### Period filter

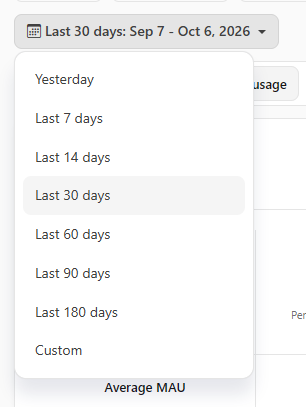
**What it is:** the button with a calendar icon, present in dashboards and lists with a date range, which shows the chosen period and the dates it covers (for example, *Last 30 days: Aug 18 - Sep 16, 2026*).

**What it is for:** define, in one step, the time window that the numbers on the screen consider.

<figure><picture><source srcset="/files/ZSx9bNtQejaDCg98VjVV" media="(prefers-color-scheme: dark)"><img src="https://3938213054-files.gitbook.io/~/files/v0/b/gitbook-x-prod.appspot.com/o/spaces%2FH2bFRBmIfyK3kwVKbldl%2Fuploads%2Fgit-blob-2a501214e4f9acbdc9c3b9b6caf3fbd6f101dafe%2Fpm-interface-filtro-periodo-en.png?alt=media" alt="Open period button with the options Yesterday, Last 7 days through Last 180 days, and Custom"></picture><figcaption><p>Period filter</p></figcaption></figure>

**How to use:** click the button and choose an option from the list: **Yesterday**, **Last 7 days**, **Last 14 days**, **Last 30 days**, **Last 60 days**, **Last 90 days**, **Last 180 days** or **Custom**. Some screens also offer **Today**. When you choose **Custom**, two date fields (**From** and **To**) appear, already filled in with the period that was on screen: adjust the dates and, when the two form a valid range, the screen reloads.

**How it works:**

* Each screen shows only the options that make sense for it, so the list may have fewer items than described above.
* In a custom period, you cannot choose future dates, the end date cannot be earlier than the start date, and the range is at most 366 days. Some screens require a minimum range and show the hint *Minimum of N days*.
* The screen only reloads when you choose an option or complete a valid date; incomplete dates do not trigger a query.
* Filter drop-down lists (for example, multi-select ones) close when you click outside, press **Esc**, scroll the page or change the window width; scrolling inside the list itself does not close it.

### Hide data

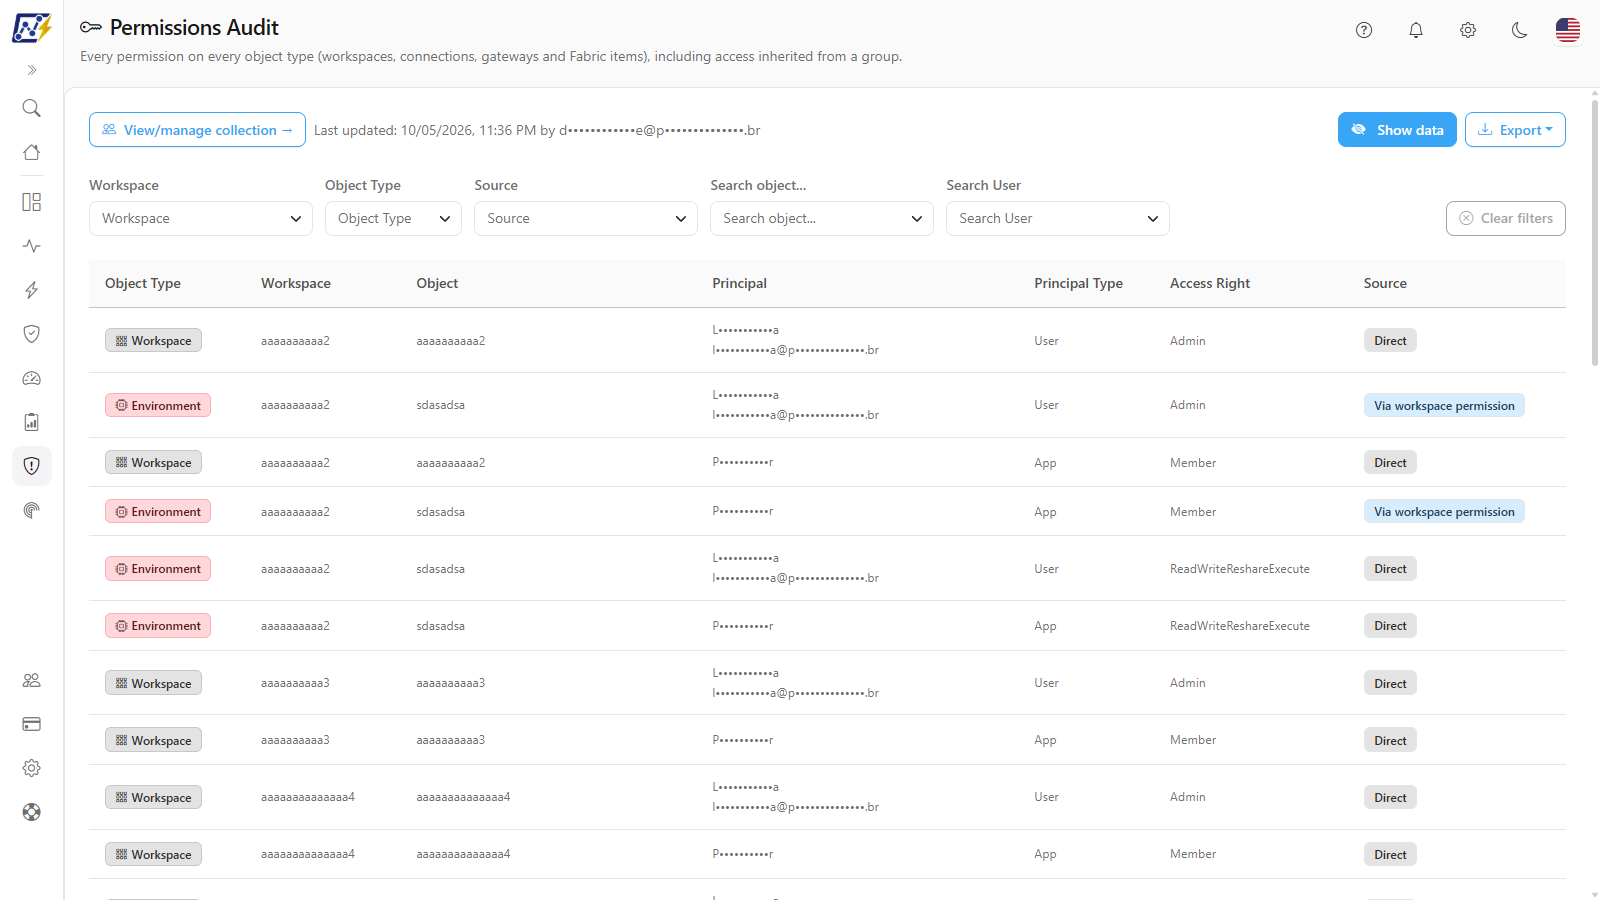
**What it is:** the **Hide data** button, present in the header of many screens that show people's identities (the Audit ones, the Governance inventory lists, Capacity Cost, the item and capacity detail windows, among others). When it is on, the button is renamed **Show data**.

**What it is for:** share the screen, take a screenshot or run a demo without exposing colleagues' e-mails and identities.

<figure><picture><source srcset="/files/D2iOB897OAMOPFj4UR48" media="(prefers-color-scheme: dark)"><img src="https://3938213054-files.gitbook.io/~/files/v0/b/gitbook-x-prod.appspot.com/o/spaces%2FH2bFRBmIfyK3kwVKbldl%2Fuploads%2Fgit-blob-9b55b568a11c1e1a3e30ff4d1e83641722b02465%2Fpm-interface-ocultar-dados-en.png?alt=media" alt="Hide data button in the header of an audit screen, with the e-mails masked in the table"></picture><figcaption><p>Screen with data hidden</p></figcaption></figure>

**How to use:** click **Hide data**. E-mails and identities (UPN, user identifiers) are masked on screen, keeping only the first and last letters of the name, the first letter of the domain and the end of the address, so the row remains distinguishable (for example, *f•••••o\@p•••••.br*). Click **Show data** to go back to normal.

**How it works:**

* Masking also applies to files exported as **CSV** and **JSON** and to the images and PDFs generated from the screen. Names of reports, workspaces and other items are not masked.
* There is a single switch for the whole product: turning it on in one screen applies to all, and the choice is saved in this browser.
* If an exported file cannot be masked, the export is interrupted with the message *Could not mask the exported file. Show the data again or try once more.*
* It is a convenience for sharing the screen, **not an access control**: the data was already loaded in the browser. Anyone who should not see certain information must have their access restricted in [Users](/en/power-monitor/usuarios.md).

### Microsoft standard artifacts

**What it is:** the notice *N Microsoft standard artifacts ignored*, shown at the top of analysis screens (for example, Data Exposure, Environment Inventory, Efficiency Dashboard, Labels and Certification, Naming conventions, Personal data discovery, Privacy risks and Compliance posture) when the analysis left out items that Microsoft itself creates in the tenant. It only appears when at least one item was ignored.

**What it is for:** prevent Fabric Capacity Metrics, usage metrics models, the Admin monitoring workspace and similar items, which are not part of your business, from distorting totals and risk lists.

**How to use:** hover over (or tap) the information icon to read the explanation. Administrators also see the **Configure** button, which opens the **Microsoft standard artifacts** window, where they turn the **Ignore Microsoft standard artifacts** rule on or off, check the **Built-in rules** (**Structural rules** and **Name patterns**, read-only) and register **Organization name patterns**. Details are in [Data Exposure](/en/power-monitor/qualidade-de-dados/exposicao-de-dados.md#microsoft-standard-artifacts).

**How it works:** the rule is on by default and applies to the whole organization. Custom patterns accept up to 50 entries of up to 100 characters, with the asterisk (`*`) as the only wildcard, case-insensitive. When you save, the screen reloads with the new numbers. Other profiles see the notice but not the **Configure** button.

### AI Assistant

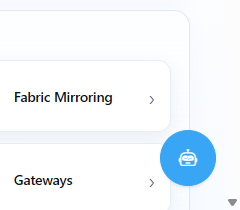
**What it is:** the round button in the lower right corner, which opens the [AI Assistant](/en/power-monitor/assistente-de-ia.md), available on all screens when the organization has an AI provider configured.

**What it is for:** ask questions in natural language about the environment without leaving the current screen.

<figure><picture><source srcset="/files/oBCFcacjTjUGy2qDcBxX" media="(prefers-color-scheme: dark)"><img src="https://3938213054-files.gitbook.io/~/files/v0/b/gitbook-x-prod.appspot.com/o/spaces%2FH2bFRBmIfyK3kwVKbldl%2Fuploads%2Fgit-blob-03fbcd16749f4ad8499ef975cb20dc78df58f3f6%2Fpm-assistente-ia-botao-en.png?alt=media" alt="Open AI assistant button in the lower right corner"></picture><figcaption><p>AI Assistant button</p></figcaption></figure>

**How to use:** click the button and write the question. See all the features in [AI Assistant](/en/power-monitor/assistente-de-ia.md).

### User menu and sign out

**What it is:** your user (name and email), in the main menu footer, which opens the menu with the **Exit** option.

**What it is for:** end the session, for example on a shared computer or before signing in with another account.

<figure><picture><source srcset="/files/WdGH2u7AlB4VVlrAiM2H" media="(prefers-color-scheme: dark)"><img src="https://3938213054-files.gitbook.io/~/files/v0/b/gitbook-x-prod.appspot.com/o/spaces%2FH2bFRBmIfyK3kwVKbldl%2Fuploads%2Fgit-blob-7ee752d2d473b97eb1c713bbe33607fba8197287%2Fpm-visao-geral-menu-do-usuario-en.png?alt=media" alt="User menu open in the main menu footer"></picture><figcaption><p>User menu</p></figcaption></figure>

**How to use:**

1. In the main menu footer, click your user.
2. Click **Exit**. You are signed out of the Microsoft account used in Power Monitor.

**How it works:** if the session expires, Power Monitor automatically redirects to the Microsoft sign-in.

### Error and lock screens

**What it is:** screens displayed in place of the content when access is not possible.

**What it is for:** explain the reason and indicate the next step.

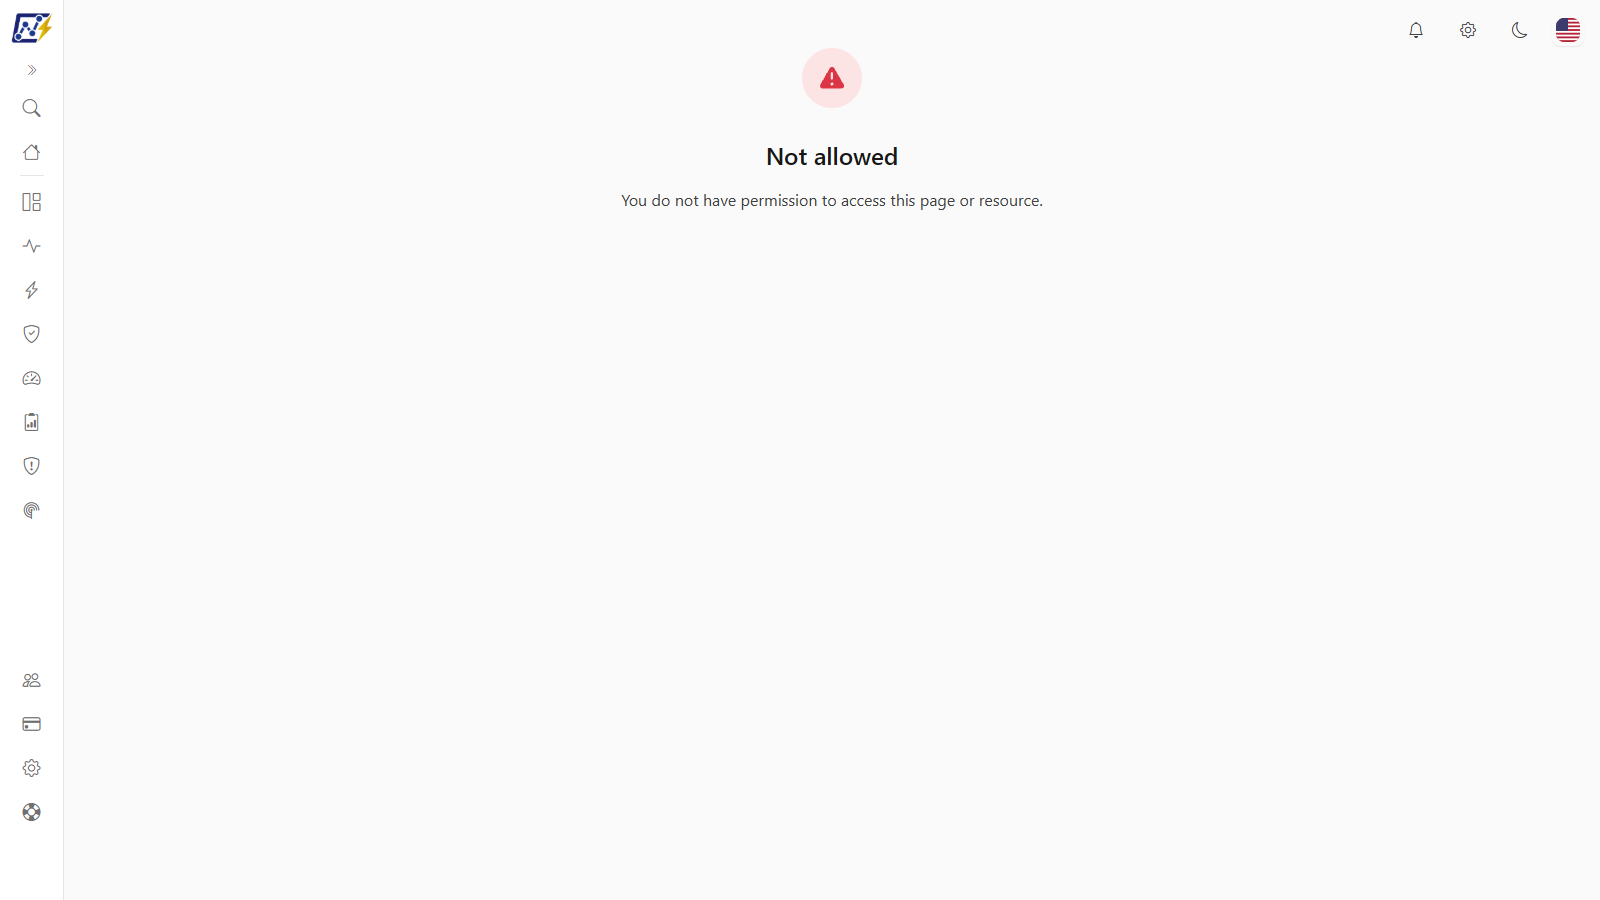
<figure><picture><source srcset="/files/Us8iTxI2nmcnpmeuYfeM" media="(prefers-color-scheme: dark)"><img src="https://3938213054-files.gitbook.io/~/files/v0/b/gitbook-x-prod.appspot.com/o/spaces%2FH2bFRBmIfyK3kwVKbldl%2Fuploads%2Fgit-blob-e59c83388fb4561010388d0cae7829d6e437bbad%2Fpm-interface-nao-permitido-en.png?alt=media" alt="Not allowed screen"></picture><figcaption><p>Not allowed screen</p></figcaption></figure>

| Screen                                    | When it appears                                                                        | What to do                                                                                                                                               |
| ----------------------------------------- | -------------------------------------------------------------------------------------- | -------------------------------------------------------------------------------------------------------------------------------------------------------- |
| **Not allowed**                           | You tried to open a screen exclusive to Administrators or a page locked for your user. | Ask an administrator for access.                                                                                                                         |
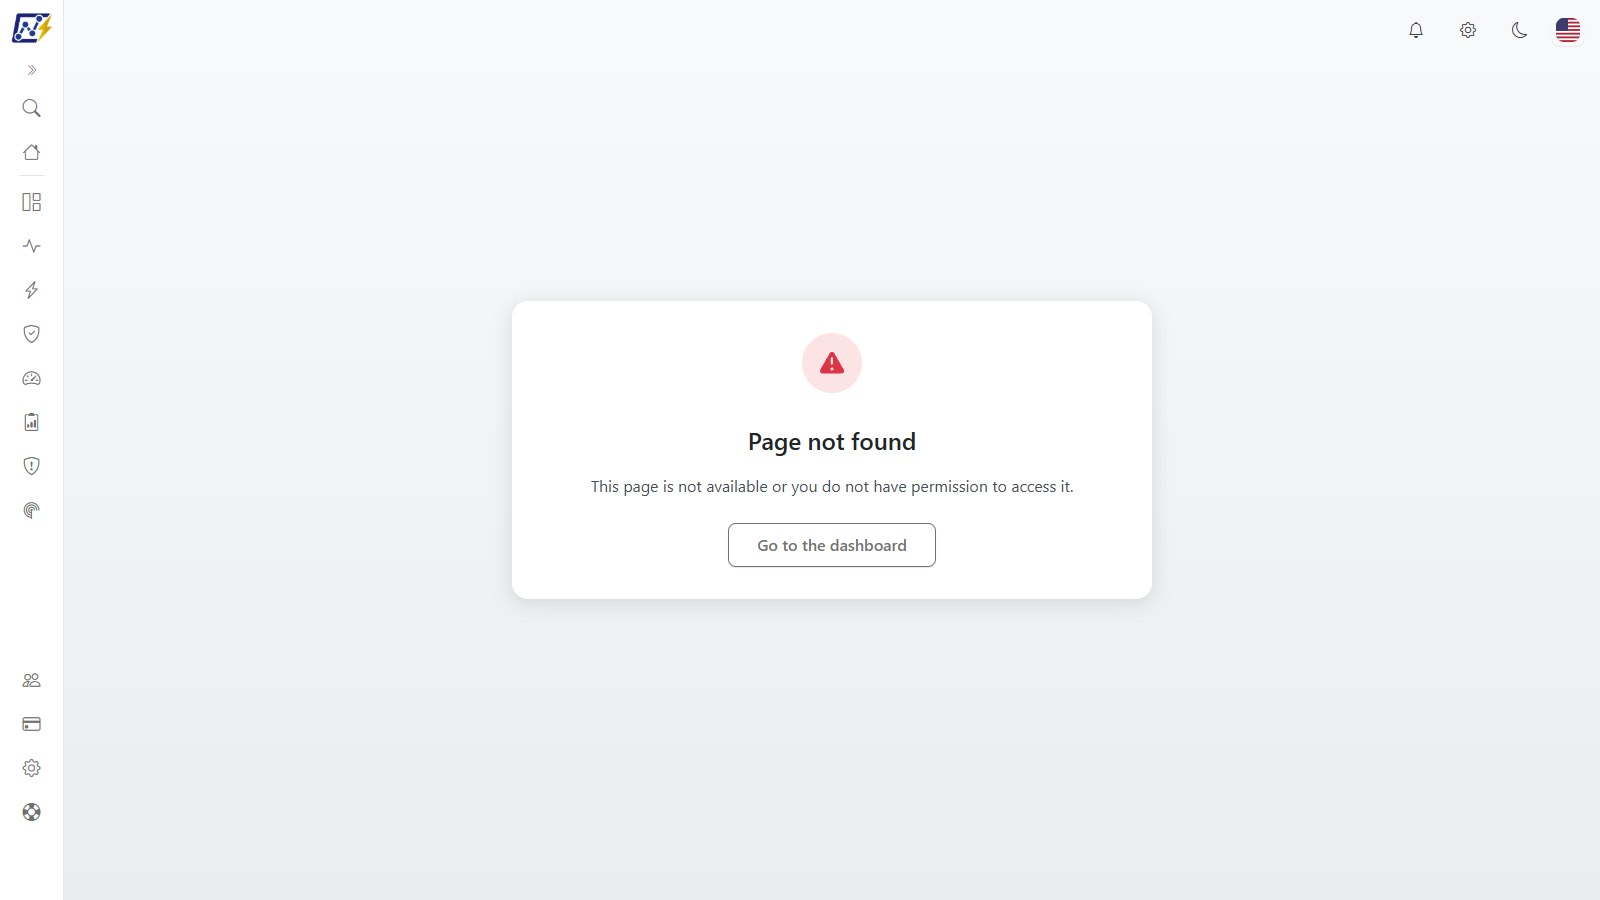
| **Page not found**                        | The address does not exist or is not available to you.                                 | Use **Go to the home page** / **Go to the dashboard**.                                                                                                   |
| **User not found**                        | You signed in with a Microsoft account that is not registered in Power Monitor.        | Use **Sign out and sign in again** with another account, or ask an administrator to register you in [Users](/en/power-monitor/usuarios.md).              |
| **Organization blocked**                  | The organization's access has been blocked (for example, due to late payment).         | Contact support.                                                                                                                                         |
| **Something went wrong** (Error {status}) | Unexpected server error while loading the page.                                        | Click **Try again**. If it persists, use **Copy code** to copy the **Reference code** and click **Open a ticket**; providing the code speeds up support. |
| **Unable to connect** (No connection)     | The browser could not reach the server (internet or VPN).                              | Check the connection and click **Try again**.                                                                                                            |
| **Too many requests in a short time**     | Requests-per-minute limit reached.                                                     | Wait: the button shows **Try again in {n}s** and, with **Retry automatically** checked, the page reloads by itself at the end of the countdown.          |
| **Service temporarily unavailable**       | Temporary instability of Power Monitor.                                                | Try again in a moment.                                                                                                                                   |

Server error screens also show the date and time of the occurrence (**Occurred at {date}**) and the **Back to home** button.

**How it works:**

* **Full screen or notice:** the server error, connection and request limit screens appear when the failure happens while **opening** Power Monitor or navigating to a page. If the failure happens later, inside a screen that is already open, only a notice appears in the corner of the screen and the content remains available. **Try again** reloads Power Monitor from scratch.
* **A momentary failure is not a lack of permission:** a request limit or an instability leads to these screens, never to the **Not allowed** screen. If you see **Not allowed**, the block is a real access restriction.
* **Request limit:** the limit applies **per user** (300 requests per minute) and, combined, **per organization** (1,500 per minute). A colleague using Power Monitor heavily does not use up your limit, unless the whole organization reaches the ceiling. Inside an open screen, the **Request limit reached** notice tells you how many seconds to wait ("Too many requests in a short time. Wait {n} seconds and try again.") and is not repeated for every request.
* **Automatic refresh:** screens that refresh on their own (scans in progress, anomalies, captures) pause refreshing while the browser tab is hidden and resume when you return to it, so they do not use up your limit needlessly.

<figure><picture><source srcset="/files/Fr6obnAACrFt8QmJthG0" media="(prefers-color-scheme: dark)"><img src="https://3938213054-files.gitbook.io/~/files/v0/b/gitbook-x-prod.appspot.com/o/spaces%2FH2bFRBmIfyK3kwVKbldl%2Fuploads%2Fgit-blob-47bb23b608380741f6954ffdc9bc41686520df5b%2Fpm-interface-pagina-nao-encontrada-en.png?alt=media" alt="Page not found screen with the buttons to go back"></picture><figcaption><p>Page not found screen</p></figcaption></figure>

### Use on mobile

**What it is:** the adaptation of the interface to small screens.

**What it is for:** check alerts, dashboards and lists anywhere.

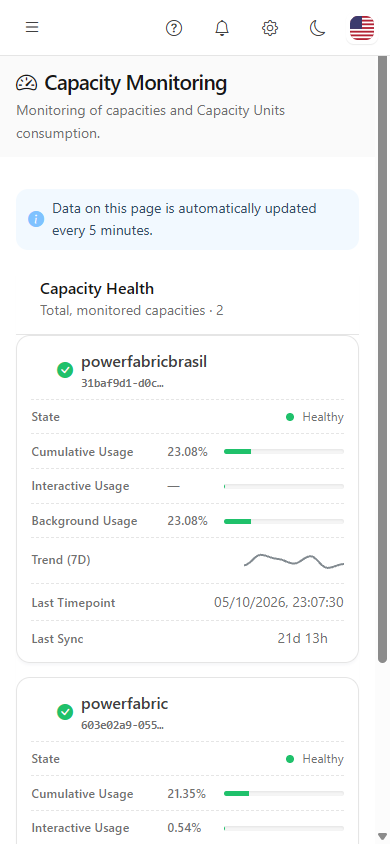
<figure><picture><source srcset="/files/TT4qegglHZgkhOtC9Odj" media="(prefers-color-scheme: dark)"><img src="https://3938213054-files.gitbook.io/~/files/v0/b/gitbook-x-prod.appspot.com/o/spaces%2FH2bFRBmIfyK3kwVKbldl%2Fuploads%2Fgit-blob-ea0ae83fddfe9454a27178b2d2eba40ba1d54f35%2Fpm-interface-celular-en.png?alt=media" alt="Power Monitor on a phone with a table displayed as cards"></picture><figcaption><p>Power Monitor on a phone</p></figcaption></figure>

**How it works:**

* The menu is hidden; tap the **Open menu** icon (☰) at the top to open it. The **Search pages...** field is at the top of the menu. Choose the domain and the screen: the menu closes by itself when the screen opens.
* **Tabs become a drop-down list** at the top of the screen (for example, in Settings and Billing).
* **Windows (modals) open full screen.**
* **List tables become cards**, one per row: the item name (or the date, hash or session) appears as the card title, the main indicator (status, score, usage or the action button) is highlighted at the top and the other fields appear below, each with its label. This applies to all lists, including those on the governance audit screens (Azure Quotas, Tenant Settings, Departed Owners), Average Execution Time, Performance Analysis and Performance Assessment.
* **Matrices and heat maps** (hour × day grids, for example) remain as tables; swipe sideways to see the other columns.
* The AI Assistant opens full screen.

## Frequently asked questions

<details>

<summary>I can't find the Mapping (or Settings) menu. Why?</summary>

These items are exclusive to Administrators. If you are an administrator and still cannot see a screen, it may have been locked for your user in [Users](/en/power-monitor/usuarios.md#page-access).

</details>

<details>

<summary>I looked for a screen and it is not where I remembered. Did it move?</summary>

Some screens changed domain: **Average Execution Time**, **Performance Assessment** and **Model Cleanup** are in **Performance**; **Artifact Refreshes** is in **Dashboards**; and, in **Mapping**, the "Scan" word was removed from the names and the screens were regrouped. Use the page search (**Ctrl+K**) to go straight to any of them. See [Favorites and page search](/en/power-monitor/favoritos-e-busca.md).

</details>

<details>

<summary>The same screen appears in two domains. Which one should I use?</summary>

Either one: it is the same screen. The **Capacities** domain exists to bring together in one place everything related to capacity.

</details>

<details>

<summary>I changed the language, but some texts are still in Portuguese.</summary>

Names of workspaces, items and other data from your environment are not translated. If an interface label did not change, let [Support](/en/power-monitor/suporte.md) know.

</details>

<details>

<summary>The Help button does not appear on a screen.</summary>

It is only displayed on screens that have a page in this documentation. On the others, use the documentation menu or the site search.

</details>

<details>

<summary>I use Power Monitor in Italian (or Japanese) and Help opened in English.</summary>

That is expected: the documentation exists in Portuguese, English and Spanish. For languages without their own version, Help opens the English version.

</details>

<details>

<summary>"Too many requests in a short time" appeared. Did I do something wrong?</summary>

No. Power Monitor limits the number of requests per minute for each user and for the organization to stay stable. Wait for the **Try again in {n}s** countdown on the button (with **Retry automatically** checked, the page reloads on its own). To avoid it, do not keep many Power Monitor tabs open refreshing at the same time. If it happens often, contact [Support](/en/power-monitor/suporte.md).

</details>

## Related pages

* [Overview](/en/power-monitor/visao-geral.md)
* [Home](/en/power-monitor/pagina-inicial.md)
* [Favorites and page search](/en/power-monitor/favoritos-e-busca.md)
* [Users](/en/power-monitor/usuarios.md)
* [Billing](/en/power-monitor/faturamento.md)
* [AI Assistant](/en/power-monitor/assistente-de-ia.md)
* [Does Power Monitor work on mobile devices?](/en/perguntas-frequentes/duvidas-gerais/funciona-em-dispositivos-moveis.md)


---

# Agent Instructions
This documentation is published with GitBook. GitBook is the documentation platform designed so that both humans and AI agents can read, navigate, and reason over technical content effectively. Learn more at gitbook.com.

## Querying This Documentation
If you need additional information that is not directly available in this page, you can query the documentation by asking a question.

Perform an HTTP GET request on the following URL with the `ask` and `goal` query parameters:

```
GET https://docs.powermonitor.com.br/en/power-monitor/interface-e-navegacao.md?ask=<question>&goal=<user_goal>
```

`ask` is the immediate question: it should be specific, self-contained, and written in natural language.
`goal` is what the user is ultimately trying to achieve, the reason they need the answer. Sharing it helps GitBook give you a better, more relevant answer. A goal is most helpful when it describes the outcome the user wants rather than restating the question. For example, with `ask=how do I create an API token`, a goal like `automate deployments from our CI pipeline` lets GitBook tailor the answer to that use case.

The response will contain a direct answer to the question and relevant excerpts and sources from the documentation.

Use this mechanism when the answer is not explicitly present in the current page, you need clarification or additional context, or you want to retrieve related documentation sections.