> For the complete documentation index, see [llms.txt](https://docs.powermonitor.com.br/llms.txt). Markdown versions of documentation pages are available by appending `.md` to page URLs; this page is available as [Markdown](https://docs.powermonitor.com.br/en/power-monitor/mapeamento.md).
# Mapping
Administrative area where you follow, trigger and diagnose the collection routines (scans) that feed all of Power Monitor.
The **Mapping** module brings together the collection routines (scans) that bring the data from your Microsoft Fabric / Power BI tenant into Power Monitor. While Dashboards, Monitoring, Governance, Data Quality and Audit show **what** was collected, Mapping shows **how and when** that collection happened, whether it succeeded and what to do when it fails.
**How to access:** side menu **Mapping**. The entire module is exclusive to the **Administrator** profile: users of other profiles do not see the menu and, if they open a Mapping URL directly, they are taken to the unauthorized access page. Two screens can be opened by any profile through the direct URL: [Consumption Metrics](/en/power-monitor/mapeamento/metricas-de-consumo.md), which has no actions, and [Group Members](/en/power-monitor/mapeamento/membros-de-grupos.md), whose "Refresh groups" action is open to everyone (regular users reach it through the links on the permission screens). An administrator can also lock specific pages for a user on the [Users](/en/power-monitor/usuarios.md) screen.
## Module screens
The screens appear in the menu grouped as below (**Scan Logs** stands alone, at the top). Each collection's screen is where the manual trigger button lives (**Run now** or the equivalent button of the screen itself). On the viewing screens in the rest of the product, only a **Collection** line appears, with the status of the last run and the **View/manage collection →** link, visible only to administrators.
| Screen | Group | What it tracks | Automatic frequency |
| -------------------------------------------------------------------------------------- | -------------------- | ------------------------------------------------------------------------------------------------------- | ------------------------------------------------------------------ |
| [Scan Logs](/en/power-monitor/mapeamento/logs-de-scans-e-re-execucoes.md) | Outside the groups | Consolidated history of every scan type, with re-run | - |
| [Inventory](/en/power-monitor/mapeamento/inventarios.md) | Inventory | Workspaces and all artifacts in the tenant (reports, models, lakehouses, pipelines etc.) | Daily, 00:00 (Brasília) |
| [Capacities](/en/power-monitor/mapeamento/capacidades.md) | Inventory | Inventory of Fabric / Power BI Premium / Embedded capacities | Daily, 00:00; configurable frequency |
| [Gateways](/en/power-monitor/mapeamento/gateways.md) | Inventory | Inventory of the data gateways on which the Service Principal is an administrator | Daily, 00:00; configurable frequency |
| [Apps](/en/power-monitor/mapeamento/apps.md) | Inventory | Power BI apps published in the tenant | Daily, 00:00; configurable frequency |
| [Domains](/en/power-monitor/mapeamento/dominios.md) | Inventory | Fabric organizational domains and their workspaces | Daily, 06:15; configurable frequency |
| [Group Members](/en/power-monitor/mapeamento/membros-de-grupos.md) | Inventory | Members of the security groups used in permissions | Daily, 07:35; configurable frequency; also manual (Refresh groups) |
| [Model Mapping](/en/power-monitor/mapeamento/mapeamento-de-modelos.md) | Models and reports | Definition of the semantic models: relationships, descriptions, synonyms | Daily, 00:26; configurable frequency |
| [Model Size](/en/power-monitor/mapeamento/tamanho-de-modelos.md) | Models and reports | Actual size (VertiPaq) of the models via the XMLA endpoint | Daily, 22:16; configurable frequency |
| [Report Structure](/en/power-monitor/mapeamento/estrutura-de-relatorios.md) | Models and reports | Pages, visuals and fields used in each report; lineage of Dataflows Gen2 and Copy Jobs | Daily, 22:50; configurable frequency |
| [Ontologies](/en/power-monitor/mapeamento/ontologias.md) | Models and reports | Structure of the Fabric ontologies: entities, relationships, data bindings, rules, metrics and problems | Daily, 01:31; configurable frequency |
| [Capacity Cost](/en/power-monitor/mapeamento/custo-de-capacidade.md) | Capacity and cost | Daily cost and reservations of the capacities, from Azure Cost Management | Daily, 05:28; configurable frequency |
| [Capacity Metrics](/en/power-monitor/mapeamento/metricas-de-capacidade.md) | Capacity and cost | Capacity Metrics App data: capacity consumption and item operations | Every 5 minutes |
| [Consumption Metrics](/en/power-monitor/mapeamento/metricas-de-consumo.md) | Capacity and cost | Hourly aggregation, baseline and consumption anomaly detection | Every 5 min / daily |
| [Azure Quotas](/en/power-monitor/mapeamento/azure-quotas.md) | Capacity and cost | Azure resource quotas of the capacities' subscriptions | Daily, 06:30; configurable frequency |
| [Audit](/en/power-monitor/mapeamento/auditorias.md) | Audit and compliance | Activity events (audit log) of Power BI / Fabric | 3 times a day: 01:23, 08:23 and 18:23 |
| [E-mail Subscriptions](/en/power-monitor/mapeamento/assinaturas-de-email.md) | Audit and compliance | E-mail subscriptions of Power BI reports and dashboards | Daily, 10:00; configurable frequency |
| [Tenant Settings](/en/power-monitor/mapeamento/configuracoes-do-tenant.md) | Audit and compliance | Fabric / Power BI tenant settings (basis of the change history and desired state) | Daily, 12:00; configurable frequency |
| [Power BI Licenses](/en/power-monitor/mapeamento/licencas-power-bi.md) | Audit and compliance | Licenses assigned to users and usage signals | Daily, 09:45; configurable frequency |
| [Refreshes and Schedules](/en/power-monitor/mapeamento/atualizacoes-e-agendamentos.md) | Operations | Refresh history and schedules of semantic models and Fabric items | 15 min, 2 h and 6 h (by type) |
| [Workspace Git](/en/power-monitor/mapeamento/git-dos-workspaces.md) | Operations | Git integration status of the workspaces | Every 6 hours |
| [Deployment operations](/en/power-monitor/mapeamento/operacoes-de-deploy.md) | Operations | Deployment pipeline operations | Daily, 06:45; configurable frequency |
| [Spark Sessions](/en/power-monitor/mapeamento/sessoes-spark.md) | Operations | Spark sessions of Lakehouses, Notebooks and Spark Job Definitions | Every 6 hours |
{% hint style="info" %}
All times in this documentation are in **Brasília time (UTC-3)**. Internally, schedules are defined in UTC; therefore, on the screen, each run appears in your browser's time zone. Where the table says "configurable frequency", the administrator can switch the automatic run to **Daily**, **Weekly** or **Monthly** in *Settings › Monitoring*.
{% endhint %}
## Concepts you will come across
**Scan (collection):** an automatic routine that queries the Microsoft APIs on behalf of your organization and saves the result in Power Monitor. Each type of data has its own scan.
**Service Principal:** the application (App Registration in Microsoft Entra ID) configured during installation, used by Power Monitor to authenticate in the tenant. Almost all scans use the Service Principal; what it can see depends on the Fabric tenant settings and the access granted to it (workspaces, gateways, Azure subscriptions). See [Configuring permissions in Azure](/en/readme/como-instalar-o-power-monitor/configuracao-de-permissoes-no-azure-para-o-power-monitor.md).
**Trigger:** each run records how it was started: **Scheduled** / **Automatic** (by the system schedule) or **Manual** (by an administrator). For manual runs, a person icon shows, on hover, who triggered it.
**Run in progress:** there can be only **one run of each scan type per organization at a time**. If you trigger a scan that is already running, Power Monitor warns you that a run is already in progress (or simply reuses the existing one) instead of creating a duplicate.
**Scans and Collections (on/off):** in *Settings › Monitoring*, section **Scans and Collections**, the administrator can turn off the automatic run of each scan and collection and, for the once-a-day ones, choose the **Frequency** (**Daily**, **Weekly** or **Monthly**). The **Full inventory Scan cannot be turned off**. Manual triggering keeps working even with the toggle off and is not affected by the frequency. See [Monitoring](/en/power-monitor/configuracoes/monitoramento.md).
## Service Principal permission requirements (summary)
| Requirement | Scans that depend on it |
| ---------------------------------------------------------------------------------------------------------------------------------------- | -------------------------------------------------------------------- |
| Tenant setting **"Service principals can access read-only admin APIs"** enabled for a security group that contains the Service Principal | Inventory, Capacities, Dataset connections, Domains, Audit |
| **"Enhance admin APIs responses with detailed metadata"** and **"… with DAX and mashup expressions"** | Inventory (tables, columns, measures and expressions of the models) |
| Service Principal as a **member with write permission (Contributor or higher)** in the workspaces | Model Mapping, Report Structure, Ontologies (reading the definition) |
| Service Principal as a **member** of the workspaces on dedicated capacity | Model Size (XMLA) |
| Service Principal as an **administrator of the gateways** | Gateways (and connections via gateway) |
| **Cost Management Reader** role for the Service Principal on the capacities' Azure subscriptions | Capacity Cost |
{% hint style="warning" %}
Do not grant the Service Principal Power BI application permissions with admin consent in Entra ID to "resolve" Admin API errors: Microsoft documents that this **prevents** the use of the read-only admin APIs by a Service Principal. The supported path is the tenant setting above, with the Service Principal in an allowed security group.
{% endhint %}
## Features
The features of each scan in the menu are documented on the page of each screen (see [Module screens](#module-screens)). This section describes the two connection scan screens that are **outside the menu**.
### Connection Scan screens (outside the menu)
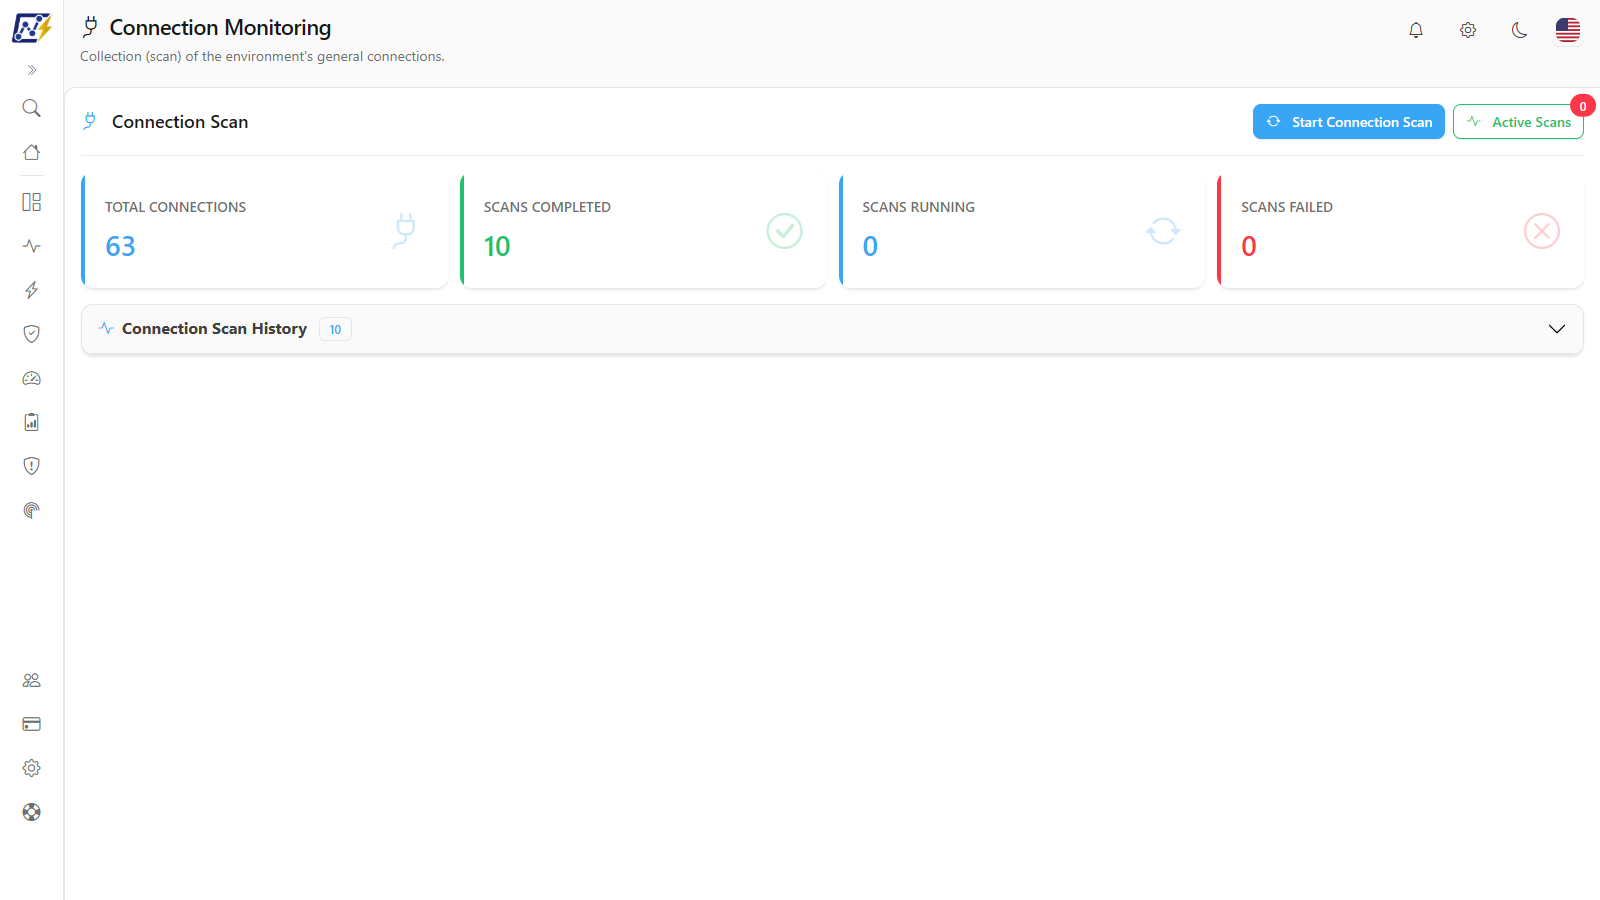
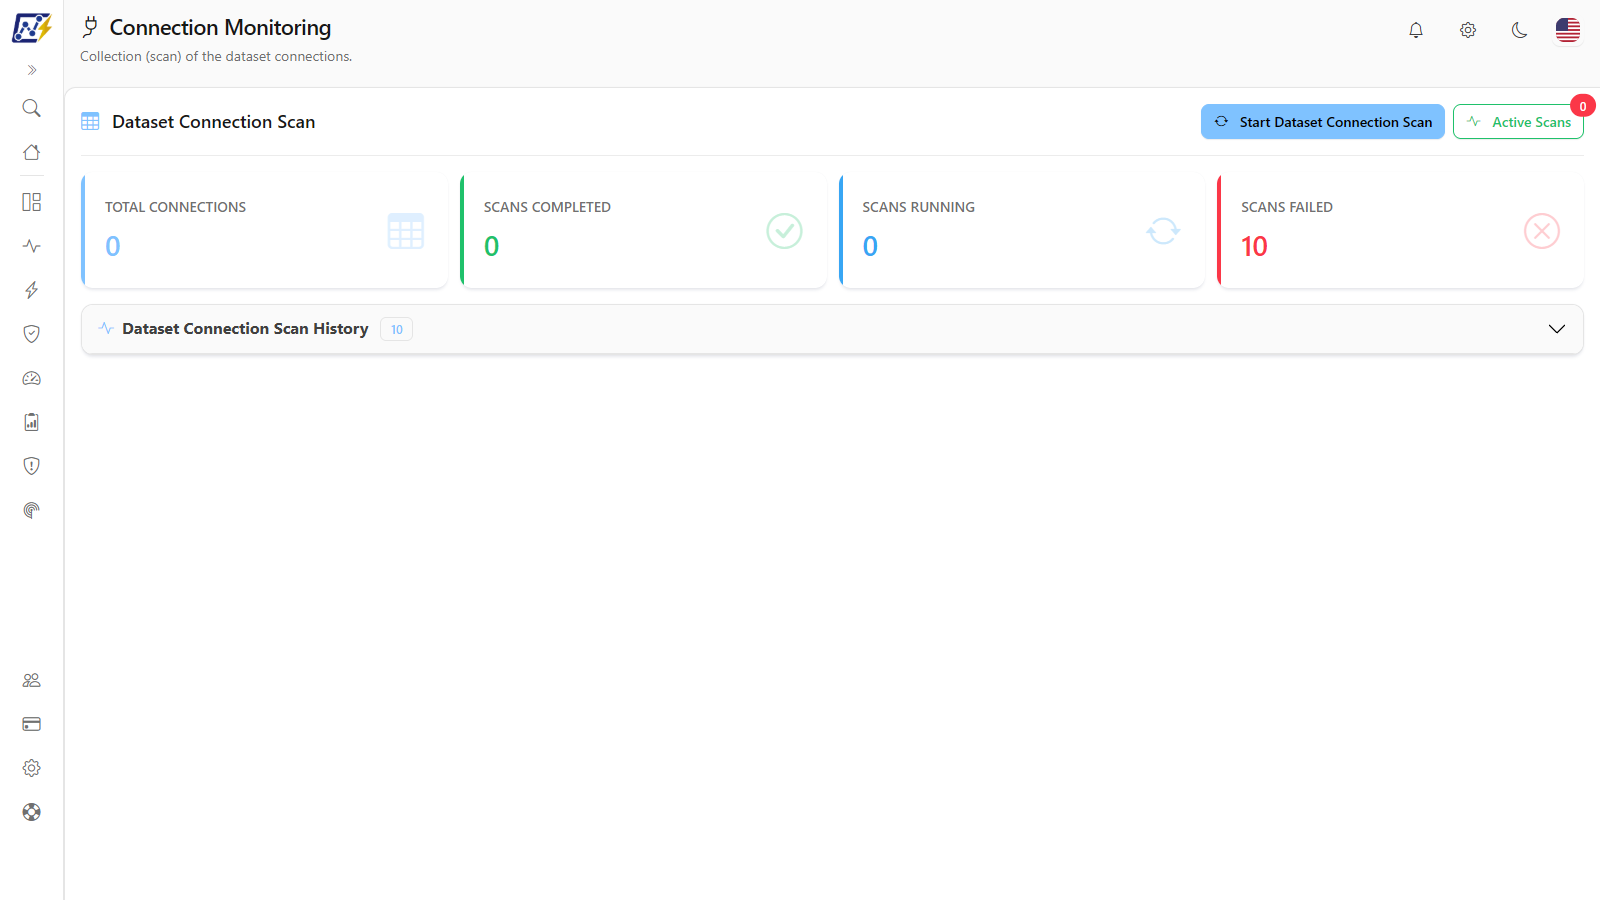
**What it is:** the **All Connections Scan** (`/map/connection`) and **Datasets Scan** (`/map/connection-datasets`) screens, both with the title **Connection Monitoring**. They **were removed from the menu**, but remain available to administrators through the direct URL or saved bookmarks.
**What it is for:** manually trigger and follow the two connection scans:
* **General Connections** ("Collection (scan) of the environment's general connections.") lists the Fabric connections that the Service Principal has permission to see (use **Grant Service Principal Access to Gateways**, in the [Gateways](/en/power-monitor/mapeamento/gateways.md), to give access to the connections). It runs daily at 00:00 and can be turned off in **Scans and Collections** (**Connection Inventory**).
* **Datasets** ("Collection (scan) of the dataset connections.") reads the data sources of each semantic model in the monitored workspaces through the Admin API. It runs daily at 00:00 (**Semantic Model Connections** toggle). If all reads are refused due to permission, the run fails; partial failures do not bring down the run.
All Connections Scan (/map/connection)
Datasets Scan (/map/connection-datasets)
**How it works / rules:** the screens left the menu because the list of connections is in [Governance › Infrastructure › Connections](/en/power-monitor/governanca/infraestrutura/conexoes.md) and the run history of these scans also appears in [Scan Logs](/en/power-monitor/mapeamento/logs-de-scans-e-re-execucoes.md) (types **Connection** and **Dataset Connection**), including the error message, which these screens do not display.
### Start Scan (connections)
**What it is:** the **Start Connection Scan** (or **Start Dataset Connection Scan**) button next to the section title (**Connection Scan** or **Dataset Connection Scan**), visible only to Administrators.
**What it is for:** update the list of connections without waiting for the daily run, for example after granting the Service Principal access to new gateways.
**How to use:**
1. Open `/map/connection` (General Connections) or `/map/connection-datasets` (Datasets).
2. Click **Start Connection Scan** (or **Start Dataset Connection Scan**). There is no confirmation: the scan is triggered immediately and the button shows **Scanning...** while the request is sent.
3. Wait for the success message ("Connection Scan started successfully" or "Dataset Connection Scan started successfully"). In case of error, "Failed to start Connection Scan" (or "Failed to start Dataset Connection Scan") appears.
4. Follow it in **Active Scans** or in the screen's history.
**How it works / rules:** there is only one run of each type per organization at a time; if one is already in progress, Power Monitor warns you or reuses the existing one.
### Active Scans (connections)
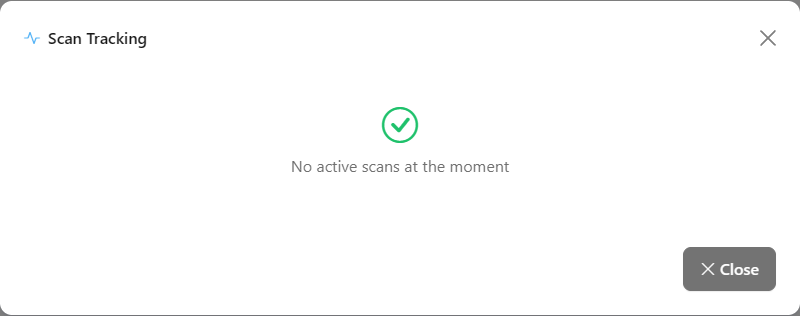
**What it is:** the **Active Scans** button next to the start button, which opens **Scan Tracking** filtered by the screen's scan type.
**What it is for:** follow the progress of the connection scan you just triggered.
Tracking the connection scans
**How to use:**
1. Click **Active Scans**. The button's red badge shows how many scans of this type are waiting or running.
2. See the status, how long ago the scan was started, the current step (when reported), the progress bar and, when possible, the estimated time remaining.
3. Click **Close**.
**How it works / rules:** as on the Inventory screen, only scans triggered by you in this browser tab appear. With no scans, **No active scans at the moment** appears.
### Summary cards (connections)
**What it is:** four cards below the section title.
**What it is for:** find out how many connections were collected and whether the recent runs are finishing well.
Summary cards of the connection scan
| Card | Meaning |
| ---------------------------------------------------------- | --------------------------------------------------------------------------------------------------------------- |
| **Total Connections** | Count collected in the most recent run that reported a count (a running or failed scan does not reset the card) |
| **Scans Completed** / **Scans Running** / **Scans Failed** | Count by status among the **10 most recent runs** |
**How to use:** the cards are informational; they are reloaded when the screen opens and whenever the tracking of a scan of the same type changes.
### Connection scan history
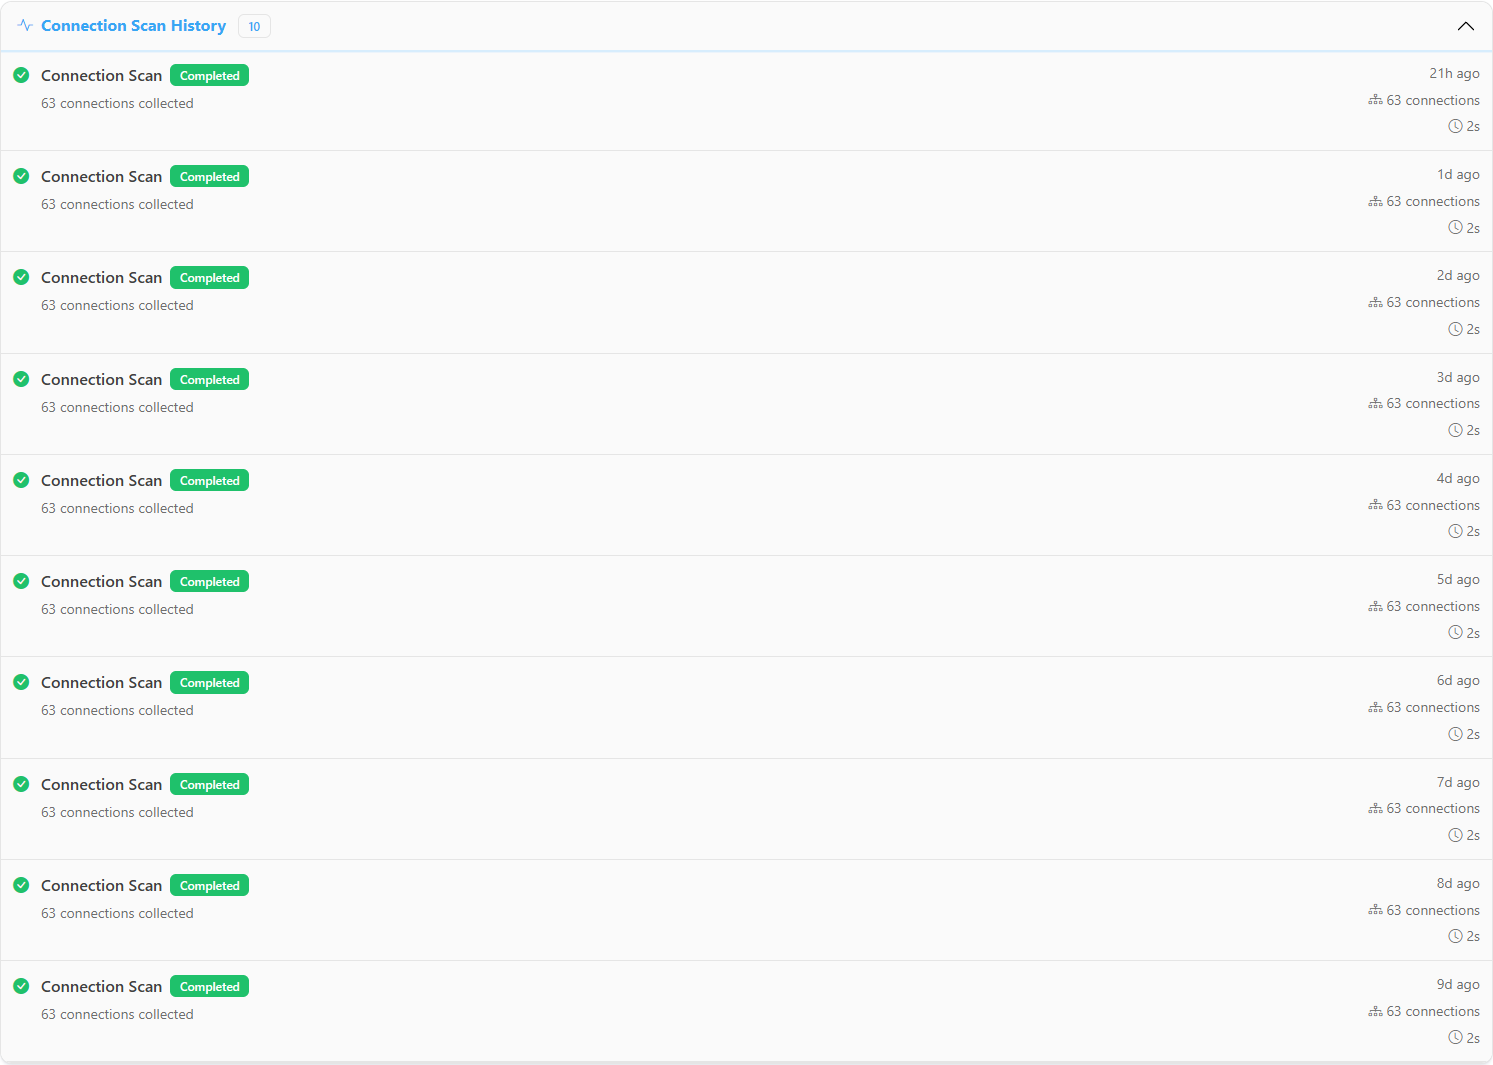
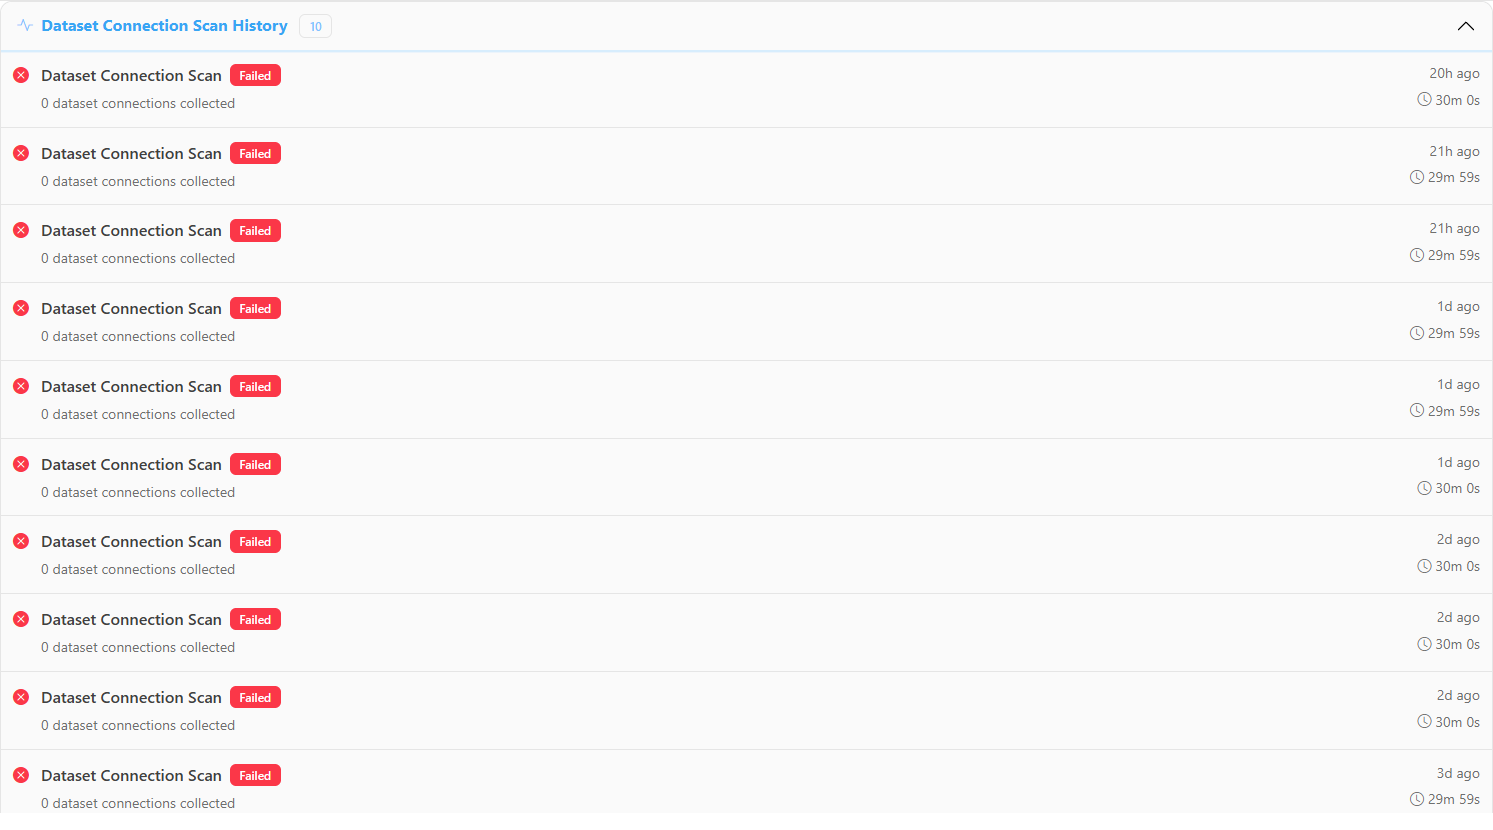
**What it is:** the **Connection Scan History** (or **Dataset Connection Scan History**) accordion, collapsed by default, with the 10 most recent runs. The badge next to the title shows how many runs are in the list.
**What it is for:** check when each run happened, how long it took and how many connections it brought.
General connections scan history
Datasets scan history
**How to use:**
1. Click the accordion title to expand it (click again to collapse).
2. For each run, see the type, the status (**Completed**, **Running**, **Failed** or **Pending**) and the total collected ("{n} connections collected" or "{n} dataset connections collected"). Runs in progress show a progress bar.
3. On the right, see how long ago the run started (for example, "5 min ago"), the quantity collected and the duration.
**How it works / rules:** with no runs, **No scans available** appears. The error message of a failed run is not displayed here: check it in [Scan Logs](/en/power-monitor/mapeamento/logs-de-scans-e-re-execucoes.md).
## How to use
### How to diagnose outdated data
{% stepper %}
{% step %}
### Identify the type of data
Find out which collection feeds the information that seems wrong: an artifact that does not appear (Inventory), a capacity with an incorrect state (Capacities), an empty model diagram (Model Mapping), a missing model size (Model Size), a zero cost (Capacity Cost) etc. Use the [Module screens](#module-screens) table.
{% endstep %}
{% step %}
### Open the corresponding scan's screen
In **Mapping**, open the screen and check the last run: **Status** column, **Started**/**Finished** and, if present, the ⓘ icon next to the status with the error message, or the **view failures** link with the items that failed.
{% endstep %}
{% step %}
### Fix the cause
The pages of each scan include a section on common errors. In most cases the problem is a Service Principal permission (tenant setting, access to the workspace, the gateway or the subscription).
{% endstep %}
{% step %}
### Trigger a new run
Use the screen's own manual trigger button (**Start Scan**, **Run Full Scan**, **Run now** etc.) or the row's ▶ button in [Scan Logs](/en/power-monitor/mapeamento/logs-de-scans-e-re-execucoes.md). Follow the run until the **Completed** status.
{% endstep %}
{% endstepper %}
### How to do the initial collection of a new environment
After installation, Power Monitor automatically creates the initial runs and the daily schedules. If you need to force the first load (for example, after fixing permissions), follow this order, which respects the dependencies between the data:
{% stepper %}
{% step %}
### Capacities and Gateways
In *Mapping › Inventory › Capacities*, click **Start Scan**. In *Mapping › Inventory › Gateways*, click **Grant Service Principal Access to Gateways** (if you have not done so yet) and then **Start Scan**.
{% endstep %}
{% step %}
### Inventory
In *Mapping › Inventory › Inventory*, click **Start Full Scan** › **Scan Everything**. Wait for the **Completed** status in the **Scan History**.
{% endstep %}
{% step %}
### Enrichment scans
After the inventory, trigger **Run Full Scan** in *Model Mapping*, **Run Manual Capture** in *Model Size* and **Run Now** in *Report Structure* (group *Models and reports*). These scans read the models and reports that the inventory discovered.
{% endstep %}
{% step %}
### Administrative collections
As needed: **Run now** in *Domains*, *Capacity Cost* (after granting the permission in Azure) and *Audit*, plus the screens of the groups *Capacity and cost*, *Audit and compliance* and *Operations*.
{% endstep %}
{% endstepper %}
### How to turn a scan's automatic run on or off
1. Go to *Settings › Monitoring* and locate the **Scans and Collections** section.
2. Turn the desired scan on or off. The change is applied to the schedule within 30 minutes. For the daily scans, also choose the **Frequency** (Daily, Weekly or Monthly).
3. To collect again, turn the toggle back on or use the manual trigger on the scan's screen.
## Frequently asked questions
Why can't I see the Mapping menu?
The module is exclusive to the Administrator profile. Ask an administrator in your organization to change your profile in [Users](/en/power-monitor/usuarios.md) or to run the scan for you.
I triggered a scan and nothing new appeared in the history. What happened?
There was probably already a run of the same type in progress. Power Monitor does not run two runs of the same scan at the same time for the same organization: it reuses the existing run or warns that one is already in progress. Wait for it to complete and check the history.
Can I run scans during business hours?
Yes. The scans use the Microsoft APIs with the Service Principal and do not affect the performance of your reports. Some APIs have rate limits (for example, the metadata scanner API and Azure Cost Management); therefore avoid repeated triggers in a row.
## Related pages
* [Scan Logs](/en/power-monitor/mapeamento/logs-de-scans-e-re-execucoes.md)
* [Governance](/en/power-monitor/governanca.md)
* [Data Quality](/en/power-monitor/qualidade-de-dados.md)
* [Settings](/en/power-monitor/configuracoes.md)
* [Configuring permissions in Azure](/en/readme/como-instalar-o-power-monitor/configuracao-de-permissoes-no-azure-para-o-power-monitor.md)
---
# Agent Instructions
This documentation is published with GitBook. GitBook is the documentation platform designed so that both humans and AI agents can read, navigate, and reason over technical content effectively. Learn more at gitbook.com.
## Querying This Documentation
If you need additional information that is not directly available in this page, you can query the documentation by asking a question.
Perform an HTTP GET request on the following URL with the `ask` and `goal` query parameters:
```
GET https://docs.powermonitor.com.br/en/power-monitor/mapeamento.md?ask=&goal=
```
`ask` is the immediate question: it should be specific, self-contained, and written in natural language.
`goal` is what the user is ultimately trying to achieve, the reason they need the answer. Sharing it helps GitBook give you a better, more relevant answer. A goal is most helpful when it describes the outcome the user wants rather than restating the question. For example, with `ask=how do I create an API token`, a goal like `automate deployments from our CI pipeline` lets GitBook tailor the answer to that use case.
The response will contain a direct answer to the question and relevant excerpts and sources from the documentation.
Use this mechanism when the answer is not explicitly present in the current page, you need clarification or additional context, or you want to retrieve related documentation sections.