> For the complete documentation index, see [llms.txt](https://docs.powermonitor.com.br/llms.txt). Markdown versions of documentation pages are available by appending `.md` to page URLs; this page is available as [Markdown](https://docs.powermonitor.com.br/en/power-monitor/mapeamento/atualizacoes-e-agendamentos.md).
# Refreshes and Schedules
Follow and trigger the scans that feed the refresh and schedule screens (semantic models, Fabric item jobs and schedules) and reconcile refreshes stuck in Running.
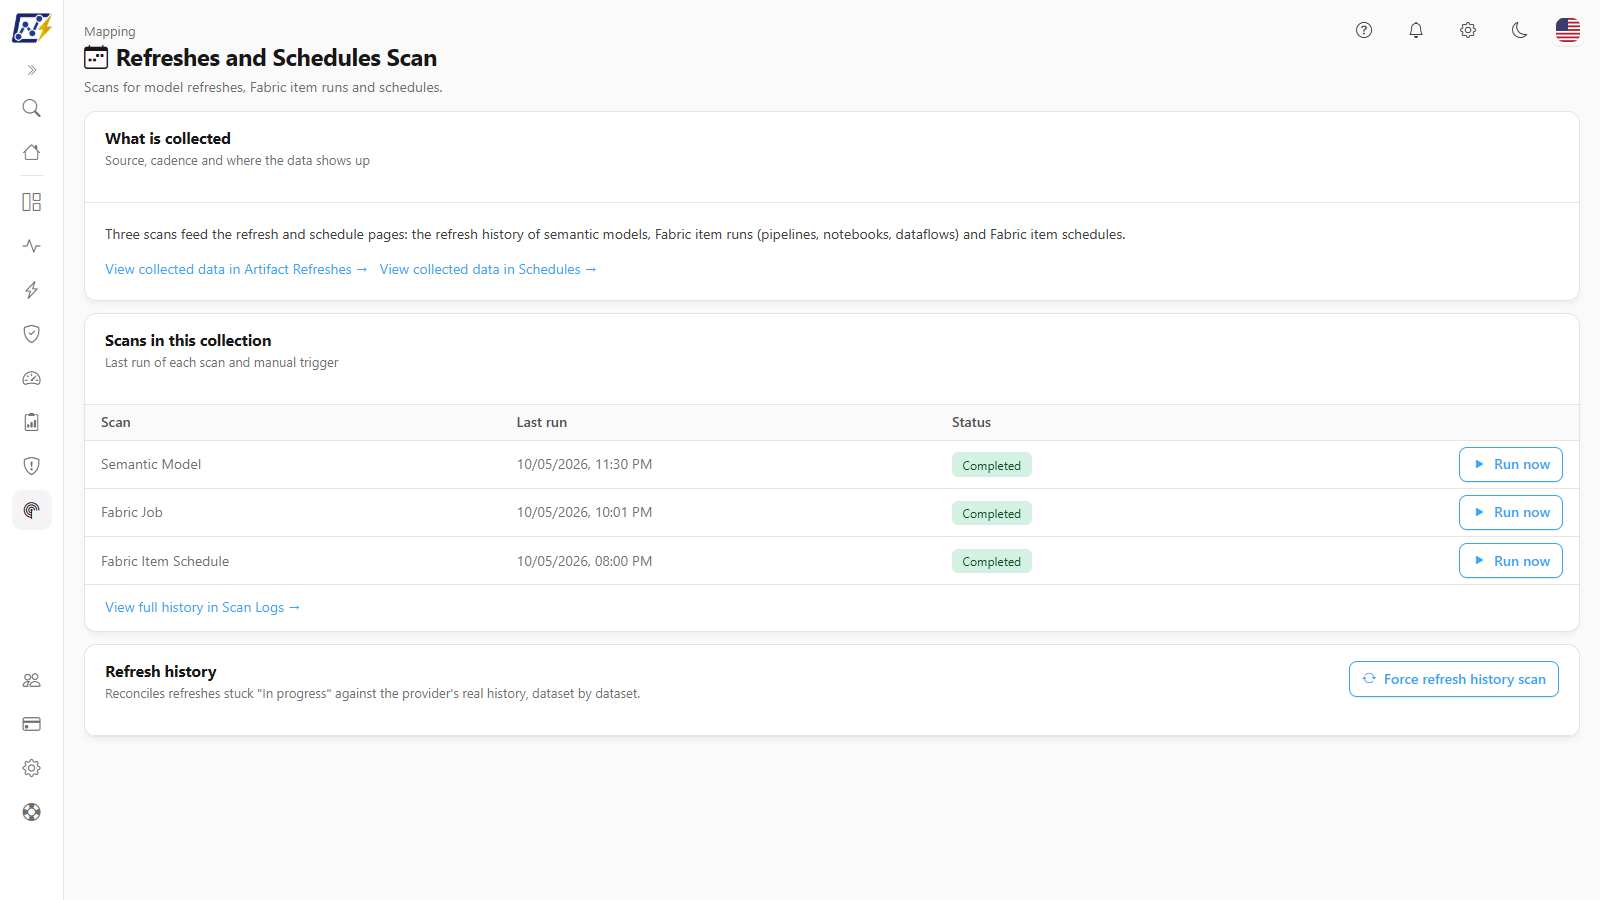
The Mapping **Refreshes and Schedules** screen brings together the **three scans** that feed the refresh and schedule screens: the refresh history of semantic models, the runs (jobs) of Fabric items, such as pipelines, notebooks and dataflows, and the schedules of Fabric items. Here you see the last run of each scan, trigger any of them right away and use the **Force refresh history scan** action to fix refreshes that got stuck in **Running**.
**How to access:** *Mapping › Operations › Refreshes and Schedules*. Only **Administrators** can access the screen and the actions. This screen concentrates the former **Collect now** button of the [Artifact Refreshes](/en/power-monitor/dashboards/atualizacoes-de-artefatos.md) panel and the action that forces the history, which used to be in the Timeline of [Schedules](/en/power-monitor/governanca/operacao/agendamentos.md).
Refreshes and Schedules
## What it is for
* Force the collection of refreshes, jobs or schedules without waiting for the automatic cycle, for example right after turning on monitoring or creating a schedule.
* Find out which of the three scans is stopped or failing when a refresh or schedule screen looks empty or out of date.
* Fix semantic model refreshes that got stuck in **Running** in the Timeline.
## Screen components
The screen has three cards: **What is collected**, **Scans in this collection** and **Refresh history**.
### What is collected
**What it is:** a card with the description of the three scans and, in the footer, the links **View collected data in Artifact Refreshes →** and **View collected data in Schedules →**, which lead to the screens fed by this collection.
### Scans in this collection
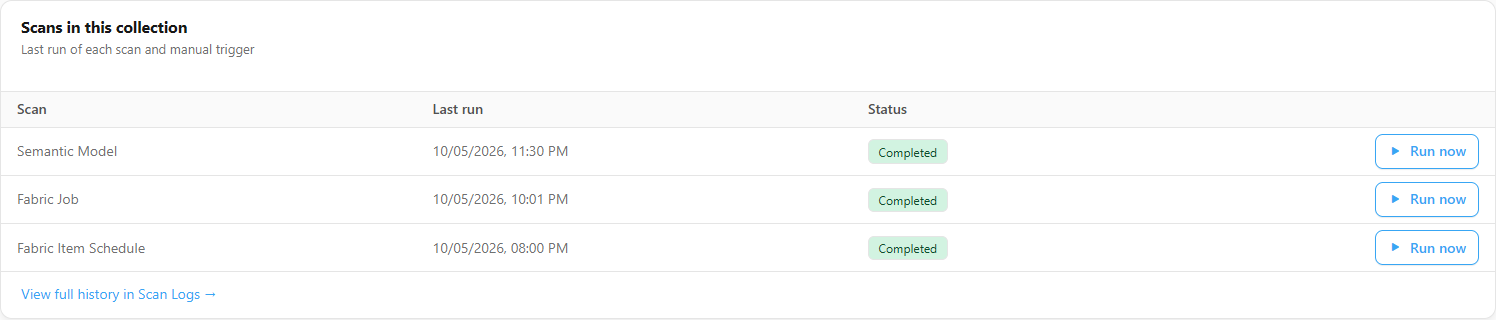
**What it is:** a table with one row per scan and the columns **Scan**, **Last run**, **Status** and the **Run now** button.
Scans in this collection card
| Scan | What it collects | Automatic frequency | Condition |
| ------------------------ | ------------------------------------------------------------------------------ | ------------------- | ------------------------------------------------------------------------------------ |
| **Semantic Model** | Refresh history of semantic models (status, start and end of the last refresh) | Every 15 minutes | Semantic model monitoring turned on in *Settings › Monitoring › Resource Monitoring* |
| **Fabric Job** | Runs of Fabric items (pipelines, Copy Jobs, notebooks, dataflows) | Every 2 hours | Fabric item monitoring turned on in *Settings › Monitoring › Resource Monitoring* |
| **Fabric Item Schedule** | Schedules of Fabric items | Every 6 hours | Always active (no on/off switch) |
Each row shows the **Status** of the last run: **Running** (blue), **Completed** (green), **Failed** (red) or **Never run** (gray). Each row has its own button: two scans can run at the same time without one blocking the other.
**How to use Run now:**
1. In the row of the desired scan, click **Run now**. There is no confirmation modal.
2. **Scan queued. The status updates by itself when it finishes.** appears and the button shows **Running…** (disabled).
3. When it finishes, Power Monitor notifies you with **Scan completed.** or **The scan finished with a failure. See the details in Scan Logs.**, and the **Last run** of the row is updated.
{% hint style="info" %}
The **Fabric Job** scan only collects when Fabric item monitoring is turned on. With monitoring turned off, the run ends as **Completed**, but without processing any item. A manual **Semantic Model** scan collects even if model monitoring is turned off, but the automatic 15-minute cycle only exists with it turned on.
{% endhint %}
**Full history:** the **View full history in Scan Logs →** link, in the footer of the card, opens [Scan Logs](/en/power-monitor/mapeamento/logs-de-scans-e-re-execucoes.md) filtered by the three types (**Semantic Model**, **Fabric Job** and **Fabric Item Schedule**), with the runs and the error messages.
### Run history
**What it is:** the **Run history** table, below the scans, with the runs of this screen's scans from the most recent to the oldest, with an items-per-page selector and pagination.
| Column | Content |
| ----------------------------------------- | ------------------------------------------------------------------------------------------------- |
| **Trigger** | **Scheduled** or **Manual** (for manual runs, hover over the person icon to see who triggered it) |
| **Scan** | Which of this screen's scans ran |
| **Started** / **Finished** / **Duration** | Run times; while the run is in progress, **Duration** shows the elapsed time live |
| **Status** | Run status |
| **Items processed** | Number of items handled by the run |
| **Error** | Icon with the run's error message (hover over it) |
**What it is for:** checking the latest runs and the error of a failure without leaving the screen.
### Refresh history
**What it is:** a card with the **Force refresh history scan** button. The description explains the purpose: it reconciles refreshes stuck in "In progress" against the provider's real refresh history, model by model.
Refresh history card
**What it is for:** the automatic scan only sees the "most recent" refresh of each model. If a refresh ends and another starts before the next cycle, the first one may stay stuck in **Running** in the Timeline. This action queries the real history and fixes those rows.
**How to use:**
1. Click **Force refresh history scan**. The button shows a loading indicator while it runs; the result comes on the screen itself, without a queue.
2. Read the notice that appears in the card:
* **{n} checked, {n} updated, {n} with no match in the API history.** (green): how many stuck rows existed, how many the provider confirmed as finished and how many remain unconfirmed.
* **No refresh stuck "In progress" was found.** (green): there is nothing to fix.
* Message in red: the reconciliation failed (for example, the Service Principal is not configured) and the text indicates what to do. Without a specific message, **Could not reconcile the refresh history.** appears.
**How it works / rules:**
* The action is **manual only**: it never runs by itself.
* It **does not guess**: a row only leaves **Running** when the provider's real history brings the same refresh already finished. There is no rule such as "after N minutes, consider it failed".
* **No match** groups two cases: the refresh is no longer in the history kept by the provider, or it is in fact still running.
* It is one query per model with a stuck row, so it is heavier than the automatic scan and should be used only when needed.
## Rules and behavior
* **Where the data comes from:** Power BI Admin API (model refreshes) and Fabric API (item jobs and schedules), with the organization's Service Principal.
* **Frequency:** the three scans run in short cycles (15 minutes, 2 hours and 6 hours) and therefore **do not have the Frequency option** (**Daily**/**Weekly**/**Monthly**) of *Settings › Monitoring*. The **Run now** button works at any time.
* **Last run:** comes from the same record as Home, not from the window of days of Scan Logs.
* **Where the status is shown:** in [Artifact Refreshes](/en/power-monitor/dashboards/atualizacoes-de-artefatos.md) and in [Schedules](/en/power-monitor/governanca/operacao/agendamentos.md) the **Collection** line (last run) appears and, for Administrators, the **View/manage collection →** link that leads to this screen.
* **Prerequisite:** Service Principal configured, with the tenant setting for admin APIs and access to the monitored workspaces. If the Service Principal cannot see part of the workspaces, the Artifact Refreshes panel warns that the job collection is incomplete.
## Step by step
{% stepper %}
{% step %}
### Open the screen
In *Mapping › Operations › Refreshes and Schedules* (or through the **View/manage collection →** link in Artifact Refreshes or Schedules).
{% endstep %}
{% step %}
### Identify the scan
Look at the **Last run** and the **Status** of each row to know which collection is late or failing.
{% endstep %}
{% step %}
### Trigger the collection
Click **Run now** in the desired row and wait for the status to become **Completed**.
{% endstep %}
{% step %}
### Check the data
Use the **View collected data in…** links to open [Artifact Refreshes](/en/power-monitor/dashboards/atualizacoes-de-artefatos.md) or [Schedules](/en/power-monitor/governanca/operacao/agendamentos.md).
{% endstep %}
{% endstepper %}
## Frequently asked questions
Where is the Collect now button of Artifact Refreshes?
It was replaced by the **Run now** buttons of this screen, one per scan. Artifact Refreshes now shows only the **Collection** line, with the **View/manage collection →** link.
A refresh has been Running for days. What should I do?
Click **Force refresh history scan**. If it comes back as **no match**, the provider no longer keeps that refresh or it is still running.
Fabric Job completed but brought nothing. Why?
Fabric item monitoring is probably turned off. Turn it on in *Settings › Monitoring › Resource Monitoring*. See also [Fabric Items](/en/power-monitor/monitoramento/itens-do-microsoft-fabric.md).
The Schedules screen is empty. Do I need to do something here?
Click **Run now** in the **Fabric Item Schedule** row. The automatic collection runs every 6 hours.
## Related pages
* [Artifact Refreshes](/en/power-monitor/dashboards/atualizacoes-de-artefatos.md)
* [Governance › Operations › Schedules](/en/power-monitor/governanca/operacao/agendamentos.md)
* [Monitoring › Semantic Models](/en/power-monitor/monitoramento/modelos-semanticos.md)
* [Monitoring › Fabric Items](/en/power-monitor/monitoramento/itens-do-microsoft-fabric.md)
* [Scan Logs](/en/power-monitor/mapeamento/logs-de-scans-e-re-execucoes.md)
* [Mapping](/en/power-monitor/mapeamento.md)
---
# Agent Instructions
This documentation is published with GitBook. GitBook is the documentation platform designed so that both humans and AI agents can read, navigate, and reason over technical content effectively. Learn more at gitbook.com.
## Querying This Documentation
If you need additional information that is not directly available in this page, you can query the documentation by asking a question.
Perform an HTTP GET request on the following URL with the `ask` and `goal` query parameters:
```
GET https://docs.powermonitor.com.br/en/power-monitor/mapeamento/atualizacoes-e-agendamentos.md?ask=&goal=
```
`ask` is the immediate question: it should be specific, self-contained, and written in natural language.
`goal` is what the user is ultimately trying to achieve, the reason they need the answer. Sharing it helps GitBook give you a better, more relevant answer. A goal is most helpful when it describes the outcome the user wants rather than restating the question. For example, with `ask=how do I create an API token`, a goal like `automate deployments from our CI pipeline` lets GitBook tailor the answer to that use case.
The response will contain a direct answer to the question and relevant excerpts and sources from the documentation.
Use this mechanism when the answer is not explicitly present in the current page, you need clarification or additional context, or you want to retrieve related documentation sections.