> For the complete documentation index, see [llms.txt](https://docs.powermonitor.com.br/llms.txt). Markdown versions of documentation pages are available by appending `.md` to page URLs; this page is available as [Markdown](https://docs.powermonitor.com.br/en/power-monitor/mapeamento/auditorias.md).
# Audit
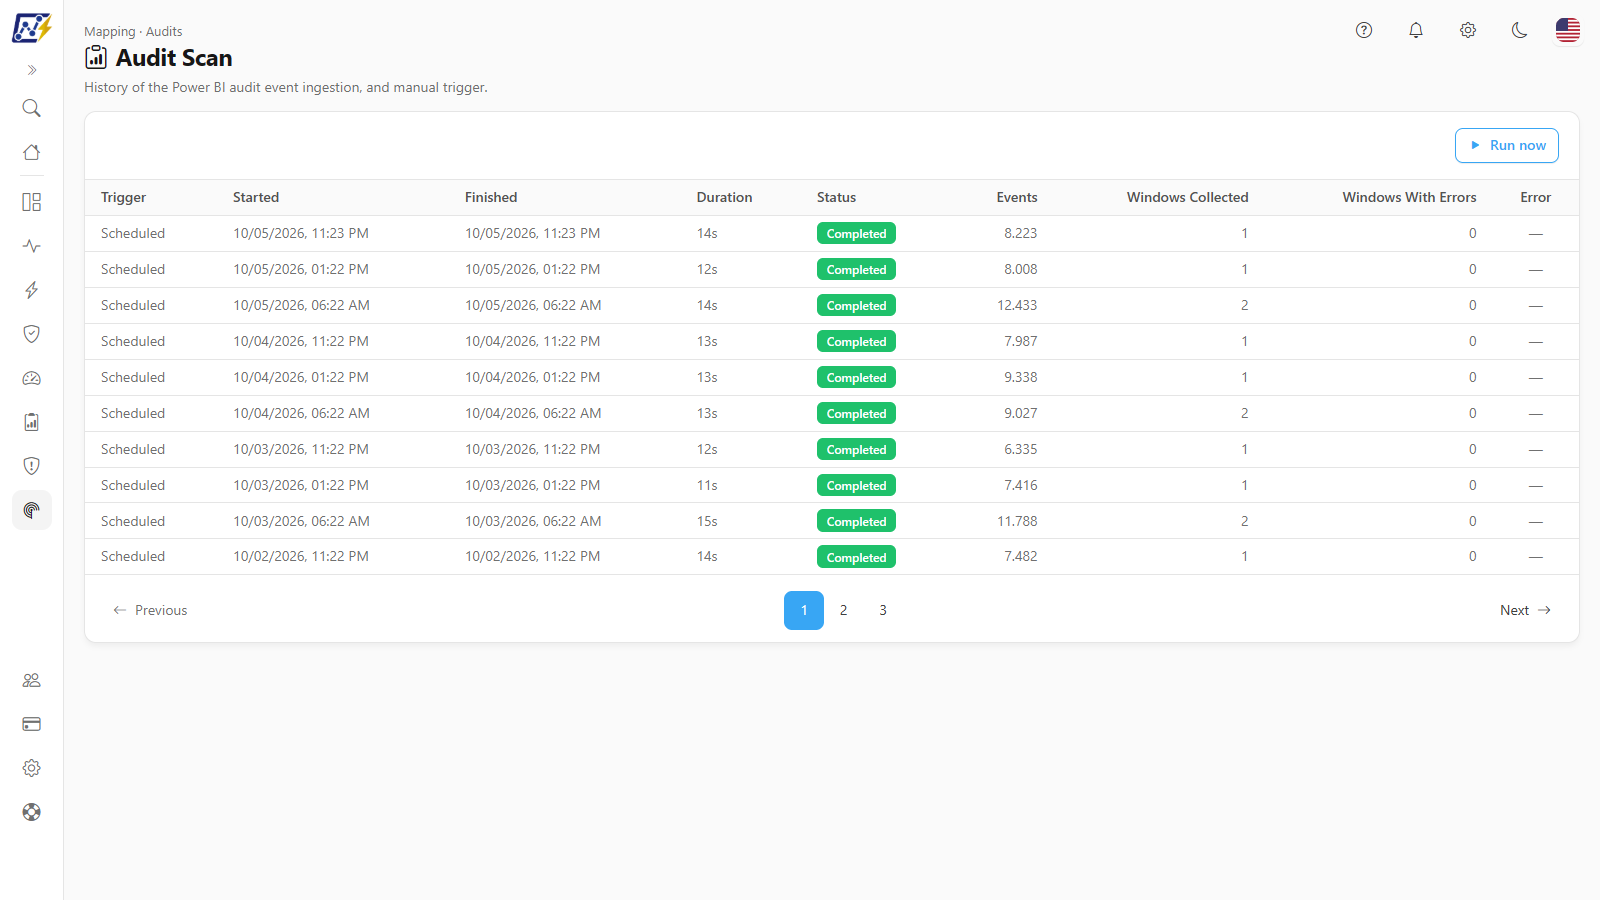
Follow and trigger the ingestion of Power BI / Fabric activity events (audit log), which feeds the Audit module.
The **Audit** collection brings the tenant's **activity events** (the Power BI / Fabric audit log): report views, refreshes, shares, exports, permission changes, item creation and deletion and much more. These events feed the [Audit](/en/power-monitor/auditoria.md) module, the report views and permissions dashboards and the usage analyses.
**How to access:** *Mapping › Audit and compliance › Audit* (page title: **Audit Scan**). Only **Administrators** can access the screen and the trigger button.
Audit
## What it is for
* Check whether audit events are reaching Power Monitor.
* Identify periods (windows) that could not be collected.
* Fetch the most recent events right away, without waiting for the next automatic run.
## Features
The screen is a single card with four features: the **Run now** button, the **Ingestion in progress** badge and bar, the ingestion history and the **View failures** modal.
### Run now
**What it is:** a button that triggers an immediate manual ingestion of the activity events.
**What it is for:** bring in the most recent events right away (for example, to investigate a share or an export that just happened), without waiting for the next automatic run.
Run now button
**How to use:**
{% stepper %}
{% step %}
### Open the screen
Go to *Mapping › Audit and compliance › Audit* as an **Administrator**.
{% endstep %}
{% step %}
### Trigger
Click **Run now**. There is no confirmation modal; the button shows **Running…** while it sends the request. The message **Audit ingestion queued. The history updates when it starts.** confirms it. If an ingestion is already running: **An audit ingestion is already running for this organization.** While the collection service has not picked up the run, the button shows **Queued** and the card says *Run queued, waiting to start…*; then the button changes to **In progress** and the bar shows the processed items (for example, *12 of 40*) and the estimated time left (*\~3 min left*). The screen tracks the run until it finishes, without reloading.
{% endstep %}
{% step %}
### Follow
The row appears as **Running** and the **Ingestion in progress** badge is displayed. While the ingestion runs, the table is updated automatically every 20 seconds.
{% endstep %}
{% step %}
### Check
With the **Completed** status, check **Events** and **Windows With Errors**. The new events appear in [Audit › Events Overview](/en/power-monitor/auditoria/geral-de-eventos.md).
{% endstep %}
{% endstepper %}
**How it works / rules:** the button appears only for **Administrators** and works even with automatic collection turned off. There is only one ingestion per organization at a time. The same trigger can be done through the ▶ of the **Audit** type in [Scan Logs](/en/power-monitor/mapeamento/logs-de-scans-e-re-execucoes.md).
### Ingestion in progress badge and bar
**What it is:** the **Ingestion in progress** badge, next to the button, and an animated progress bar above the table, displayed while a run is in progress.
**What it is for:** know, without reading the table, that a collection is under way (and that a new trigger would be refused).
**How to use:** just observe. The bar does not show a percentage, because the total number of events is only known at the end of the collection.
### Ingestion history
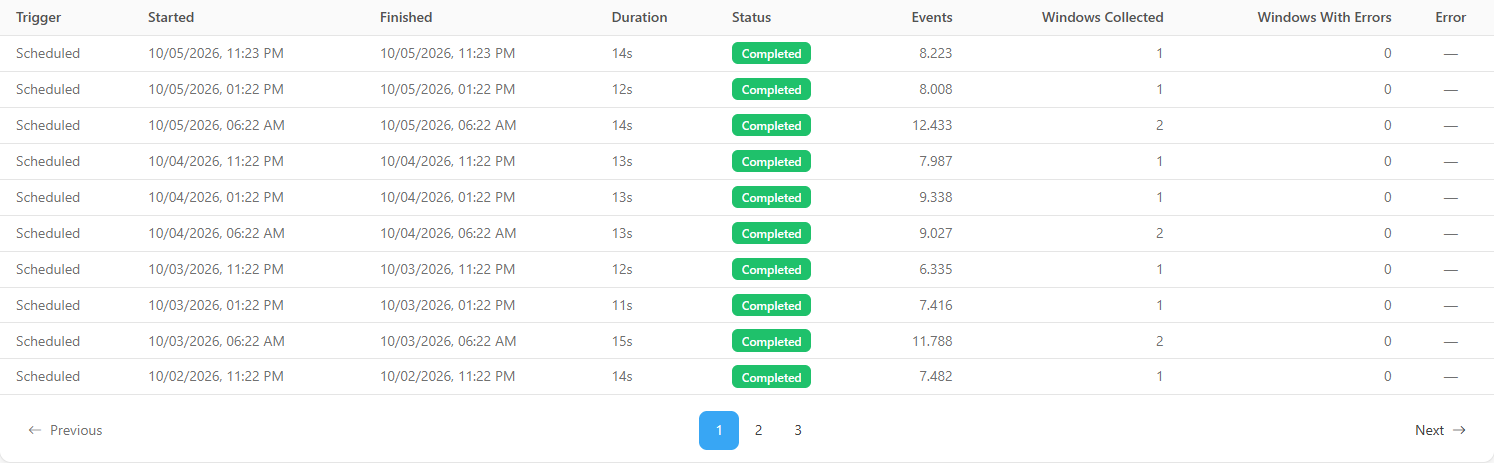
**What it is:** a paginated table with the ingestion runs, from most recent to oldest (10 per page; the **Items per page** selector below the table offers 10, 25, 50 or 100).
**What it is for:** confirm that the automatic collections are running, how many events each one brought and whether any period was left uncollected.
Ingestion history
| Column | Content |
| ----------------------------------------- | --------------------------------------------------------------------------------------------------------------------------- |
| **Trigger** | **Scheduled** or **Manual** (for manual runs, hover over the person icon to see who triggered it; old runs may show a dash) |
| **Started** / **Finished** / **Duration** | Run times |
| **Status** | **Running** (blue), **Completed** (green), **Failed** (red) |
| **Events** | Number of events collected |
| **Windows Collected** | Periods collected successfully |
| **Windows With Errors** | Periods that failed; **View failures** link |
| **Error** | Icon with the general error message (hover to read it) |
**How to use:**
1. Locate the run by the **Started** column.
2. If **Windows With Errors** is greater than zero, click **View failures**.
3. For a general error, hover over the icon in the **Error** column.
4. Navigate through the pages with **Previous**, **Next** or the numbers below the table, and use **Items per page** to see more rows.
**How it works / rules:** while an ingestion is in progress, the table is updated every 20 seconds. With no runs, the table shows the empty history message.
### View failures (windows with errors)
**What it is:** a link in the **Windows With Errors** column that opens the **Failures for the {date} run** modal ("Windows that failed during this ingestion."), with the period of each window (for example, "2026-09-20 00:00 → 2026-09-21 00:00") and the reason.
**What it is for:** find out which periods were left without events and why, to decide whether it is enough to wait for the next run or whether a permission needs to be fixed.
**How to use:**
1. On the run, click **View failures** next to **Windows With Errors**.
2. Read the period and reason for each window.
3. Click **Close**. In most cases the error is transient: the next run fetches the period again. If the error repeats in every run, check the Service Principal's permission.
**How it works / rules:** if the run did not store the details, **No detail available for this run.** appears; with many windows, the end of the list shows **and n more not listed**.
## Rules and behavior
* **Where the data comes from:** Power BI Admin API for activity events, with the organization's Service Principal.
* **Automatic frequency:** **three times a day**, at **01:23**, **08:23** and **18:23** (Brasília time, UTC-3), incrementally, as long as automatic collection is enabled. The switch that turns it on and off is in two places, which read and write the same setting: *Settings › Audit* (**Enable automatic activity log collection**) and *Settings › Monitoring*, **Audit, security and compliance** section (**Power BI activity log collection**). This collection has no **Frequency** selector: the Daily/Weekly/Monthly option exists only for the monitorings that run once a day. New organizations already start with collection enabled. When you turn on the toggle, an ingestion is triggered immediately.
* **Collection window:**
* on the first collection (or after a long period without collecting), Power Monitor fetches the **last 27 days**. Microsoft makes only the last 30 days of events available; older periods cannot be recovered;
* on subsequent collections, it fetches from the last collected point (with a 60-minute overlap, without duplicating events) up to the current moment;
* the collection is split into windows of at most one day (the API requires start and end on the same UTC day).
* **Partial failure:** a window that fails does not bring down the run, which ends **Completed** if at least one window succeeded. The checkpoint only advances when no window fails, so the next run fetches the failed period again.
* **Rate limit:** in case of a Microsoft rate limit (429), the collection waits and retries a few times before marking the window as failed.
* **Discarded events:** events generated by Power Monitor itself when reading the environment and data source credential queries are not stored.
* **Access validation:** before collecting, Power Monitor runs a short test query. If it fails, the run ends as **Failed** ("API access validation failed").
* **Stuck:** a run that stays in progress for more than 4 hours is closed as **Failed**.
* **Concurrency:** one ingestion per organization at a time.
### Required permission
Tenant setting **Service principals can access read-only admin APIs**, enabled for a security group that contains the Service Principal.
## How to use
### How to enable or disable automatic collection
1. Go to *Settings › Audit* (or *Settings › Monitoring*, **Audit, security and compliance** section).
2. Turn **Enable automatic activity log collection** on or off (in Monitoring, **Power BI activity log collection**). The Audit screen shows the **Last collection**.
3. When you turn it on, an ingestion starts immediately.
## Common errors and how to resolve them
| Message / symptom | How to resolve |
| --------------------------------------------------------------------- | ------------------------------------------------------------------------------------------------------------------------------------------- |
| **API access validation failed** | Check the read-only admin APIs tenant setting, whether the Service Principal is in the allowed group and whether the credentials are valid. |
| **AppId/AppSecret not configured** / **Failed to obtain OAuth token** | Review the Service Principal's App ID and secret. |
| **All windows failed during ingestion** | All windows failed; check the reason in **View failures** and the Service Principal's permission. |
| **Windows With Errors** greater than zero | Usually transient; the next run redoes the period. |
| No automatic run | Enable collection in *Settings › Audit* (or in *Settings › Monitoring*). |
| Events older than 30 days missing | Microsoft limitation: events older than 30 days cannot be recovered. Keep automatic collection turned on. |
## Frequently asked questions
With what delay do events appear in Power Monitor?
Events are collected three times a day (01:23, 08:23 and 18:23, Brasília time). In addition, Microsoft itself may take some time to make recent events available. To bring in the newest events right away, use **Run now**.
I installed Power Monitor today. Will I have the audit history?
Yes, for the last 27 days, which the first collection fetches automatically. Earlier periods are no longer available at Microsoft.
## Related pages
* [Audit](/en/power-monitor/auditoria.md)
* [Events Overview](/en/power-monitor/auditoria/geral-de-eventos.md)
* [Report Access Dashboard](/en/power-monitor/dashboards/dashboard-de-visualizacoes.md)
* [Scan Logs](/en/power-monitor/mapeamento/logs-de-scans-e-re-execucoes.md)
* [Settings › Audit](/en/power-monitor/configuracoes/auditoria.md)
* [Settings › Monitoring](/en/power-monitor/configuracoes/monitoramento.md#audit-security-and-compliance)
---
# Agent Instructions
This documentation is published with GitBook. GitBook is the documentation platform designed so that both humans and AI agents can read, navigate, and reason over technical content effectively. Learn more at gitbook.com.
## Querying This Documentation
If you need additional information that is not directly available in this page, you can query the documentation by asking a question.
Perform an HTTP GET request on the following URL with the `ask` and `goal` query parameters:
```
GET https://docs.powermonitor.com.br/en/power-monitor/mapeamento/auditorias.md?ask=&goal=
```
`ask` is the immediate question: it should be specific, self-contained, and written in natural language.
`goal` is what the user is ultimately trying to achieve, the reason they need the answer. Sharing it helps GitBook give you a better, more relevant answer. A goal is most helpful when it describes the outcome the user wants rather than restating the question. For example, with `ask=how do I create an API token`, a goal like `automate deployments from our CI pipeline` lets GitBook tailor the answer to that use case.
The response will contain a direct answer to the question and relevant excerpts and sources from the documentation.
Use this mechanism when the answer is not explicitly present in the current page, you need clarification or additional context, or you want to retrieve related documentation sections.