> For the complete documentation index, see [llms.txt](https://docs.powermonitor.com.br/llms.txt). Markdown versions of documentation pages are available by appending `.md` to page URLs; this page is available as [Markdown](https://docs.powermonitor.com.br/en/power-monitor/mapeamento/estrutura-de-relatorios.md).
# Report Structure
Track and trigger the daily capture of report structure (pages, visuals and fields used) and of the lineage of Dataflows Gen2 and Copy Jobs.
The **Report Structure** collection reads the definition of each Power BI report and records **pages**, **visuals** (and the type of each visual), **fields used** (tables, columns, measures and hierarchies), sort and conditional formatting fields, and report, page and visual **filters**. In the same execution, it also reads the definition of **Dataflows Gen2** and **Copy Jobs** to link them to the Lakehouses and Warehouses they read from and write to.
**How to access:** *Mapping › Models and reports › Report Structure* (page title: **Report Structure Capture**). Only **Administrators** can access the screen and its actions.
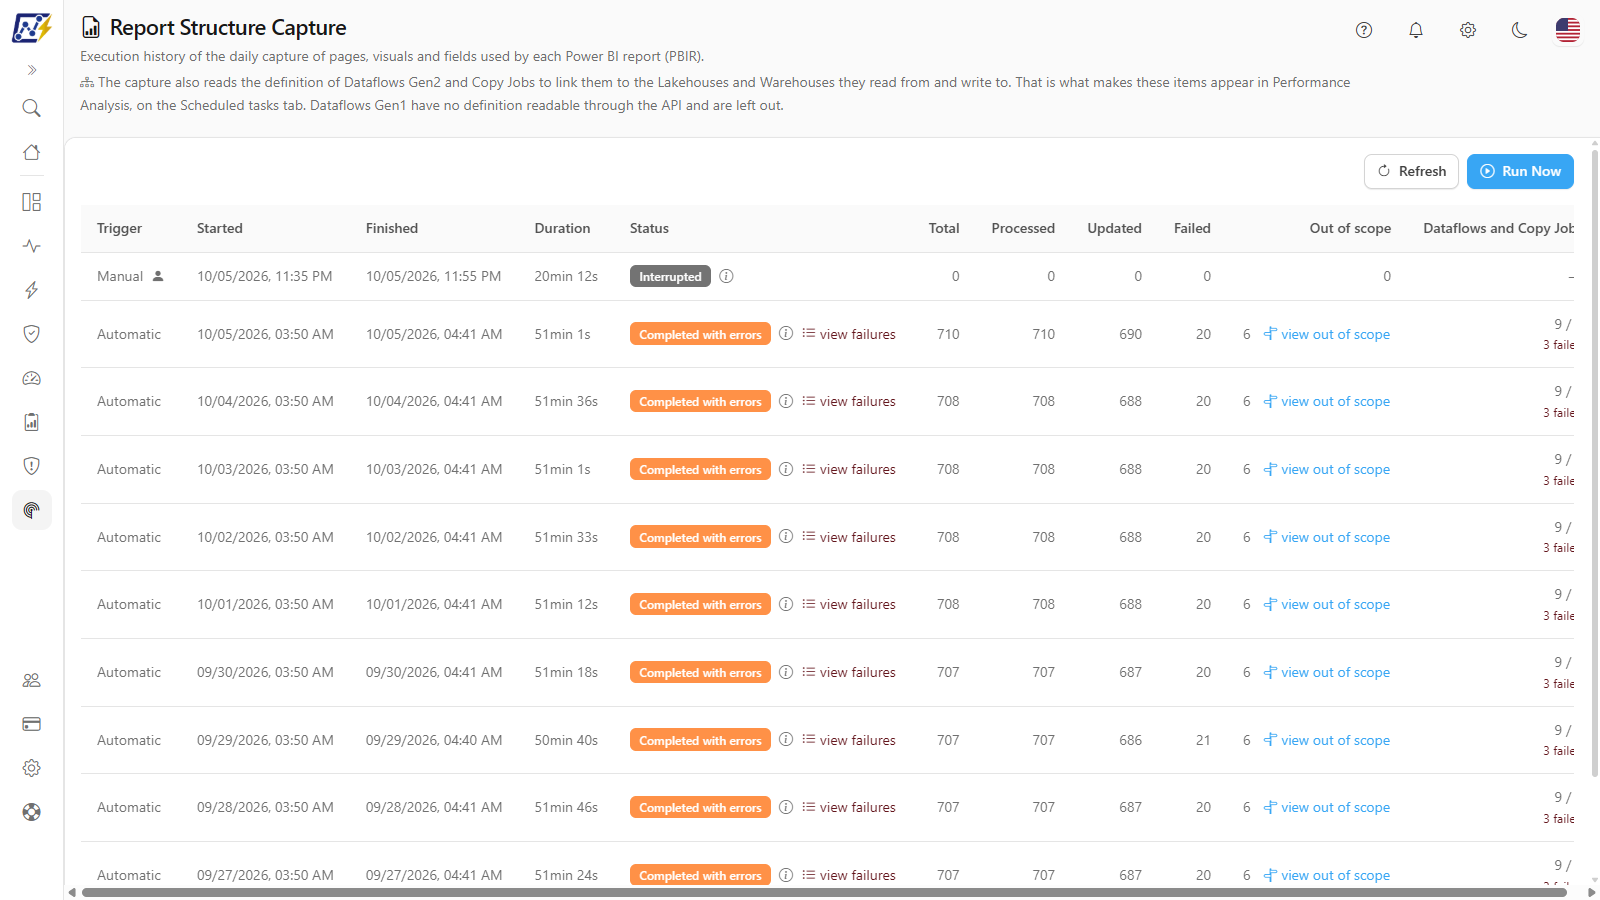
Report Structure
## What it is for
* Find out which columns and measures of a model are actually used by reports, the basis for model cleanup.
* View the structure (pages, visuals, filters) of each report without opening it.
* Make Dataflows Gen2 and Copy Jobs appear in the lineage and in Performance Analysis.
* Check which reports could not be read and which workspaces are out of the Service Principal's reach.
## Features
The screen has seven features: **Refresh**, **Run Now**, the executions table (with the two progress phases), the **Dataflows and Copy Jobs** column, the **Stop** button, the **view failures** modal and the **view out of scope** modal. Below the title, a note reminds you that the capture also reads Dataflows Gen2 and Copy Jobs and that Dataflows Gen1 are left out.
Screen action buttons
### Refresh
**What it is:** button that reloads the executions table.
**What it is for:** view the latest result without reloading the page.
**How to use:** click **Refresh**. While an execution is in progress, the table already refreshes automatically.
### Run Now
**What it is:** button that triggers an immediate manual capture of reports, Dataflows Gen2 and Copy Jobs.
**What it is for:** update the structure of newly published reports or include workspaces you have just given the Service Principal access to, without waiting for the nightly execution.
**How to use:**
{% stepper %}
{% step %}
### Open the screen
Go to *Mapping › Models and reports › Report Structure* as an **Administrator**.
{% endstep %}
{% step %}
### Trigger it
Click **Run Now**. There is no confirmation modal; the button shows **Starting...** and the message **Report structure capture started.** confirms it. If an execution is already running: **A report structure capture is already in progress for this organization.**
{% endstep %}
{% step %}
### Follow the two phases
The **Running** row shows the current phase, the progress bar and the live duration. The table refreshes on its own.
{% endstep %}
{% step %}
### Check the result
Review **Failed**, **Out of scope** and **Dataflows and Copy Jobs**. Then open a report in *Governance › Reports* and check the **Report Structure** tab.
{% endstep %}
{% endstepper %}
**How it works / rules:** one execution per organization at a time; the manual trigger works even when the automatic execution is turned off.
### Executions table
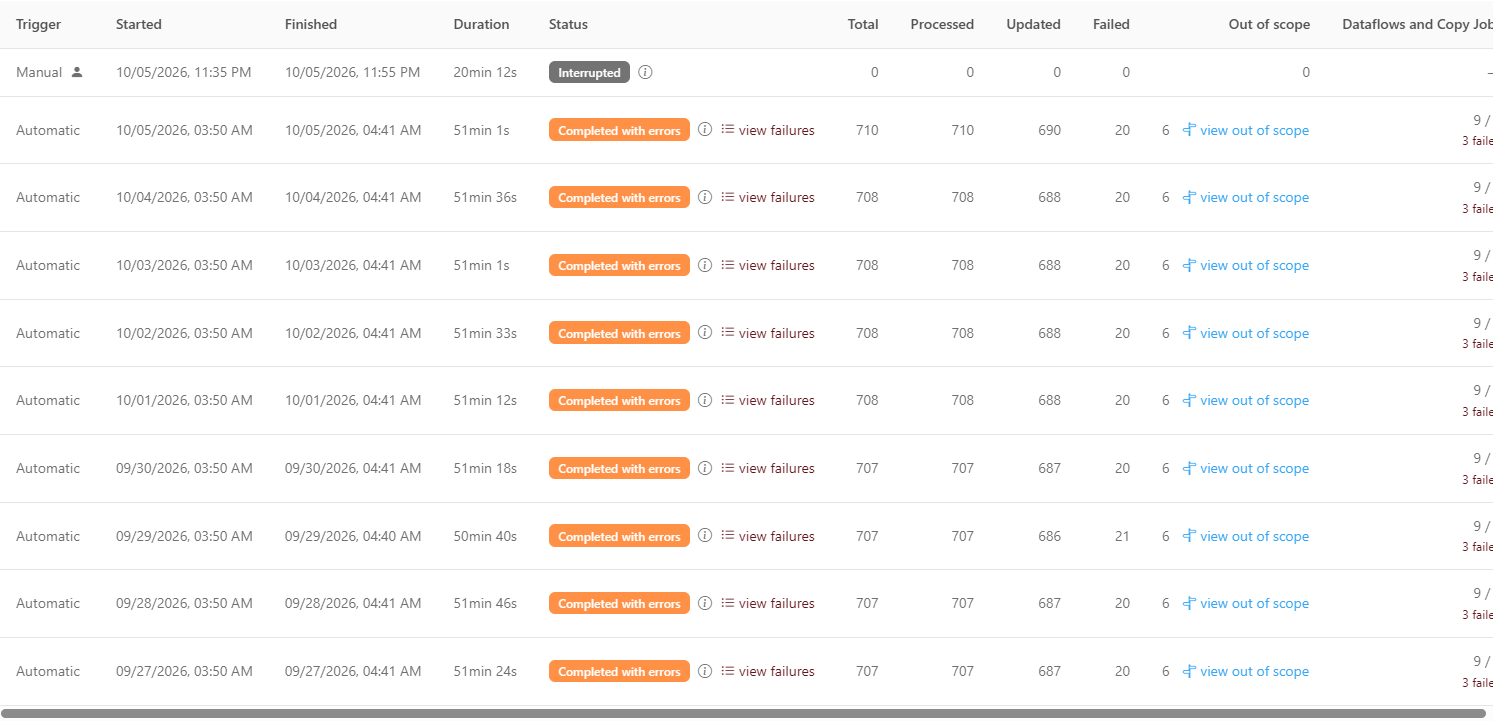
**What it is:** paginated table (10 per page by default; the **Items per page** selector in the footer lets you choose 10, 25, 50 or 100) with the capture executions, from newest to oldest.
**What it is for:** confirm that the capture ran, how many reports were read, how many failed and how many are out of the Service Principal's reach.
Executions table
| Column | Content |
| ----------------------------------------- | -------------------------------------------------------------------------------------------------------------------------------------------------------------------------------------------- |
| **Trigger** | **Automatic** or **Manual** |
| **Started** / **Finished** / **Duration** | Times; the duration is updated live |
| **Status** | **Running**, **Completed**, **Completed with errors**, **Failed**, **Canceled**, **Interrupted** (same colors as the [Model Mapping](/en/power-monitor/mapeamento/mapeamento-de-modelos.md)) |
| **Total** | Reports eligible in this execution |
| **Processed** | Reports read; during the execution, a bar shows the phase (**Phase: Reports** or **Phase: Dataflows and Copy Jobs**), the progress "processed / total (%)" and the estimated time remaining |
| **Updated** | Reports whose structure was captured successfully |
| **Failed** | Items that failed (reports, Dataflows and Copy Jobs); **view failures** link |
| **Out of scope** | Reports in workspaces the Service Principal cannot reach; **view out of scope** link |
| **Dataflows and Copy Jobs** | Result of the lineage phase (see the next feature) |
**How to use:**
1. Find the execution by the **Started** column.
2. Compare **Total**, **Updated**, **Failed** and **Out of scope** to assess coverage.
3. Navigate through pages with **Previous**, **Next** or the numbers below the table.
**How it works / rules:** with no executions, **No executions yet.** is displayed.
### Dataflows and Copy Jobs column (lineage phase)
**What it is:** column that shows "processed / total" for the second phase of the capture, which reads Dataflows Gen2 and Copy Jobs. When there are failures, **n failed** is also shown.
**What it is for:** confirm that Dataflows Gen2 and Copy Jobs were linked to Lakehouses and Warehouses, which makes them appear in the lineage and on the **Scheduled tasks** tab of Performance Analysis.
**How to use:**
1. Hover over the value to see how many were updated and how many failed ("n updated, n failed").
2. If a dash is displayed, hover over it to read **No data: the Dataflows and Copy Jobs phase did not run in this execution or has not started yet.**
### Stop an execution
**What it is:** **Stop** button that appears only on the **Running** row.
**What it is for:** interrupt a long capture triggered at an inconvenient time.
**How to use:**
1. Click **Stop** on the running row.
2. Confirm in **Stop the run?**.
3. The message **Stop request sent.** confirms it; the execution becomes **Canceled** at the end of the current batch.
### view failures (failures modal)
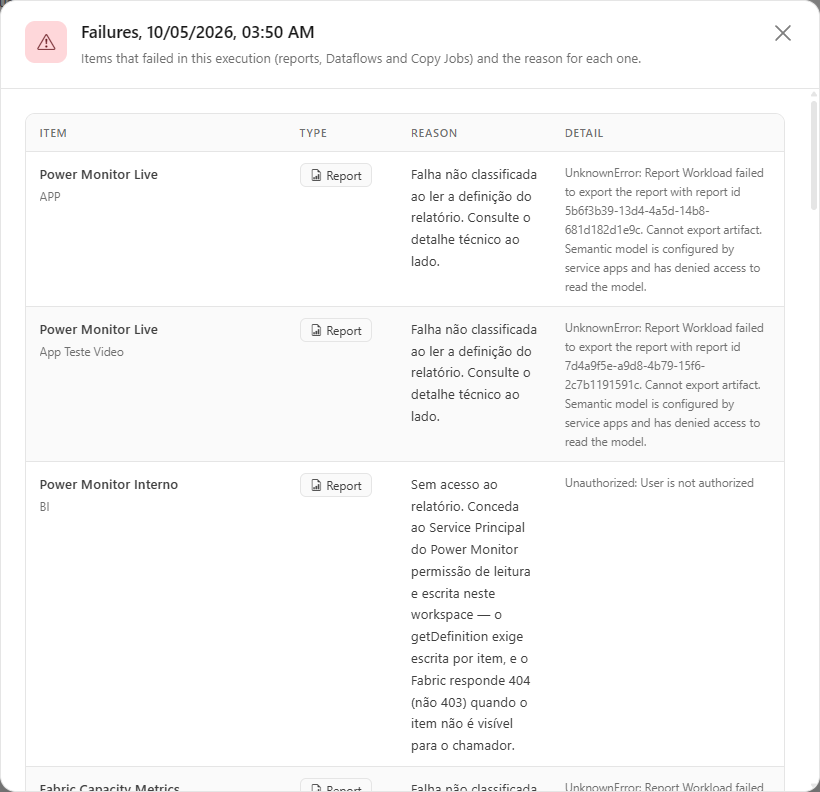
**What it is:** link in the **Failed** column that opens the **Failures, {date}** modal, with the columns **Item**, **Type** (**Report**, **Dataflow**, **Copy Job**), **Reason** and **Detail**.
**What it is for:** find out why a report has no captured structure or why a Dataflow Gen2 does not appear in the lineage.
Items that failed in an execution
**How to use:**
1. Click **view failures** on the execution.
2. Check the item's **Type** and read **Reason** and **Detail**.
3. Fix it according to [Common errors and how to fix them](#common-errors-and-how-to-fix-them) and run again.
**How it works / rules:** when there are many failures, the end of the list shows **… and n more failure(s) not listed**.
### view out of scope (Out of scope modal)
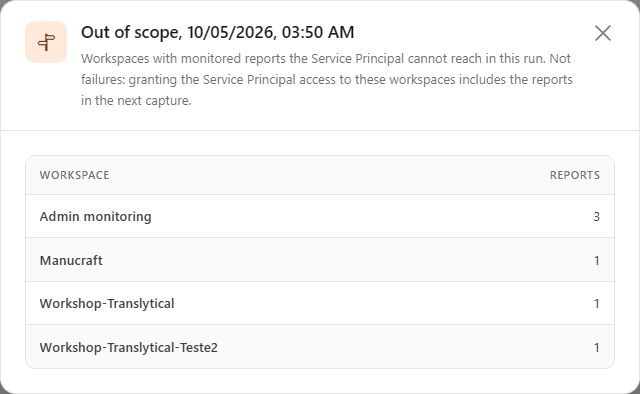
**What it is:** link in the **Out of scope** column that opens the **Out of scope, {date}** modal, with the workspaces that have monitored reports but that the Service Principal cannot reach, and the number of **Reports** in each one.
**What it is for:** know exactly which workspaces to add the Service Principal to in order to expand coverage. These reports **are not failures**: granting access includes them in the next capture.
Workspaces out of the Service Principal's reach
**How to use:**
1. On the execution, click **view out of scope**.
2. Note the workspaces listed.
3. Add the Service Principal as **Contributor** (or higher) in those workspaces, or use **Add Service Principal** in the [Inventory](/en/power-monitor/mapeamento/inventarios.md#add-service-principal-to-workspaces).
4. Click **Run Now** or wait for the daily execution.
**How it works / rules:** with no workspaces out of reach, the modal shows **No workspace out of scope in this run.**
## Rules and behavior
* **Where the data comes from:** Fabric API for reading the item definition (*getDefinition*). For reports, Power Monitor first tries the enhanced format (**PBIR**) and, if the report cannot be exported in that format, tries the classic format.
* **Automatic frequency:** daily at **22:50** (Brasília time, UTC-3) by default. In *Settings › Monitoring › Scans and Collections*, **Enrichment** group (**Report Structure**), you can turn the scan off or choose the **Frequency** **Daily**, **Weekly** or **Monthly**. With the weekly and monthly frequencies, the automatic run happens on a day distributed per organization, and the setting shows the **Next expected run** and the **Last run**. **Run Now** is not affected by the frequency and works even with the scan turned off.
* **Which items are included:**
* Power BI reports (not paginated) from **monitored**, non-deleted workspaces that the Service Principal can reach;
* Dataflows **Gen2** and Copy Jobs. Dataflows Gen1 have no definition readable through the API and are left out of this capture (they are read by the **Notebook, pipeline and dataflow dependencies** scan, see [Data Lineage](/en/power-monitor/qualidade-de-dados/linhagem-de-dados.md#how-dependencies-are-collected)).
* **Two phases:** first the reports, then Dataflows Gen2 and Copy Jobs. The final status considers both phases.
* **Processing:** batches of 50 items, up to 10 reads in parallel. An execution with no sign of activity for 20 minutes is marked as **Interrupted**.
* **Workspace without access:** after 5 consecutive access denials in a workspace with no success, the remaining reports of that workspace in the same batch are not attempted.
* **Stop:** the stop is applied at the end of the batch in progress.
* **Concurrency:** one execution per organization at a time.
* **Protected copy and reapplying without querying Fabric:** for each report read, Power Monitor stores a protected copy of the definition (compressed, with secrets masked, isolated per organization, never displayed or sent to AI). At the start of each run, daily or manual, the newer reading rules are reapplied to that copy **without calling Fabric**, and only then is what is missing read from Fabric. Reports rebuilt this way count in **Processed**, and the structure date remains that of the last real read of the report. The copy is replaced when the report changes and removed when the report is deleted or the workspace stops being monitored. If a report's copy could not be stored (for example, because of its size), the structure is read normally on every run.
### Where the data appears
* [Governance › Reports](/en/power-monitor/governanca/relatorios.md), **Report Structure** tab of the detail view: counters for **Pages**, **Visuals**, **Tables**, **Columns**, **Measures** and **Filters**, and the per-page table (**Page**, **Visuals**, **Page filters**, **Visual types**).
* [Model Cleanup](/en/power-monitor/performance/limpeza-de-modelo.md) (columns and measures not used by any report).
* Report Best Practices Score (rules on pages and visuals). When the structure has not been captured yet, the score screen warns about it and, for administrators, shows the **Open structure capture** link, which leads to this screen. When the structure was read by an earlier version of the reader, the screen shows the banner *structure captured at version X (current: Y)* with the date of the last capture (see [Outdated structure and reapplying without querying Fabric](/en/power-monitor/qualidade-de-dados/score-de-boas-praticas-de-relatorios.md#outdated-structure-and-reapplying-without-querying-fabric)).
* Lineage of Dataflows Gen2 and Copy Jobs with Lakehouses and Warehouses, and the **Scheduled tasks** tab of Performance Analysis.
### Required permissions
The Service Principal must be a **member with write permission** (**Contributor** role or higher) in each workspace, because Microsoft requires write permission on the item to read its definition. Use **Add Service Principal** in the [Inventory](/en/power-monitor/mapeamento/inventarios.md#add-service-principal-to-workspaces).
## Common errors and how to fix them
| Reason | How to fix |
| --------------------------------------------------------------------------------------------------------------------------------------- | -------------------------------------------------------------------------------------------------------------------- |
| **No access to the report** | Grant the Service Principal the **Contributor** role (or higher) in the workspace. |
| **This report does not support reading its definition** (internal report, automatically generated, or in a Microsoft-managed workspace) | No action is required. |
| **Report with an encrypted sensitivity label** | Microsoft does not export the definition of reports protected by a label with encryption. |
| **Fabric API rate limit (429)** | Transient; the item is read again in the next execution. |
| Failure to export the definition in both formats (enhanced and classic) | Open and save the report in Power BI Desktop or in the service and run again. |
| Dataflow Gen2 with failure | Dataflows Gen2 created before Git/CI-CD support may not have a readable definition; recreate or update the dataflow. |
| **Could not obtain the Service Principal token** | Review the Service Principal credentials. |
## Frequently asked questions
A report shows "This report's structure has not been captured yet".
The capture runs daily at night. If the report already existed before the last execution, check whether the workspace is in **Out of scope** or whether the report appears in **view failures**.
Are paginated reports captured?
No. Only Power BI reports (interactive report format).
Do I need to convert my reports to the PBIR format?
No. Power Monitor tries the PBIR format and, if that is not possible, reads the classic format.
Why is the structure date old if the capture ran today?
When a new reading rule is released, the capture reapplies it from the protected copy of the definition, without querying Fabric again. The date shown is that of the last real read of the report: if it has not changed since then, it does not change, even if the structure is already at the current version.
Does Power Monitor store the content of my reports?
It stores a protected copy of each report's definition (pages, visuals, fields, and filters), compressed and isolated per organization, with secrets masked. It is used only to reapply the structure reading, is never displayed, and is not sent to AI. If your organization has internal or contractual rules about this kind of access, check with the people responsible; for questions about data handling, see the [Privacy Policy](/en/useful-links/politica-de-privacidade.md) and the Terms of Use accepted at installation.
## Related pages
* [Governance › Reports](/en/power-monitor/governanca/relatorios.md)
* [Data Lineage](/en/power-monitor/qualidade-de-dados/linhagem-de-dados.md)
* [Model Mapping](/en/power-monitor/mapeamento/mapeamento-de-modelos.md)
* [Inventory](/en/power-monitor/mapeamento/inventarios.md)
---
# Agent Instructions
This documentation is published with GitBook. GitBook is the documentation platform designed so that both humans and AI agents can read, navigate, and reason over technical content effectively. Learn more at gitbook.com.
## Querying This Documentation
If you need additional information that is not directly available in this page, you can query the documentation by asking a question.
Perform an HTTP GET request on the following URL with the `ask` and `goal` query parameters:
```
GET https://docs.powermonitor.com.br/en/power-monitor/mapeamento/estrutura-de-relatorios.md?ask=&goal=
```
`ask` is the immediate question: it should be specific, self-contained, and written in natural language.
`goal` is what the user is ultimately trying to achieve, the reason they need the answer. Sharing it helps GitBook give you a better, more relevant answer. A goal is most helpful when it describes the outcome the user wants rather than restating the question. For example, with `ask=how do I create an API token`, a goal like `automate deployments from our CI pipeline` lets GitBook tailor the answer to that use case.
The response will contain a direct answer to the question and relevant excerpts and sources from the documentation.
Use this mechanism when the answer is not explicitly present in the current page, you need clarification or additional context, or you want to retrieve related documentation sections.