> For the complete documentation index, see [llms.txt](https://docs.powermonitor.com.br/llms.txt). Markdown versions of documentation pages are available by appending `.md` to page URLs; this page is available as [Markdown](https://docs.powermonitor.com.br/en/power-monitor/mapeamento/gateways.md).
# Gateways
Track and trigger the collection of the data gateway inventory and grant the Service Principal access to gateways and connections.
The **Gateways** collection brings the inventory of data gateways (on-premises and personal) that the Power Monitor Service Principal has access to: name, type, version, machine, department and contact. This inventory feeds [Governance › Infrastructure › Gateways](/en/power-monitor/governanca/infraestrutura/gateways.md), [gateway monitoring](/en/power-monitor/monitoramento/gateways.md) and the check for outdated versions.
**How to access:** *Mapping › Inventory › Gateways* (page title: **Gateway Management**). Only **Administrators** can access the screen and see the action buttons.
Gateways
## What it is for
* Ensure that all gateways in the environment are inventoried.
* Give the Service Principal, in one go, administrator access to the gateways and access to the connections, a requirement for them to appear in Power Monitor.
* See, per execution, which gateways were created, updated (including version updates) or removed.
## Features
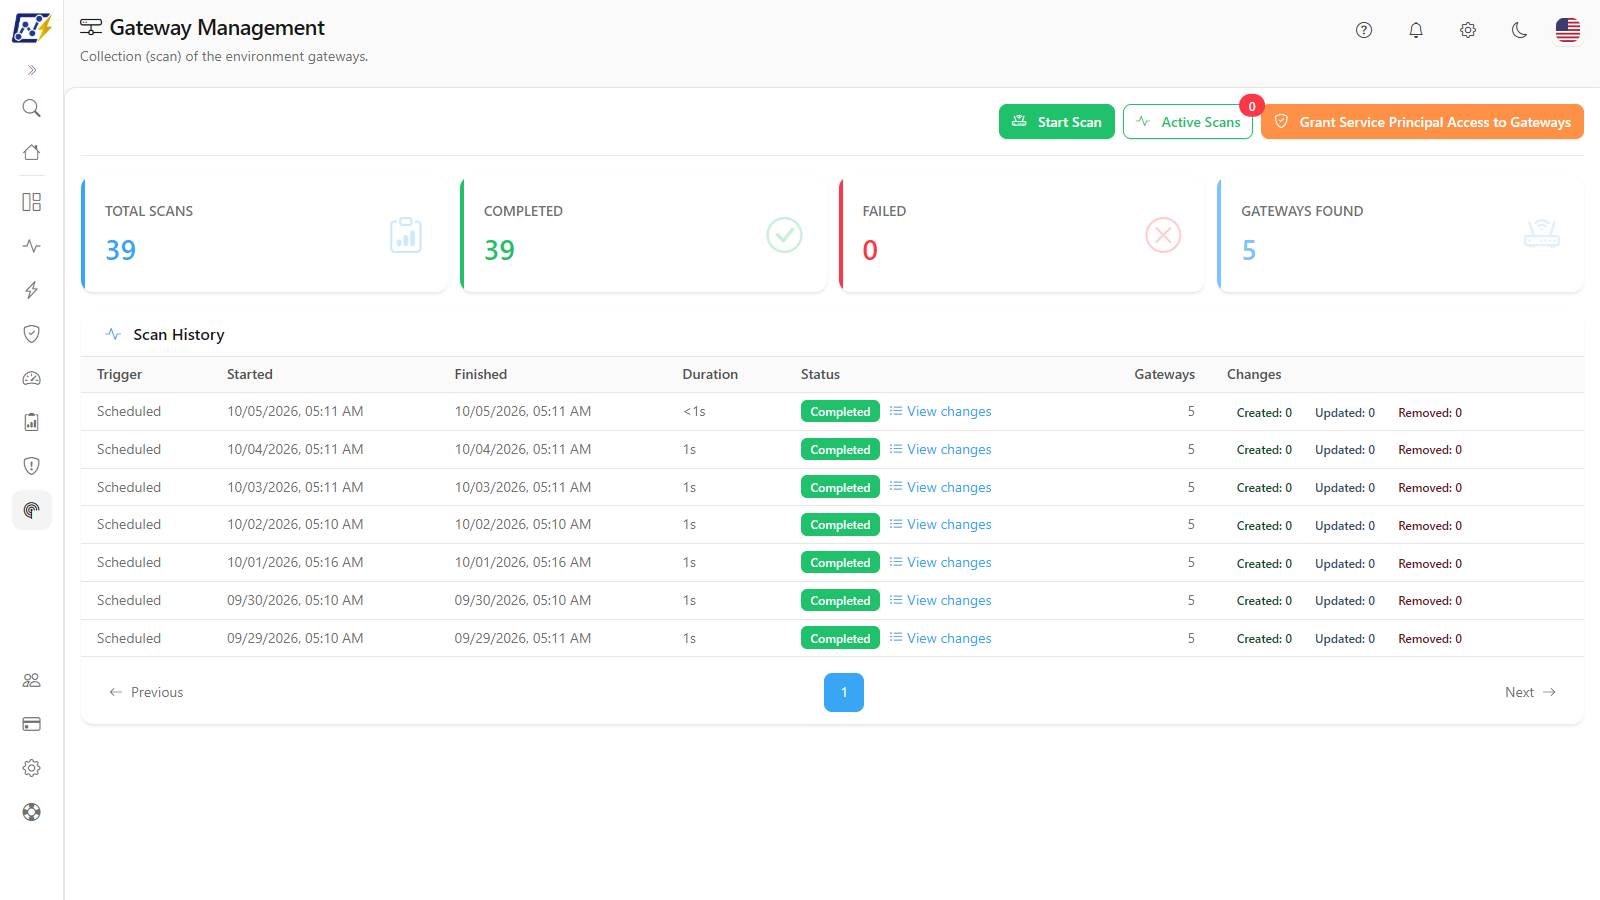
The screen has six features: **Start Scan**, **Active Scans**, **Grant Service Principal Access to Gateways** (with the result notice), the execution cards, the **Scan History** and the **View changes** modal.
### Start Scan (manual collection)
**What it is:** button that immediately triggers a collection of the gateway inventory.
**What it is for:** bring into Power Monitor, without waiting for the daily execution, a gateway that was just installed, updated, or to which you have just granted the Service Principal access.
Screen action buttons
**How to use:**
1. Click **Start Scan**. There is no confirmation modal: the button shows **Starting scan...** and the message **Gateway scan started successfully.** confirms the request.
2. Follow it in **Active Scans** or wait for the **Scan History** row to become **Completed**.
3. Check the **Gateways Found** card and the **Changes** column.
**How it works / rules:**
* The action buttons appear only for **Administrators**.
* The manual trigger works even with the automatic run turned off, or set to weekly or monthly, in *Settings › Monitoring › Scans and Collections* (**Gateway Inventory**).
* One execution at a time per organization; 30-minute timeout and up to 3 attempts in case of failure.
### Active Scans (real-time tracking)
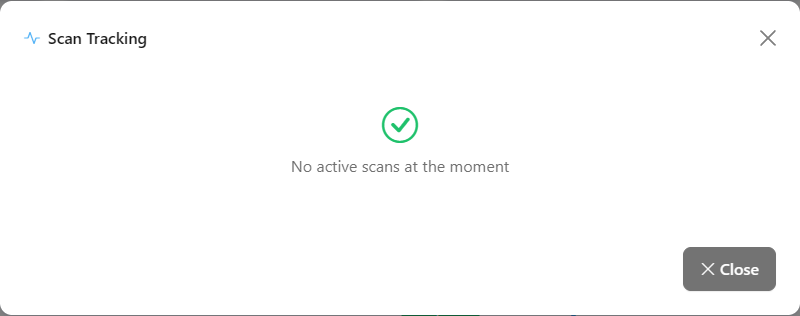
**What it is:** button that opens the **Scan Tracking** modal with the gateway scans you triggered. The red badge shows how many are running.
**What it is for:** follow the progress of the scan you just triggered without having to reload the page.
Scan Tracking modal
**How to use:**
1. Click **Active Scans**.
2. See the status, the time since start, the current step and the progress bar of each scan.
3. Click **Close**.
**How it works / rules:** the modal lists only the scans triggered by you **in this browser session**. Automatic executions appear in the **Scan History** and in [Scan Logs](/en/power-monitor/mapeamento/logs-de-scans-e-re-execucoes.md). With no scans in progress, **No active scans at the moment** is displayed.
### Grant Service Principal Access to Gateways
**What it is:** action that gives the Power Monitor Service Principal the administrator role on the gateways that **you** can see and access to the connections, with a notice that summarizes the result of the grant.
**What it is for:** the gateways API only returns the gateways on which the Service Principal is an administrator. Without this grant, the scan ends with 0 gateways or with missing gateways. Do this during installation and whenever new gateways or connections are created.
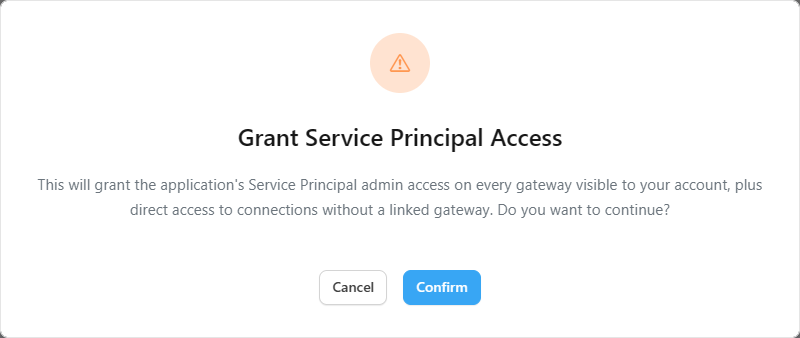
Access grant confirmation
**How to use:**
{% stepper %}
{% step %}
### Use an account with access to the gateways
Sign in to Power Monitor with an **Administrator** who is also a **gateway administrator** in Power BI / Fabric. The grant only reaches the gateways and connections your account can see.
{% endstep %}
{% step %}
### Click the grant button
In *Mapping › Inventory › Gateways*, click **Grant Service Principal Access to Gateways**.
{% endstep %}
{% step %}
### Confirm
The **Grant Service Principal Access** modal explains that the Service Principal will receive administrator access on all gateways visible to your account, plus direct access to connections without a linked gateway. Click **Confirm**. If Microsoft asks for consent, complete it in the window that opens. While processing, the button shows **Granting access...**.
{% endstep %}
{% step %}
### Read the result
A **Service Principal access grant completed** notice appears at the top of the screen and shows, for **Gateways** and **Connections**, how many were **granted**, how many were **already granted**, how many **failed** and how many were **rate-limited**. If there is nothing to grant, the message says that no eligible gateway or connection was found under your access. Close the notice with the **X** whenever you want.
{% endstep %}
{% step %}
### Run the scan
Click **Start Scan** so that the gateways start appearing in the inventory.
{% endstep %}
{% endstepper %}
**How it works / rules:**
{% hint style="info" %}
The Service Principal receives the **Administrator** role on each gateway and the **User** role on each connection that does not belong to one of those gateways (including cloud connections). If the list of gateways or connections comes back incomplete, nothing is granted and you can try again.
{% endhint %}
* Running the grant again is safe: what was already granted appears as "already granted".
* The grant also unlocks the connections used by the [Governance › Infrastructure › Connections](/en/power-monitor/governanca/infraestrutura/conexoes.md) inventory.
### Execution cards
**What it is:** four cards that summarize the scan's **execution history** (not the state of the gateways).
**What it is for:** quickly see whether collections are failing and how many gateways the last collection found.
Gateway scan execution cards
| Card | Meaning |
| ------------------ | -------------------------------------------------------- |
| **Total Scans** | Number of recorded executions |
| **Completed** | Executions completed successfully |
| **Failed** | Executions that failed |
| **Gateways Found** | Gateways returned by the most recent completed execution |
**How to use:** the cards are informational (not clickable). If **Failed** grows, open the **Scan History** to read the error. The online/offline status of each gateway is in [Monitoring › Gateways](/en/power-monitor/monitoramento/gateways.md).
### Scan History
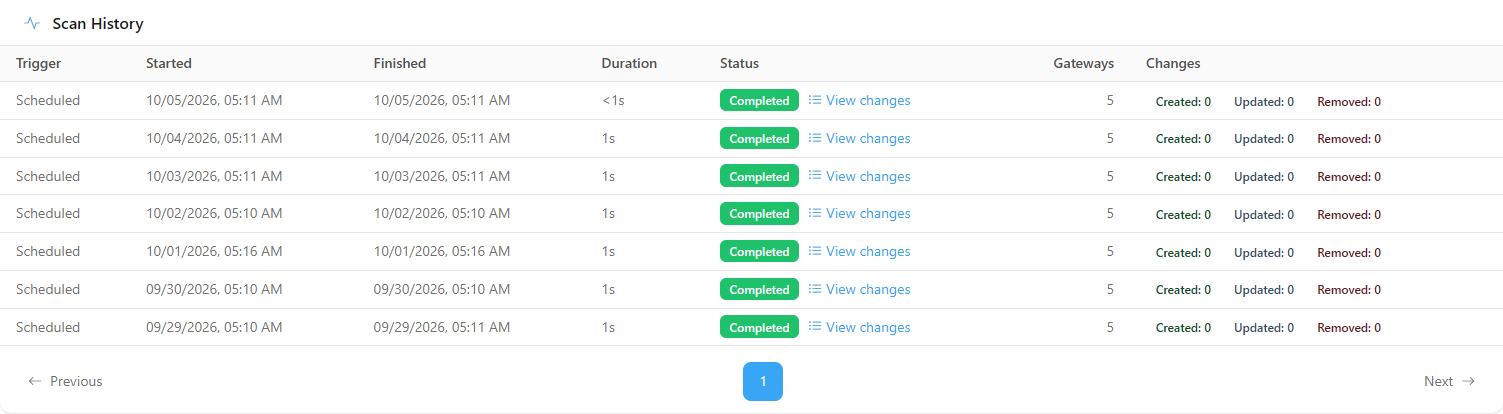
**What it is:** paginated table with the scan executions, from newest to oldest (10 per page; the **Items per page** selector below the table offers 10, 25, 50 or 100).
**What it is for:** confirm that the daily collection ran, how long it took, how many gateways it returned and whether there was a failure.
Scan History
| Column | Content |
| ----------------------------------------- | ------------------------------------------------------------------------------------------------------- |
| **Trigger** | **Scheduled** or **Manual** (for manual executions, hover over the person icon to see who triggered it) |
| **Started** / **Finished** / **Duration** | Execution times and duration |
| **Status** | **Pending** (gray), **Running** (blue, with an animated bar), **Completed** (green), **Failed** (red) |
| **Gateways** | Number of gateways returned |
| **Changes** | **Created: n**, **Updated: n** and **Removed: n** badges |
**How to use:**
1. Find the execution by the **Started** column.
2. On a **Failed** execution, hover over the ⓘ icon next to the status to read the error.
3. Navigate through pages with **Previous**, **Next** or the numbers below the table.
**How it works / rules:** with no recorded executions, the table shows the empty history message.
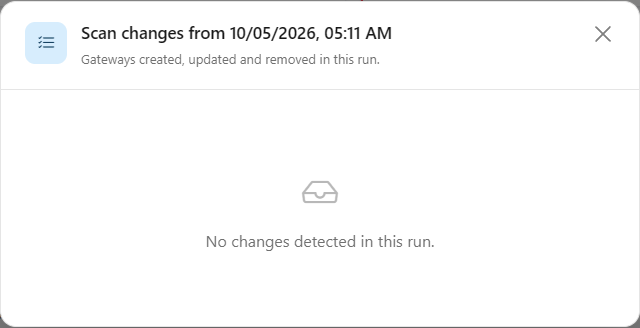
### View changes (execution changes modal)
**What it is:** link next to the status of each finished execution that opens the modal with the gateways **Created**, **Updated** and **Removed** in that execution.
**What it is for:** confirm that a new gateway entered the inventory, that a version update was captured, or find out why a gateway disappeared.
Gateways created, updated and removed in an execution
**How to use:**
1. In the **Scan History**, click **View changes** on the desired row.
2. Review **Created**, **Updated** and **Removed**.
3. Click **Close**.
**How it works / rules:**
* The link does not appear on **Running** executions.
* **Updated** indicates a change of name, type, public key or annotations (version, machine, department, contact). **A gateway version update appears as Updated.**
* **Removed:** a gateway that no longer appears in the list (it was uninstalled or the Service Principal lost the administrator role), as long as the list comes back complete and not empty. The history is preserved.
* **What the Service Principal cannot see counts as removed:** this is the expected behavior. Power Monitor only monitors the gateways where the Service Principal is an administrator and the connections it has access to. A gateway or connection outside that reach is treated as removed (connections show as deleted in [Deleted Artifacts](/en/power-monitor/governanca/operacao/artefatos-excluidos.md)) and shows up again in the next cycle, once access is granted again.
## Rules and behavior
* **Where the data comes from:** Power BI gateways API, called with the Service Principal. This API returns **only the gateways on which the Service Principal is an administrator**. That is why granting access is the first step.
* **Automatic frequency:** by default, once a day, at **00:00** (Brasília time, UTC-3). Under *Settings › Monitoring › Scans and Collections*, the **Gateway Inventory** card lets you turn off automatic collection and choose the **Frequency**: **Daily**, **Weekly** or **Monthly**. With weekly and monthly, the run happens on a day distributed per organization, and the card shows **Next expected run** and **Last run**. The manual trigger is not affected: it works with the toggle off and at any frequency.
* **Online/offline status** is a separate routine: it runs every 5 minutes, only when gateway monitoring is enabled, and queries each gateway already inventoried. See [Enable Gateway Monitoring](/en/power-monitor/monitoramento/gateways/ativar-monitoramento-de-gateways.md).
* **Versions and end of support:** Power Monitor synchronizes daily the catalog of monthly versions published by Microsoft and classifies each gateway as up to date, outdated or out of support (Microsoft supports only the last 6 versions). This classification appears in [Governance › Infrastructure › Gateways](/en/power-monitor/governanca/infraestrutura/gateways.md).
* **Attempts and timeout:** 30-minute timeout per execution, up to 3 attempts in case of failure, one execution at a time per organization.
## Common errors and how to fix them
| Message / symptom | Probable cause | How to fix |
| ------------------------------------------------------------------------------------- | --------------------------------------------------------------- | --------------------------------------------------------------------------------------------------------------- |
| Scan completed with 0 gateways, or with missing gateways | The Service Principal is not an administrator of those gateways | Use **Grant Service Principal Access to Gateways** with a gateway administrator account and run **Start Scan**. |
| Gateway appeared as **Removed** without having been uninstalled | The Service Principal lost the administrator role | Redo the access grant. |
| **Consent to the Fabric API was not completed. Please try again.** | The consent window was closed | Click the button again and complete the consent. |
| **403 Forbidden - Check admin permissions.** | Access denied by the API | Review the Service Principal permissions and the access grant. |
| **Service Principal without configured credentials** / **Failed to obtain API token** | Missing credentials or expired secret | Review the Service Principal App ID and secret. |
## Frequently asked questions
The gateway is online on the machine, but appears offline in Power Monitor.
The online/offline status does not come from this scan: it is checked every 5 minutes by gateway monitoring. Check whether monitoring is enabled and whether the gateway is in the inventory (**Gateways Found** card). See [Monitoring › Gateways](/en/power-monitor/monitoramento/gateways.md).
Do I need to redo the access grant when I create a new gateway?
Yes, if the Service Principal is not added manually as an administrator of the new gateway. Run the grant again; gateways already granted appear as "already granted".
## Related pages
* [Governance › Infrastructure › Gateways](/en/power-monitor/governanca/infraestrutura/gateways.md)
* [Governance › Infrastructure › Connections](/en/power-monitor/governanca/infraestrutura/conexoes.md)
* [Monitoring › Gateways](/en/power-monitor/monitoramento/gateways.md)
* [Scan Logs](/en/power-monitor/mapeamento/logs-de-scans-e-re-execucoes.md)
* [Settings › Monitoring](/en/power-monitor/configuracoes/monitoramento.md)
---
# Agent Instructions
This documentation is published with GitBook. GitBook is the documentation platform designed so that both humans and AI agents can read, navigate, and reason over technical content effectively. Learn more at gitbook.com.
## Querying This Documentation
If you need additional information that is not directly available in this page, you can query the documentation by asking a question.
Perform an HTTP GET request on the following URL with the `ask` and `goal` query parameters:
```
GET https://docs.powermonitor.com.br/en/power-monitor/mapeamento/gateways.md?ask=&goal=
```
`ask` is the immediate question: it should be specific, self-contained, and written in natural language.
`goal` is what the user is ultimately trying to achieve, the reason they need the answer. Sharing it helps GitBook give you a better, more relevant answer. A goal is most helpful when it describes the outcome the user wants rather than restating the question. For example, with `ask=how do I create an API token`, a goal like `automate deployments from our CI pipeline` lets GitBook tailor the answer to that use case.
The response will contain a direct answer to the question and relevant excerpts and sources from the documentation.
Use this mechanism when the answer is not explicitly present in the current page, you need clarification or additional context, or you want to retrieve related documentation sections.