
> For the complete documentation index, see [llms.txt](https://docs.powermonitor.com.br/llms.txt). Markdown versions of documentation pages are available by appending `.md` to page URLs; this page is available as [Markdown](https://docs.powermonitor.com.br/en/power-monitor/mapeamento/inventarios.md).

# Inventory

Track and trigger the full scan that catalogs the tenant's workspaces and artifacts, the foundation of the entire Governance module.

The **Inventory** collection is Power Monitor's main one: it scans the Microsoft Fabric / Power BI tenant and catalogs all workspaces and their artifacts (reports, semantic models, dataflows, lakehouses, warehouses, notebooks, pipelines, SQL databases, Real-Time Intelligence items, etc.), with users, lineage, data sources and the model schema. Almost every Governance, Data Quality and Dashboards screen depends on this inventory.

**How to access:** *Mapping › Inventory › Inventory* (page title: **Inventories**, subtitle "Collection (scan) of the environment inventory."). The screen is exclusive to the **Administrator** profile, which is also the only one that sees the action button bar.

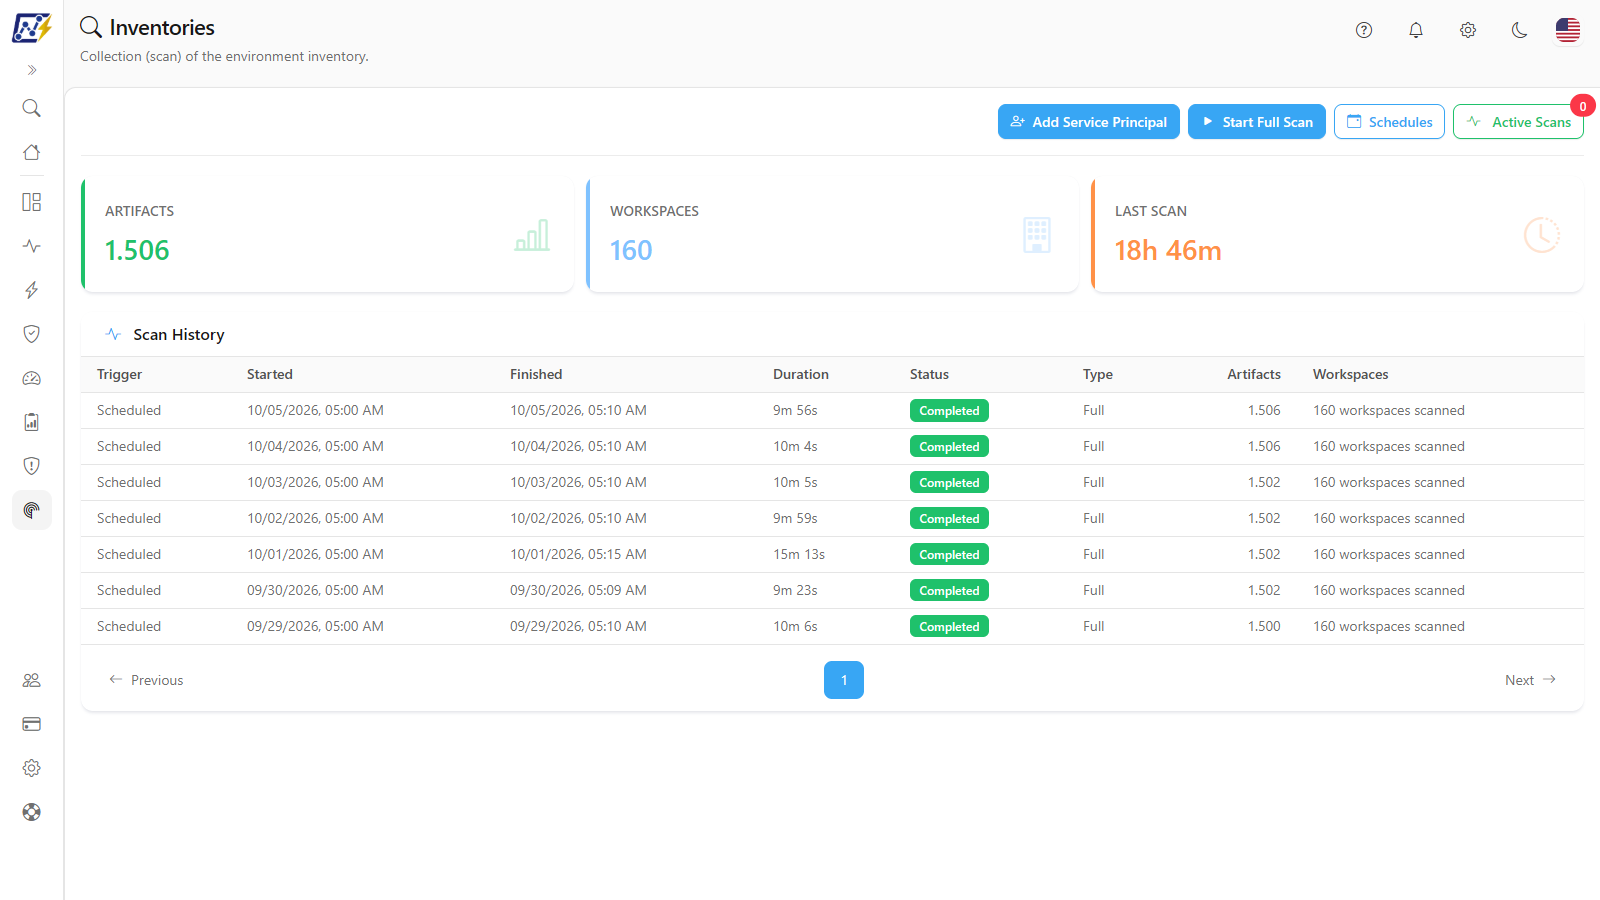
<figure><picture><source srcset="/files/yb7GSVvknsm0q0FFKMH4" media="(prefers-color-scheme: dark)"><img src="https://3938213054-files.gitbook.io/~/files/v0/b/gitbook-x-prod.appspot.com/o/spaces%2FH2bFRBmIfyK3kwVKbldl%2Fuploads%2Fgit-blob-17187d8e1923282593b9b35b8e5a62f0b9af09d6%2Fpm-mapeamento-inventarios-en.png?alt=media" alt="Inventories screen with the Artifacts, Workspaces and Last Scan cards and the Scan History"></picture><figcaption><p>Inventory</p></figcaption></figure>

## What it is for

* Confirm when the inventory was last updated and whether the execution finished successfully.
* Force an inventory update after publishing new workspaces or artifacts, without waiting for the daily execution.
* Run a scan restricted to some workspaces.
* Add the Power Monitor Service Principal as administrator of all workspaces in the tenant.
* Create additional scan routines (schedules) besides the automatic daily execution.
* See, for each execution, how many artifacts of each type were found.

## Features

From top to bottom, the screen has: the **action bar**, the **summary cards** and the **Scan History**. The other features open in windows (modals) from these three blocks.

### Action bar

**What it is:** the row of buttons at the top of the screen: **Add Service Principal**, **Start Full Scan**, **Schedules** and **Active Scans**.

**What it is for:** it groups everything that changes or tracks the inventory. Users who are not Administrators do not see this bar.

<figure><picture><source srcset="/files/nlB3afMklMS1f9ZEkEXt" media="(prefers-color-scheme: dark)"><img src="https://3938213054-files.gitbook.io/~/files/v0/b/gitbook-x-prod.appspot.com/o/spaces%2FH2bFRBmIfyK3kwVKbldl%2Fuploads%2Fgit-blob-4650b64a70d775555b4324cb41f19abb1b1d214c%2Fpm-mapeamento-scan-inventarios-barra-acoes-en.png?alt=media" alt="Bar with the Add Service Principal, Start Full Scan, Schedules and Active Scans buttons"></picture><figcaption><p>Inventory screen action bar</p></figcaption></figure>

| Button                    | What it does                                                                               | Details                                                                     |
| ------------------------- | ------------------------------------------------------------------------------------------ | --------------------------------------------------------------------------- |
| **Add Service Principal** | Adds the organization's Service Principal as administrator in all workspaces in the tenant | [Add Service Principal to workspaces](#add-service-principal-to-workspaces) |
| **Start Full Scan**       | Opens the wizard to trigger a scan of the entire tenant or of selected workspaces          | [Start Full Scan](#start-full-scan-scan-everything)                         |
| **Schedules**             | Opens the list of scan schedules created by your organization                              | [Scan Schedules](#scan-schedules)                                           |
| **Active Scans**          | Shows the tracking of the scans you triggered                                              | [Active Scans](#active-scans-scan-tracking)                                 |

**How it works / rules:**

* The **Start Full Scan** button is disabled while a trigger is being sent.
* The **Active Scans** button has a red badge with the number of **Pending** or **Running** scans and, right below it, a green bar with the average progress of those scans.
* Triggering an **Incremental Scan** is not available on this screen: the daily routine uses the Full Scan. An Incremental Scan can be run by a [schedule](#new-schedule-and-edit-schedule) of the **Incremental** type or by the ▶ of an Incremental row in [Scan Logs](/en/power-monitor/mapeamento/logs-de-scans-e-re-execucoes.md).

### Summary cards

**What it is:** three indicators right below the action bar: **Artifacts**, **Workspaces** and **Last Scan**.

**What it is for:** answer at a glance "how much is inventoried today" and "how long ago the inventory was updated".

<figure><picture><source srcset="/files/5eaCA8WZ5yvZU4ojTNqL" media="(prefers-color-scheme: dark)"><img src="https://3938213054-files.gitbook.io/~/files/v0/b/gitbook-x-prod.appspot.com/o/spaces%2FH2bFRBmIfyK3kwVKbldl%2Fuploads%2Fgit-blob-09a264d4fd722fde7de0e7c21ace64be367dbabf%2Fpm-mapeamento-scan-inventarios-cards-en.png?alt=media" alt="Artifacts, Workspaces and Last Scan cards"></picture><figcaption><p>Inventory summary cards</p></figcaption></figure>

| Card           | Meaning                                                                                                                                                                                                                                                 |
| -------------- | ------------------------------------------------------------------------------------------------------------------------------------------------------------------------------------------------------------------------------------------------------- |
| **Artifacts**  | Total number of artifacts currently inventoried in the **monitored** workspaces you can see, not counting deleted items. It is a current value (not a snapshot of the last scan) and is the same count used on the Main Dashboard.                      |
| **Workspaces** | Total number of monitored, non-deleted workspaces you can see.                                                                                                                                                                                          |
| **Last Scan**  | Time elapsed since the end of the last Full or Incremental Scan (for example, "2h 15m"), updated every minute. It also considers executions that ended in failure; check the status in the history. With no finished execution: **No scans performed**. |

**How to use:** the cards are informational only (not clickable). They are reloaded when you open the screen and automatically when a Full or Incremental Scan you triggered finishes.

**How it works / rules:**

{% hint style="info" %}
The cards respect the user's **workspace scope**: an administrator with visibility restricted to some workspaces sees only the totals for those workspaces.
{% endhint %}

### Scan History

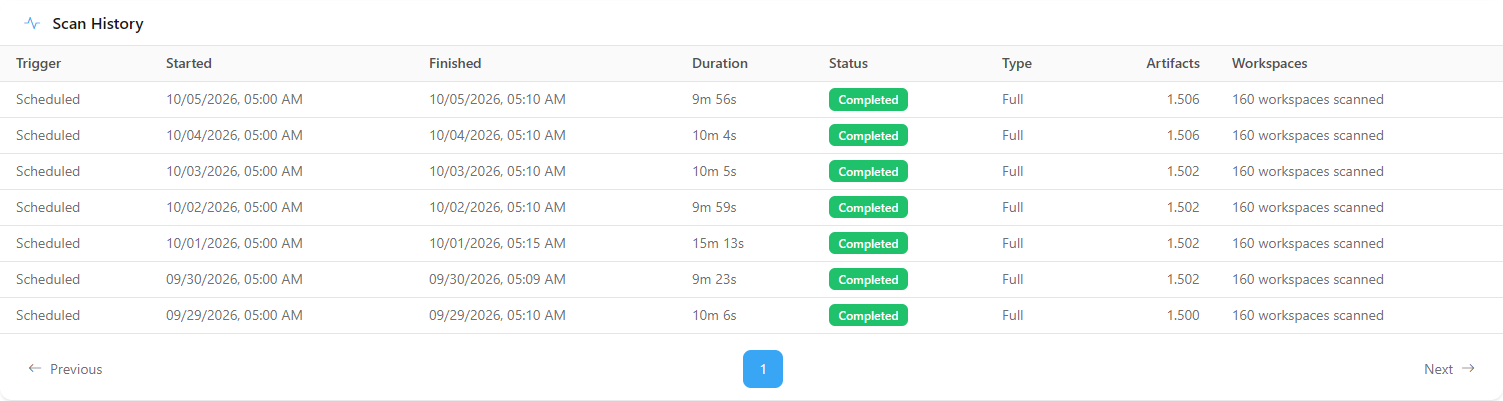
**What it is:** table with the Full and Incremental Scan executions from the **last 7 days** (by start date), from newest to oldest, paginated at 10 rows per page (the **Items per page** selector below the table offers 10, 25, 50 or 100).

**What it is for:** check whether the daily and manual executions happened, how long they took, whether they failed and how many artifacts each one found.

<figure><picture><source srcset="/files/sSl1ORKqHoTHZonlDE4C" media="(prefers-color-scheme: dark)"><img src="https://3938213054-files.gitbook.io/~/files/v0/b/gitbook-x-prod.appspot.com/o/spaces%2FH2bFRBmIfyK3kwVKbldl%2Fuploads%2Fgit-blob-fec93a7dc227bf0d58df00e9309cf4b4e386036a%2Fpm-mapeamento-inventarios-historico-en.png?alt=media" alt="Scan History table with the Trigger, Started, Finished, Duration, Status, Type, Artifacts and Workspaces columns"></picture><figcaption><p>Scan History</p></figcaption></figure>

| Column                     | Content                                                                                                                                                    |
| -------------------------- | ---------------------------------------------------------------------------------------------------------------------------------------------------------- |
| **Trigger**                | **Scheduled** or **Manual**. For manual ones, hover over the person icon to see who triggered it. Older executions, without this information, show a dash. |
| **Started** / **Finished** | Start and end date and time, in the browser's time zone (the end shows a dash while running).                                                              |
| **Duration**               | Total execution time (a dash while running).                                                                                                               |
| **Status**                 | **Running** (blue, with a progress bar), **Completed** (green) or **Failed** (red). On failures, hover over the ⓘ icon to read the error.                  |
| **Type**                   | **Full** or **Incremental**.                                                                                                                               |
| **Artifacts**              | Number of artifacts found in that execution (not counting workspaces, capacities, gateways, connections and apps).                                         |
| **Workspaces**             | "{n} workspaces scanned".                                                                                                                                  |

**How to use:**

1. Find the execution by the **Started** column.
2. Read the **Status**; if it is **Failed**, hover over the ⓘ icon to see the error message.
3. Use the pagination below the table to see older executions (up to 7 days) and **Items per page** to show more rows at once.
4. Click the row (or select it and press Enter) to open the [execution detail](#execution-detail-artifacts-by-type).

**How it works / rules:** with no executions in the period, the table shows **No scans recorded yet**. Each new automatic retry of a failed execution appears as its own row. For longer periods and other scan types, use [Scan Logs](/en/power-monitor/mapeamento/logs-de-scans-e-re-execucoes.md).

### Execution detail (artifacts by type)

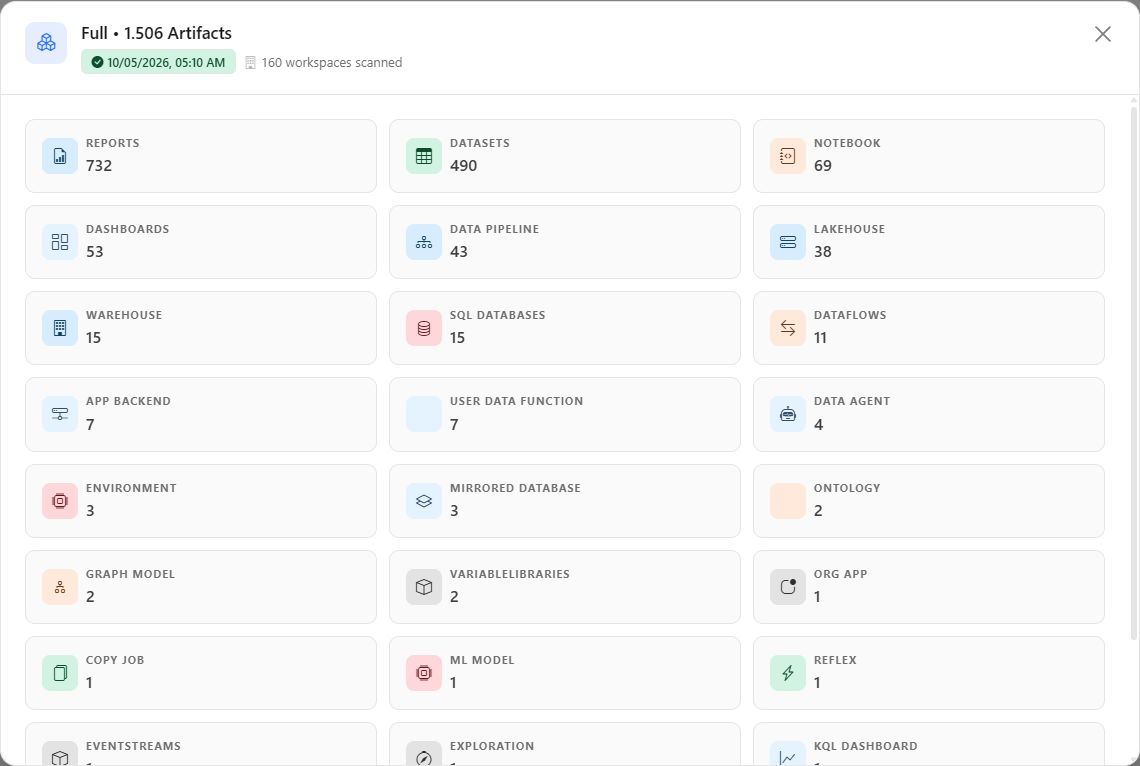
**What it is:** window opened by clicking a row in the **Scan History**, with the distribution of the artifacts that execution found.

**What it is for:** check whether an expected artifact type (for example, Lakehouses or Notebooks) was actually collected, or understand why the total changed from one day to the next.

<figure><picture><source srcset="/files/dvS9T1jxgHcqbrLGeo3s" media="(prefers-color-scheme: dark)"><img src="https://3938213054-files.gitbook.io/~/files/v0/b/gitbook-x-prod.appspot.com/o/spaces%2FH2bFRBmIfyK3kwVKbldl%2Fuploads%2Fgit-blob-977803b4fb578e5ccf73b2c35e3bf53fb9329f66%2Fpm-mapeamento-scan-inventarios-detalhe-execucao-en.png?alt=media" alt="Detail modal of an Inventory Scan execution with cards by artifact type"></picture><figcaption><p>Execution detail: artifacts by type</p></figcaption></figure>

**How to use:**

1. In the **Scan History**, click the execution row.
2. Read the title (execution type and total artifacts, for example "Full • 1,234 artifacts"), the badge with the date and time (colored according to the status) and the number of workspaces scanned.
3. If the execution failed, the error message is highlighted in red at the top.
4. Review the cards by artifact type, sorted from most to least numerous.
5. Close with the **X** or by clicking outside the window.

**How it works / rules:** only types with at least one item appear. Workspaces, capacities, gateways, connections and apps are not included in this distribution. If no artifact was found, the window shows **No artifacts found.**

### Start Full Scan (Scan Everything)

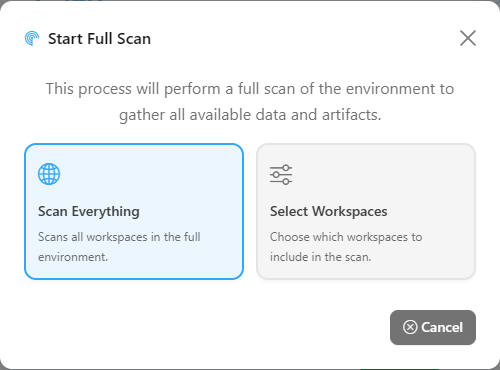
**What it is:** wizard opened by the **Start Full Scan** button, with two options: **Scan Everything** and **Select Workspaces**.

**What it is for:** update the inventory immediately, without waiting for the daily 00:00 execution, for example after fixing permissions or publishing new workspaces.

<figure><picture><source srcset="/files/YgkgZRxscEMqYOTeXdQA" media="(prefers-color-scheme: dark)"><img src="https://3938213054-files.gitbook.io/~/files/v0/b/gitbook-x-prod.appspot.com/o/spaces%2FH2bFRBmIfyK3kwVKbldl%2Fuploads%2Fgit-blob-50ae0a0544319fa9a43538c4bf3b0bc6e8928ea3%2Fpm-mapeamento-scan-inventarios-modal-scan-completo-en.png?alt=media" alt="Start Full Scan modal with the Scan Everything and Select Workspaces options"></picture><figcaption><p>Full Scan wizard</p></figcaption></figure>

**How to use:**

{% stepper %}
{% step %}

### Open the screen

Go to *Mapping › Inventory › Inventory* as an **Administrator** user.
{% endstep %}

{% step %}

### Start the wizard

Click **Start Full Scan**. The **Start Full Scan** modal explains that a full scan of the environment will be performed.
{% endstep %}

{% step %}

### Choose "Scan Everything"

Click the **Scan Everything** card ("Scans all workspaces in the full environment."). There is no second confirmation: the scan starts immediately and the message **Full scan started.** appears. To give up before that, use **Cancel**.
{% endstep %}

{% step %}

### Follow it

Click **Active Scans** to see the progress, or wait for the new **Running** row in the **Scan History**. When it finishes, the cards and the history are reloaded automatically.
{% endstep %}
{% endstepper %}

**How it works / rules:**

* **Scan Everything** scans the entire tenant in this run. The automatic daily scan does not change: it keeps its own scope.
* If a manual Full Scan is already pending or running, Power Monitor reuses that execution instead of creating another one.
* If the trigger fails, **Failed to start full scan.** appears.

### Select Workspaces

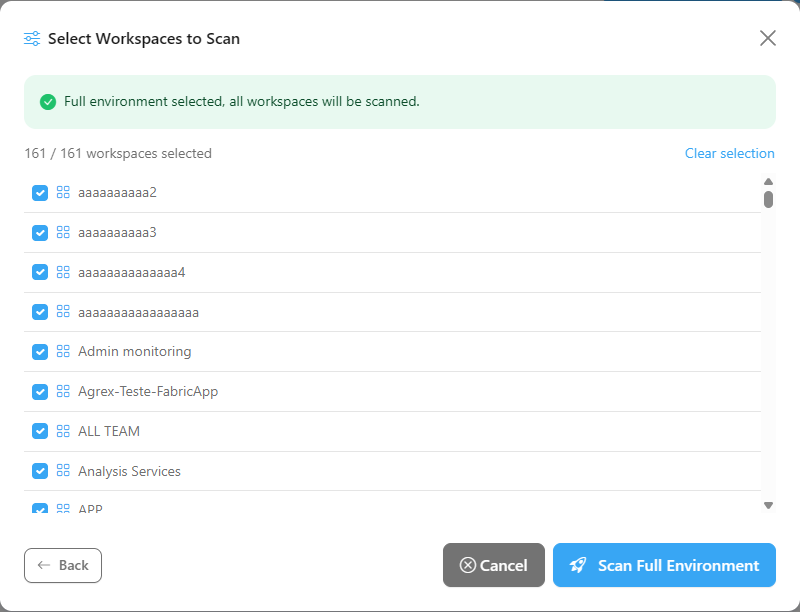
**What it is:** second option of the **Start Full Scan** wizard, which lets you choose which workspaces are included in the scan.

**What it is for:** quickly update only the workspaces that changed, or limit the inventory to part of the tenant.

<figure><picture><source srcset="/files/9mFLtYUOBDtZvHVZohyb" media="(prefers-color-scheme: dark)"><img src="https://3938213054-files.gitbook.io/~/files/v0/b/gitbook-x-prod.appspot.com/o/spaces%2FH2bFRBmIfyK3kwVKbldl%2Fuploads%2Fgit-blob-043a61588b6282f86be1eed3d51b12db35188ad4%2Fpm-mapeamento-scan-inventarios-modal-selecionar-workspaces-en.png?alt=media" alt="List of workspaces with a selection counter and the Start Filtered Scan button"></picture><figcaption><p>Workspace selection for the scan</p></figcaption></figure>

**How to use:**

{% stepper %}
{% step %}

### Open the selection

Click **Start Full Scan** and choose **Select Workspaces** ("Choose which workspaces to include in the scan.").
{% endstep %}

{% step %}

### Select the workspaces

The **Select Workspaces to Scan** list is loaded live from the tenant, with all workspaces checked and the notice "Full environment selected, all workspaces will be scanned.". Uncheck the ones you do not want to include, or use **Clear selection** and check only the desired ones. The counter shows "X / Y workspaces selected". **Select all** checks everything again.
{% endstep %}

{% step %}

### Start the scan

Click **Start Filtered Scan** (the button is called **Scan Full Environment** when all are checked). The button is disabled if no workspace is checked. Use **Back** to return to the previous choice or **Cancel** to give up.
{% endstep %}

{% step %}

### Follow the scan

The selection only applies to this run: the automatic daily scan keeps its own scope. Follow the progress in **Active Scans**; when it finishes, the history and the cards are reloaded.
{% endstep %}
{% endstepper %}

**How it works / rules:** with all workspaces checked, the scan is treated as covering the entire tenant. New workspaces discovered by a scan with a selection are created as **monitored**. See also [Workspace selection and the daily scan](#workspace-selection-and-the-daily-scan).

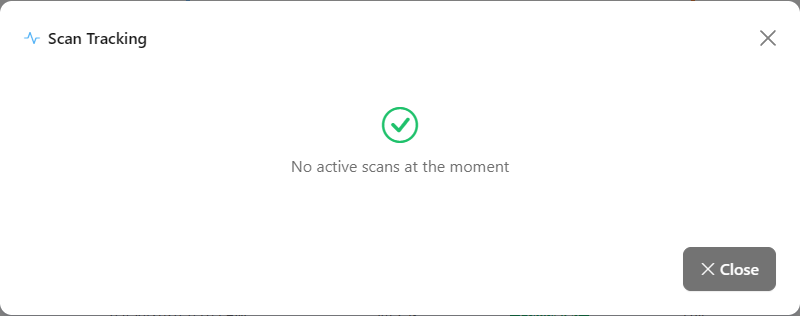
### Active Scans (Scan Tracking)

**What it is:** **Scan Tracking** window, opened by the **Active Scans** button, with the scans you triggered in this browser tab.

**What it is for:** follow the progress of a newly triggered scan without leaving the screen.

<figure><picture><source srcset="/files/qetCSG3YJSW1zsyUJ9OQ" media="(prefers-color-scheme: dark)"><img src="https://3938213054-files.gitbook.io/~/files/v0/b/gitbook-x-prod.appspot.com/o/spaces%2FH2bFRBmIfyK3kwVKbldl%2Fuploads%2Fgit-blob-ea92972be54b411c515f29a92a145341871276cb%2Fpm-mapeamento-scan-inventarios-modal-scans-ativos-en.png?alt=media" alt="Scan Tracking modal with the list of active scans or the message No active scans at the moment"></picture><figcaption><p>Scan Tracking</p></figcaption></figure>

**How to use:**

1. Click **Active Scans**.
2. For each scan, see the type (for example, "Full Scan"), the status (**Pending**, **Running**, **Completed**, **Failed**, **Cancelled**), how long ago it was started and, while running, the current step (for example, "Step: Scanning workspaces (3/13)"; see [Progress steps](#progress-steps)) and the progress bar with the percentage.
3. Click **Close** (or the **X**). The scan keeps running on the server.

**How it works / rules:**

* The list shows the scans triggered by you, including from other Mapping screens (Capacities, Gateways, etc.). It is kept per organization and survives a page reload (F5). With no scans, **No active scans at the moment** is displayed.
* Tracking continues until the run actually ends. While the scan waits for the collection service, *Queued: waiting for the collection service. We keep tracking it until it finishes.* is displayed; if it goes back to the queue for a new attempt, *The run went back to the queue for a new attempt...* is displayed.
* Completed scans show **Scan completed successfully** and disappear from the list after a few seconds; on failures, the error message is displayed; cancelled ones show **Scan cancelled before completion**.
* A scan that finished **without running** (for example, because another run of the same type was already in progress) appears as **Not run**, with the reason (*Not run: another run was already in progress.*), and never as completed successfully.
* Automatic executions, or those triggered in another browser, do not appear here: follow them in the **Scan History** or in [Scan Logs](/en/power-monitor/mapeamento/logs-de-scans-e-re-execucoes.md).
* After 4 hours, the screen stops tracking the scan and shows *We stopped tracking this scan after 4 hours. It may still be running in the background: check the history.* This is not a failure: check the result in the **Scan History**.

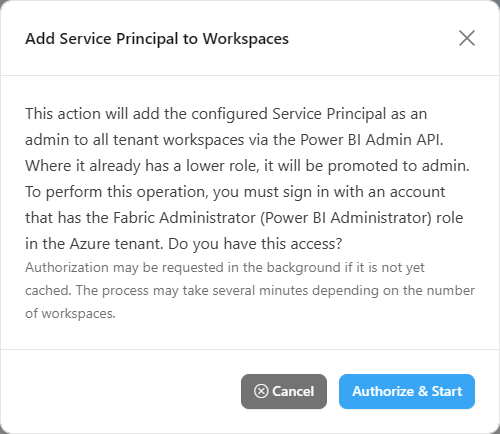
### Add Service Principal to workspaces

**What it is:** process, opened by the **Add Service Principal** button, that adds the organization's Service Principal with the **Administrator** role to all workspaces in the tenant (where it already had a lower role, it is promoted).

**What it is for:** give the Service Principal the workspace access required by the [Model Mapping](/en/power-monitor/mapeamento/mapeamento-de-modelos.md), [Model Size](/en/power-monitor/mapeamento/tamanho-de-modelos.md) and [Report Structure](/en/power-monitor/mapeamento/estrutura-de-relatorios.md) scans, without having to add it workspace by workspace.

<figure><picture><source srcset="/files/P7w7JyYleEBS7lT8bXyO" media="(prefers-color-scheme: dark)"><img src="https://3938213054-files.gitbook.io/~/files/v0/b/gitbook-x-prod.appspot.com/o/spaces%2FH2bFRBmIfyK3kwVKbldl%2Fuploads%2Fgit-blob-17dac40543b99abde8f6793852ec455a184e38f2%2Fpm-mapeamento-scan-inventarios-modal-service-principal-en.png?alt=media" alt="Add Service Principal to Workspaces modal with the Cancel and Authorize &#x26; Start buttons"></picture><figcaption><p>Add Service Principal to Workspaces</p></figcaption></figure>

**How to use:**

{% stepper %}
{% step %}

### Confirm the prerequisite

You must be a **Fabric Administrator** (Power BI Administrator in the tenant) in addition to an Administrator in Power Monitor.
{% endstep %}

{% step %}

### Open the modal

Click **Add Service Principal**. The **Add Service Principal to Workspaces** modal explains the operation and asks whether you have this access.
{% endstep %}

{% step %}

### Authorize

Click **Authorize & Start** (or **Cancel** to give up). If requested, complete the consent in the Microsoft window. Authorization may take a few minutes.
{% endstep %}

{% step %}

### Follow the processing

The modal shows **Adding Service Principal to workspaces...**, a progress bar and "{processed} of {total} workspaces", with how many were **added or promoted**, how many were **already admin** and how many had **errors**. You can click **Close (continues in background)**: the process continues on its own and, when you reopen the modal, tracking resumes.
{% endstep %}

{% step %}

### Check the result

At the end, **Process completed successfully!** or **Process completed with failures.** appears (with the summary of added, already administrators and failures). If there are failures, check whether the tenant allows service principals to use the admin APIs. If the whole process fails, **An error occurred during the process.** appears with the **Try again** button.
{% endstep %}
{% endstepper %}

**How it works / rules:** if no processing is found 30 seconds after authorization, the modal warns that no job was found and asks you to check whether the authorization was completed and try again.

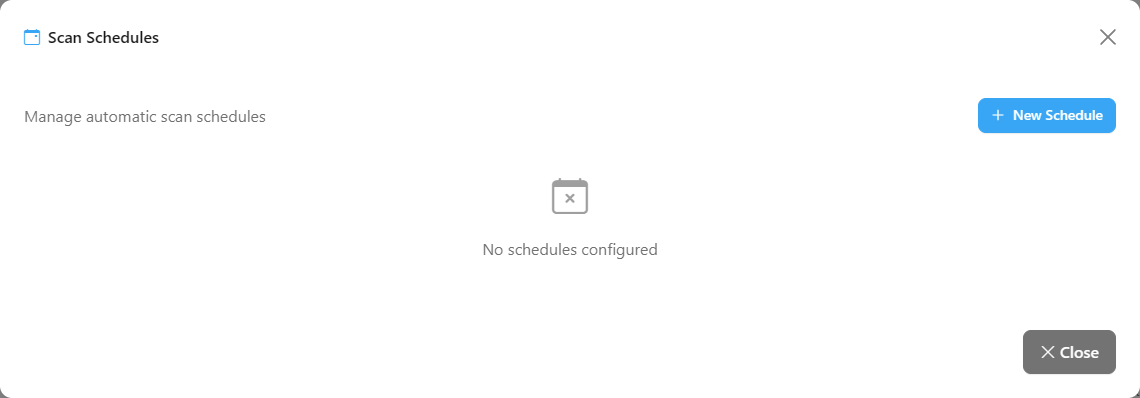
### Scan Schedules

**What it is:** **Scan Schedules** window ("Manage automatic scan schedules"), opened by the **Schedules** button, with the additional Full or Incremental Scan routines created by the organization.

**What it is for:** run extra scans at fixed times (for example, a scan of a group of production workspaces at noon), in addition to the automatic daily scan.

<figure><picture><source srcset="/files/ENUohimKmEQ22Rq7LtSZ" media="(prefers-color-scheme: dark)"><img src="https://3938213054-files.gitbook.io/~/files/v0/b/gitbook-x-prod.appspot.com/o/spaces%2FH2bFRBmIfyK3kwVKbldl%2Fuploads%2Fgit-blob-3d3bc5eb0cb83eb6ec7bf19f47b6be484dd8ae86%2Fpm-mapeamento-scan-inventarios-modal-agendamentos-en.png?alt=media" alt="Scan Schedules modal with the list of schedules and the per-row actions"></picture><figcaption><p>Scan Schedules</p></figcaption></figure>

Each schedule in the list shows: name, type badges (**Full**/**Incremental**), frequency (**Daily**, **Weekly**, **Monthly**) and state (**Active**/**Inactive**), the time (with the day of the week or "Day N" of the month, when applicable), the description, "{n} workspace(s) selected", **Last run** and **Next run**.

**How to use:** use the icons to the right of each schedule (the action name appears on hover):

| Icon           | Action                        | What happens                                                                                                                                                                                                                                               |
| -------------- | ----------------------------- | ---------------------------------------------------------------------------------------------------------------------------------------------------------------------------------------------------------------------------------------------------------- |
| Lightning bolt | **Run now**                   | Creates right away a one-off run with the schedule's workspaces, without confirmation. Message: **Execution started successfully.** The schedule (time and next run) and the daily routine do not change, and the screen tracks the run until it finishes. |
| Pause / Play   | **Deactivate** / **Activate** | Turns the routine on or off immediately, without confirmation. Message: **Schedule disabled.** or **Schedule enabled.**                                                                                                                                    |
| Pencil         | **Edit**                      | Opens the [Edit Schedule](#new-schedule-and-edit-schedule) form                                                                                                                                                                                            |
| Trash can      | **Delete**                    | Opens the [deletion](#delete-schedule) confirmation                                                                                                                                                                                                        |

To create a routine, click **New Schedule**. Close the window with **Close**.

**How it works / rules:** the list is paginated at 3 schedules per page (the **Items per page** selector lets you switch to 10, 25, 50 or 100). With no schedules, **No schedules configured** is displayed. The automatic daily 00:00 scan does not appear in this list.

{% hint style="info" %}
After creating or changing a schedule, check in [Scan Logs](/en/power-monitor/mapeamento/logs-de-scans-e-re-execucoes.md) whether the execution happened at the expected time.
{% endhint %}

{% hint style="info" %}
This window deals with **inventory scan schedules**. Do not confuse it with the [Refreshes and Schedules](/en/power-monitor/mapeamento/atualizacoes-e-agendamentos.md) page, which is a different collection (the one for item schedules and refreshes).
{% endhint %}

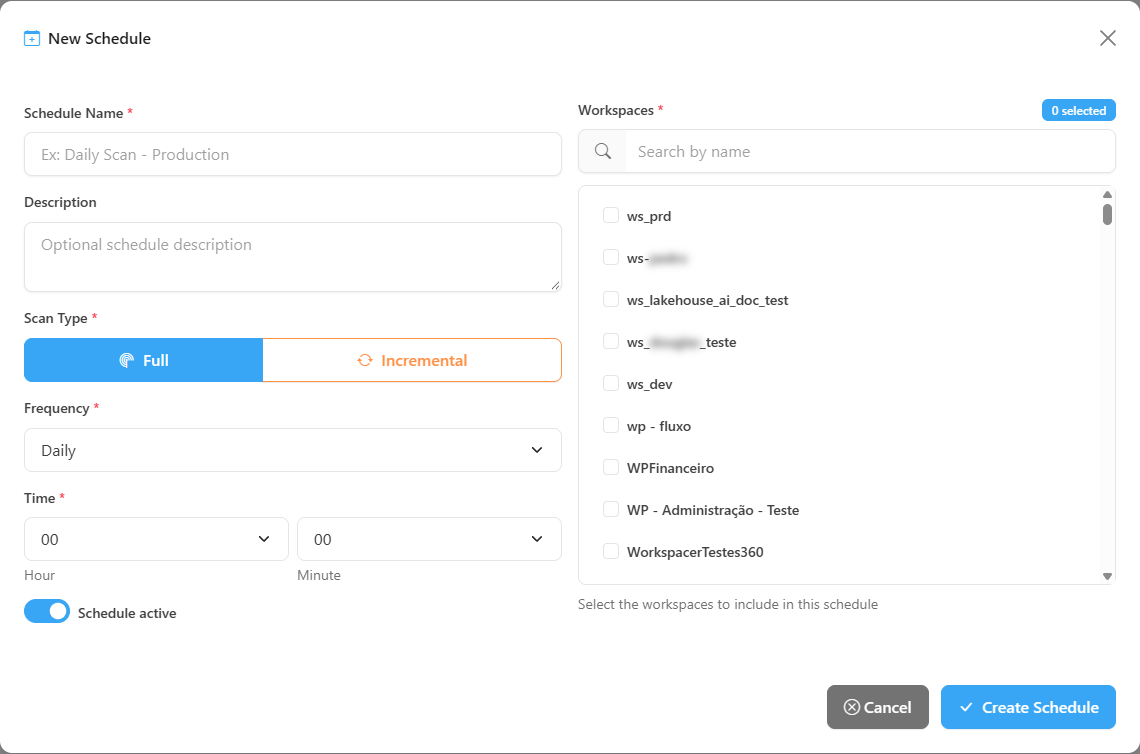
### New Schedule and Edit Schedule

**What it is:** form opened by **New Schedule** (or by the **Edit** icon of an existing schedule, with the title **Edit Schedule**).

**What it is for:** define what (scan type and workspaces) and when (frequency and time) the routine will run.

<figure><picture><source srcset="/files/BOqv7wut3xhwzs7XFdz5" media="(prefers-color-scheme: dark)"><img src="https://3938213054-files.gitbook.io/~/files/v0/b/gitbook-x-prod.appspot.com/o/spaces%2FH2bFRBmIfyK3kwVKbldl%2Fuploads%2Fgit-blob-b88d93a41656d6d9802fc26094dadce4ef13f243%2Fpm-mapeamento-scan-inventarios-modal-novo-agendamento-en.png?alt=media" alt="New Schedule form with name, description, scan type, frequency, time and list of workspaces"></picture><figcaption><p>Scan schedule form</p></figcaption></figure>

**How to use:**

{% stepper %}
{% step %}

### Open the form

Click **Schedules** › **New Schedule**.
{% endstep %}

{% step %}

### Fill in the routine data

* **Schedule Name** (required, up to 200 characters and unique in the organization), for example "Daily Scan - Production". A duplicate name is rejected with **Failed to save schedule.**
* **Description** (optional).
* **Scan Type**: **Full** or **Incremental**.
* **Frequency**: **Daily**, **Weekly** (choose the **Day of Week**) or **Monthly** (choose the **Day of Month**, from 1 to 31; months without the chosen day, such as day 31, are skipped).
* **Time**: **Hour** and **Minute** (in 5-minute intervals), in your browser's time zone.
* **Schedule active**: leave it on so the routine runs.
  {% endstep %}

{% step %}

### Choose the workspaces

In the **Workspaces** column, check at least one (use **Search by name** to filter). The badge shows "{n} selected". The list comes from the inventory; if it is empty, **No workspaces available. Run a scan first.** appears.
{% endstep %}

{% step %}

### Save

Click **Create Schedule** (or **Update Schedule**, when editing). The message **Schedule created successfully.** (or **Schedule updated successfully.**) confirms it and the list is reloaded. Without a name or without workspaces, **Schedule name is required.** or **Select at least one workspace.** appears. **Cancel** returns to the list without saving.
{% endstep %}
{% endstepper %}

**How it works / rules:**

* **Workspaces:** each run of the schedule, whether at the scheduled time or through **Run now**, scans **only the workspaces checked** in the form, never the entire tenant.
* **Time:** the time is entered in your browser's time zone and converted internally; opening a schedule in **Edit Schedule** and saving keeps the same displayed time.
* **Next run:** check the time in **Next run**, in the schedule list, right after saving.

{% hint style="warning" %}
**Schedules created or edited before 09/28/2026:** until that date, the runs at the scheduled time scanned **all workspaces** of the organization, ignoring the selection, and saving an edit shifted the time (3 hours, in the Brasília time zone). Open each schedule in **Edit Schedule**, check **Hour**, **Minute** and the checked workspaces and click **Update Schedule**: only after saving again does the workspace selection apply to the scheduled runs.
{% endhint %}

### Delete schedule

**What it is:** **Confirm Deletion** confirmation, opened by the **Delete** icon of a schedule.

**What it is for:** remove a routine that is no longer needed. To just suspend it, prefer **Deactivate**.

**How to use:**

1. In **Scan Schedules**, click the trash can icon (**Delete**) of the schedule.
2. Check the name in the question "Are you sure you want to delete the schedule ...?".
3. Click **Delete** to confirm or **Cancel** to give up.

**How it works / rules:** "This action is permanent and cannot be undone." After deletion, **Schedule deleted successfully.** appears.

## Rules and behavior

### Full Scan vs. Incremental Scan

|                         | Full Scan                                                             | Incremental Scan                                                             |
| ----------------------- | --------------------------------------------------------------------- | ---------------------------------------------------------------------------- |
| **What it scans**       | All workspaces in the tenant (or the selected ones)                   | Only the workspaces modified on the current day                              |
| **Automatic execution** | Yes, **daily at 00:00** (Brasília time, UTC-3)                        | There is no automatic execution                                              |
| **Manual trigger**      | **Start Full Scan** button or ▶ in Scan Logs                          | Through an Incremental-type schedule or ▶ on an Incremental row in Scan Logs |
| **Marks deleted items** | Yes, when it scans the entire tenant and the list comes back complete | Never                                                                        |

The Full Scan **cannot be turned off** in *Settings › Monitoring › Scans and Collections*: the inventory is the foundation of the product. It also has no **Frequency** selector (Daily/Weekly/Monthly): it runs every day. That option exists on the inventory cards for **Capacities**, **Gateways**, **Connections**, **Apps** and **Semantic Model Connections**, which are separate collections (see [Capacities](/en/power-monitor/mapeamento/capacidades.md) and [Gateways](/en/power-monitor/mapeamento/gateways.md)).

### How the collection works

1. Lists all workspaces in the tenant through the **Power BI Admin API**.
2. Sends the workspaces to the **metadata scanner API** (*getInfo*) in batches of 100, requesting lineage, data source details, model schema and expressions, and the users of each artifact, and waits for the result of each batch.
3. Enriches some items (for example, SQL endpoints of Lakehouses/Warehouses and the definition of semantic models).
4. Saves the data and, in the Full Scan of the entire tenant, marks as deleted the workspaces and artifacts that no longer exist. The history of these items is preserved and they start appearing as deleted.

Important details:

* Workspaces marked as **not monitored** only have their workspace metadata updated; their artifacts are not scanned in depth. New workspaces are always scanned.
* Personal workspaces (My workspace) and admin workspaces are not included in the in-depth scan.
* If Microsoft throttles the calls (error 429), the scan reduces parallelism and retries automatically. The scanner API allows at most 500 calls per hour per Service Principal.
* Each execution attempt has a **30-minute** timeout. In case of failure, the execution is retried up to 3 times; each attempt appears as its own row in the **Scan History** and in [Scan Logs](/en/power-monitor/mapeamento/logs-de-scans-e-re-execucoes.md).
* If the application is restarted during a scan, the task is automatically put back in the queue and the step becomes **Restarted after the application was interrupted**.
* **Incremental Scan with a failed batch:** the Incremental Scan processes workspaces in batches. If any batch fails, the whole run is marked **Failed** and the next run covers the same period again, so that no change is silently lost.
* **Full Scan with a failed batch:** when a batch of up to 100 workspaces fails for a reason that splitting may solve (for example, a timeout, a Microsoft server error or a response that could not be read), the Full Scan finishes the other batches and then scans that batch again in halves, until it isolates the problematic workspace. Only that workspace keeps the data from the previous cycle (and is not marked as deleted); the others are updated normally. Permission failures (401/403) and request-limit failures left after the retries are not split, and the recovery stops when both halves fail (general failure) or when the scan is running out of time.
* **Semantic Model Connections:** the link between models and data sources is built from the data the Full Scan already collects, without querying Power BI model by model. This avoids request limits and timeouts in large tenants, and the result reflects the last Full Scan (daily).

### Progress steps

The Full Scan records the step it is in. These steps appear, in the language chosen in the interface, in two places: in the tracking of the initial collection in the Power Monitor setup wizard and in the **Active Scans** window on this screen, in the "Step: ..." line of each scan in progress (when a step is recorded, it replaces the item count).

| Step                                                | Meaning                                                             |
| --------------------------------------------------- | ------------------------------------------------------------------- |
| **Scanning workspaces (x/y)**                       | Batches of workspaces sent to the scanner API and already completed |
| **Saving data (x/y)**                               | Workspaces whose artifacts have already been saved to Power Monitor |
| **Restarted after the application was interrupted** | The execution was resumed after a service restart                   |

### Workspace selection and the daily scan

{% hint style="info" %}
Triggering a **Start Full Scan** (with **Select Workspaces** or **Scan Everything**), a schedule's **Run now** or the ▶ in Scan Logs **does not change the automatic daily scan**: the manual run applies only to itself, and the daily routine keeps its own scope. Until October 7, 2026, a scan with a workspace selection reduced the daily scan to that selection.
{% endhint %}

New workspaces discovered by a scan with a selection are created as **monitored**.

### Required permissions

* Fabric tenant settings (Admin portal › Tenant settings):
  * **Service principals can access read-only admin APIs**, enabled for a security group that contains the Service Principal. Without it, no inventory collection works.
  * **Enhance admin APIs responses with detailed metadata**: without it, models arrive without tables and columns.
  * **Enhance admin APIs responses with DAX and mashup expressions**: without it, measures and Power Query queries arrive without expressions.
* When a Fabric administrator triggers the scan manually, Power Monitor can also use that person's delegated access as an alternative if the Service Principal is denied.

## Common errors and how to fix them

| Message / symptom                                                                  | Probable cause                                                                        | How to fix                                                                                                                                         |
| ---------------------------------------------------------------------------------- | ------------------------------------------------------------------------------------- | -------------------------------------------------------------------------------------------------------------------------------------------------- |
| **Service Principal without configured credentials**                               | Service Principal App ID / secret not registered                                      | Review the Service Principal credentials in the organization settings.                                                                             |
| **Failed to obtain API token**                                                     | Invalid or expired secret, or wrong tenant                                            | Generate a new secret in Entra ID and update it in Power Monitor.                                                                                  |
| **403 Forbidden** when listing or scanning workspaces                              | Admin API tenant setting disabled for the Service Principal                           | Enable **Service principals can access read-only admin APIs** for the Service Principal's security group and wait for propagation (a few minutes). |
| Models without tables, columns or measures                                         | Detailed metadata / DAX expressions settings disabled                                 | Enable both "Enhance admin APIs responses…" settings.                                                                                              |
| Rate limit error (429)                                                             | Too many calls to the scanner API in the same hour                                    | The scan retries on its own. Avoid repeated manual triggers.                                                                                       |
| **Task aborted by the worker: exceeded the maximum execution time of 30 minutes.** | Very large tenant or slow API                                                         | The task is retried automatically. If it persists, contact support.                                                                                |
| I click **Start Full Scan** and the history does not change                        | A manual Full Scan is already pending or running; Power Monitor reuses that execution | Wait for the current execution to finish. A stuck execution is recovered automatically within about 45 minutes.                                    |
| A newly created workspace does not appear                                          | There has been no scan since it was created, or the workspace is personal             | Trigger a Full Scan. Personal workspaces are not inventoried in depth.                                                                             |

## Frequently asked questions

<details>

<summary>How often is the inventory updated?</summary>

An automatic Full Scan runs every day at 00:00 (Brasília time, UTC-3). You can trigger additional executions at any time or create extra schedules.

</details>

<details>

<summary>Why is the Artifacts card different from the number shown in the history?</summary>

The card shows the current total of artifacts in the **monitored** workspaces you can see. The **Artifacts** column in the history shows what was found in that specific execution, which may have scanned a selection of workspaces or included non-monitored workspaces.

</details>

<details>

<summary>Does an artifact deleted in Power BI disappear from Power Monitor?</summary>

It is marked as deleted in the next Full Scan of the entire tenant and is no longer counted, but its history is preserved (see the deleted items filter on the Governance screens).

</details>

<details>

<summary>Where can I see history older than 7 days?</summary>

The screen shows the executions from the last 7 days. Older history is kept by Power Monitor; contact support if you need a specific execution.

</details>

## Related pages

* [Mapping](/en/power-monitor/mapeamento.md)
* [Scan Logs](/en/power-monitor/mapeamento/logs-de-scans-e-re-execucoes.md)
* [Capacities](/en/power-monitor/mapeamento/capacidades.md)
* [Gateways](/en/power-monitor/mapeamento/gateways.md)
* [Governance › Workspaces](/en/power-monitor/governanca/workspaces.md)
* [Main Dashboard](/en/power-monitor/dashboards/dashboard-principal.md)
* [Configuring permissions in Azure](/en/readme/como-instalar-o-power-monitor/configuracao-de-permissoes-no-azure-para-o-power-monitor.md)


---

# Agent Instructions
This documentation is published with GitBook. GitBook is the documentation platform designed so that both humans and AI agents can read, navigate, and reason over technical content effectively. Learn more at gitbook.com.

## Querying This Documentation
If you need additional information that is not directly available in this page, you can query the documentation by asking a question.

Perform an HTTP GET request on the following URL with the `ask` and `goal` query parameters:

```
GET https://docs.powermonitor.com.br/en/power-monitor/mapeamento/inventarios.md?ask=<question>&goal=<user_goal>
```

`ask` is the immediate question: it should be specific, self-contained, and written in natural language.
`goal` is what the user is ultimately trying to achieve, the reason they need the answer. Sharing it helps GitBook give you a better, more relevant answer. A goal is most helpful when it describes the outcome the user wants rather than restating the question. For example, with `ask=how do I create an API token`, a goal like `automate deployments from our CI pipeline` lets GitBook tailor the answer to that use case.

The response will contain a direct answer to the question and relevant excerpts and sources from the documentation.

Use this mechanism when the answer is not explicitly present in the current page, you need clarification or additional context, or you want to retrieve related documentation sections.