> For the complete documentation index, see [llms.txt](https://docs.powermonitor.com.br/llms.txt). Markdown versions of documentation pages are available by appending `.md` to page URLs; this page is available as [Markdown](https://docs.powermonitor.com.br/en/power-monitor/mapeamento/logs-de-scans-e-re-execucoes.md).
# Scan Logs
Consolidated history of the collection scan runs, with filters, export to CSV/JSON and re-run by scan type.
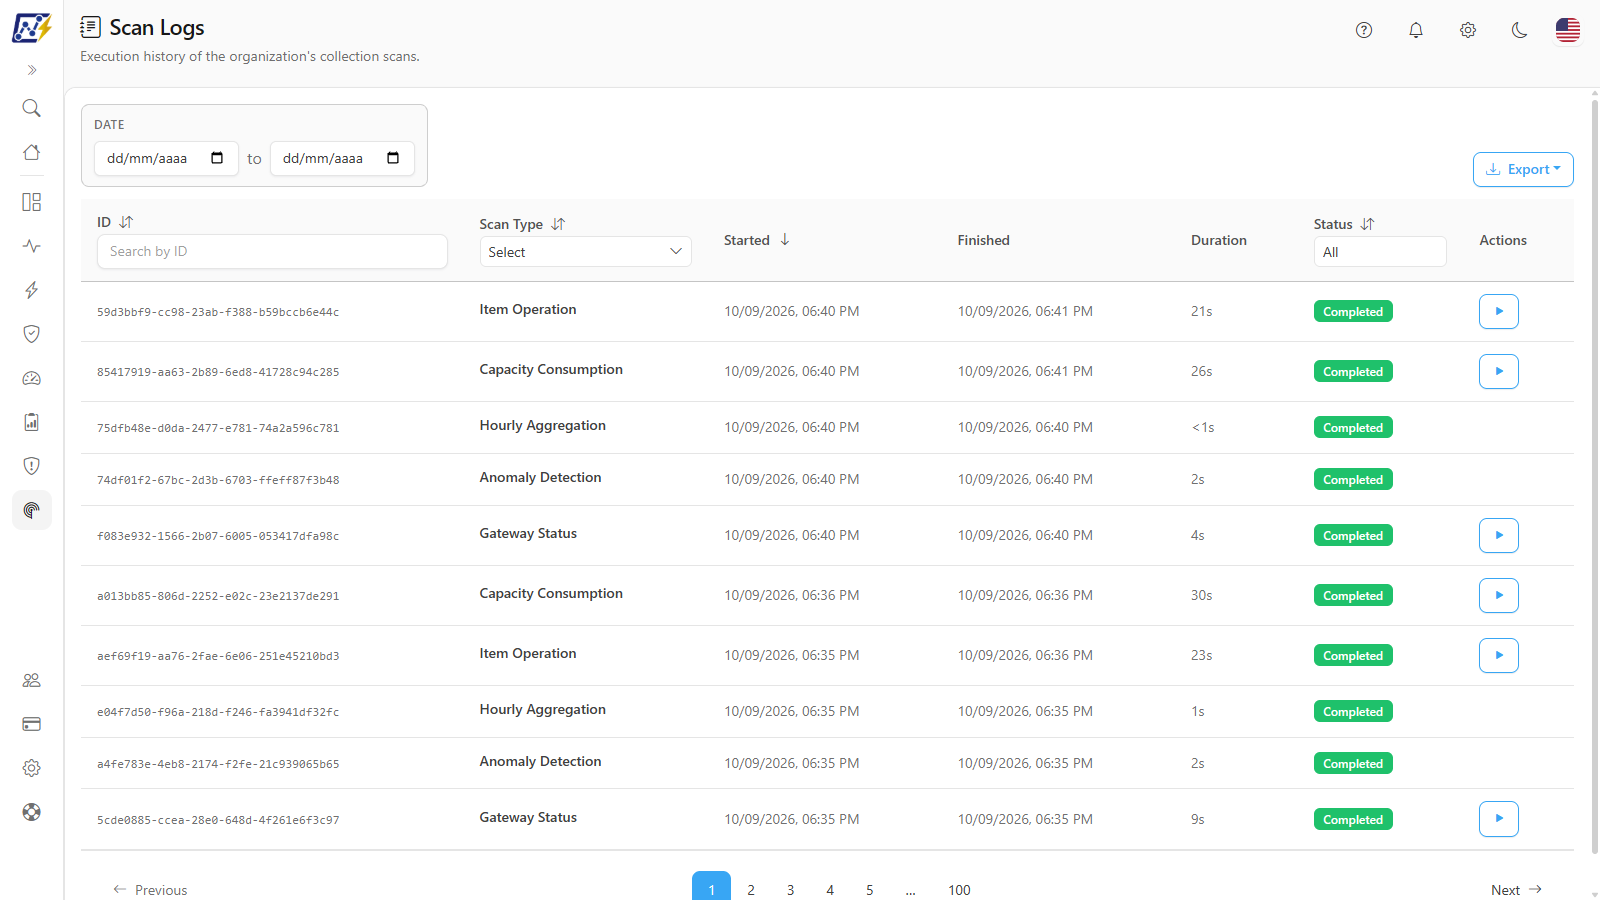
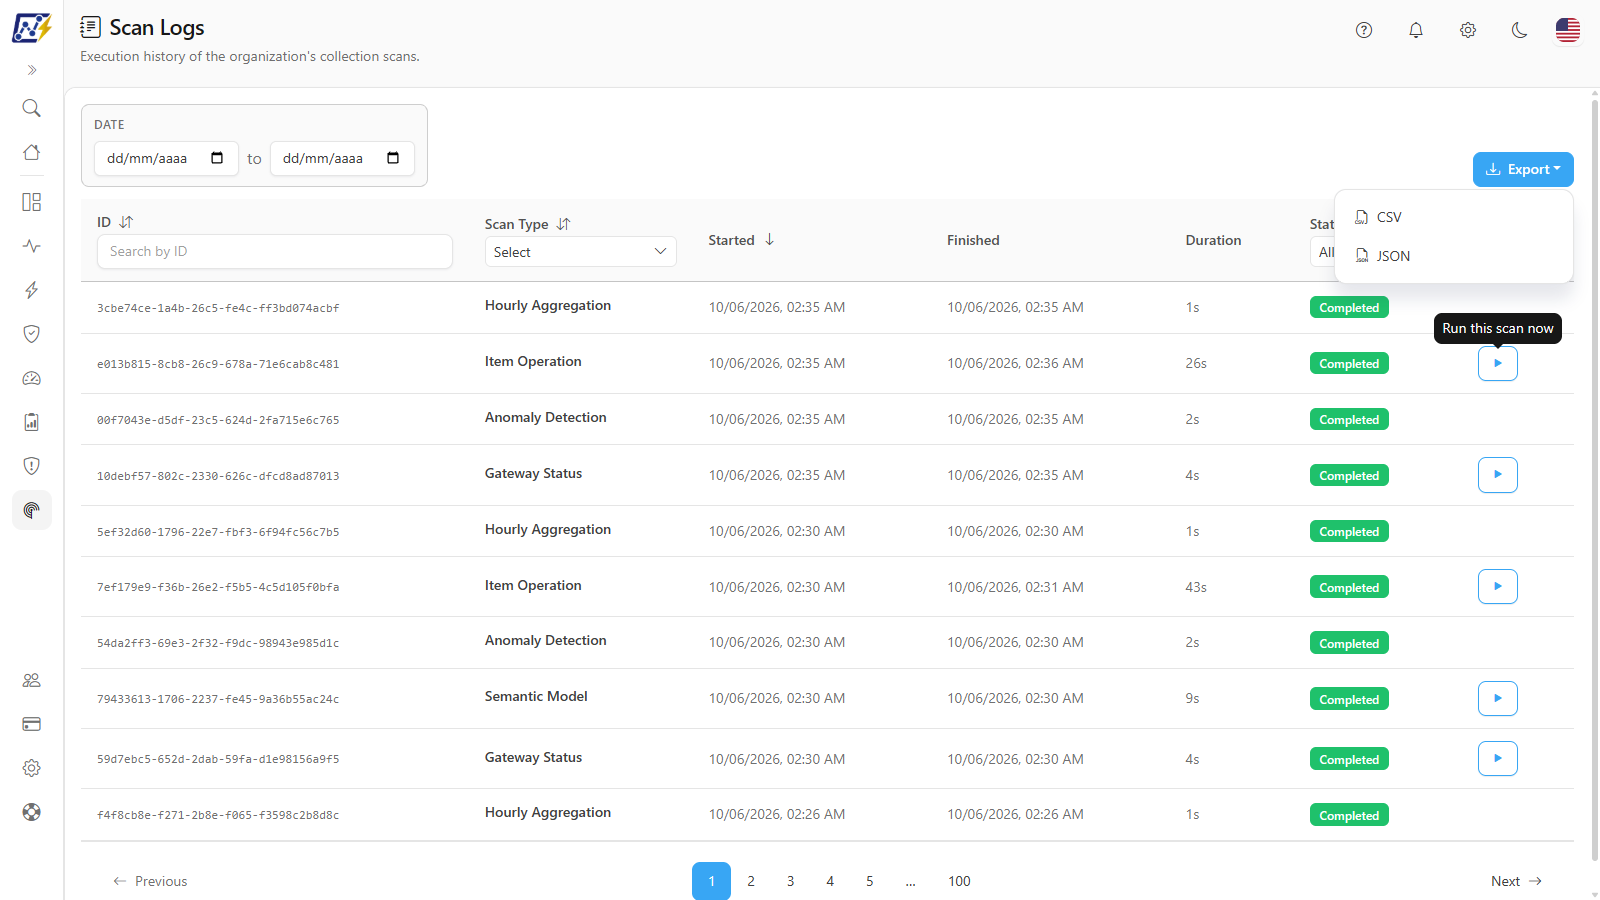
The **Scan Logs** screen brings together, in a single list, the runs of the organization's collection scans: inventory, capacities, gateways, connections, apps, gateway status, capacity consumption, item operations, Fabric jobs, audit, consumption metrics and others. It is used to quickly diagnose what ran, what failed, and to trigger a scan type again without leaving the screen.
**How to access:** *Mapping › Scan Logs* (the first item of the Mapping menu, outside the groups). **Administrators** only. Old addresses of this screen (under Audit and Settings) automatically redirect here.
Scan Logs
## What it is for
* See at once the result of the recent collections of all types.
* Find failed runs and read the error.
* Re-run a scan type directly from the row.
* Export the history for analysis or to send to support.
## Features
The screen has eight features: the **Date** selector, the header filters (**ID**, **Scan Type** and **Status**), column sorting, the runs table, the run details, the ▶ re-run button, pagination and the **Export** menu.
### Header filters (ID, Scan Type and Status)
**What it is:** filter fields built into the table header, right below the name of each column.
**What it is for:** quickly isolate what matters, for example "all Gateway failures this week" or a specific run mentioned by support.
Filters in the table header
| Filter | How it works |
| ------------------------- | ---------------------------------------------------------------------------------------------------------------------------------------- |
| **ID** (**Search by ID**) | Enter the **full** identifier of a run. A partial identifier does not filter. |
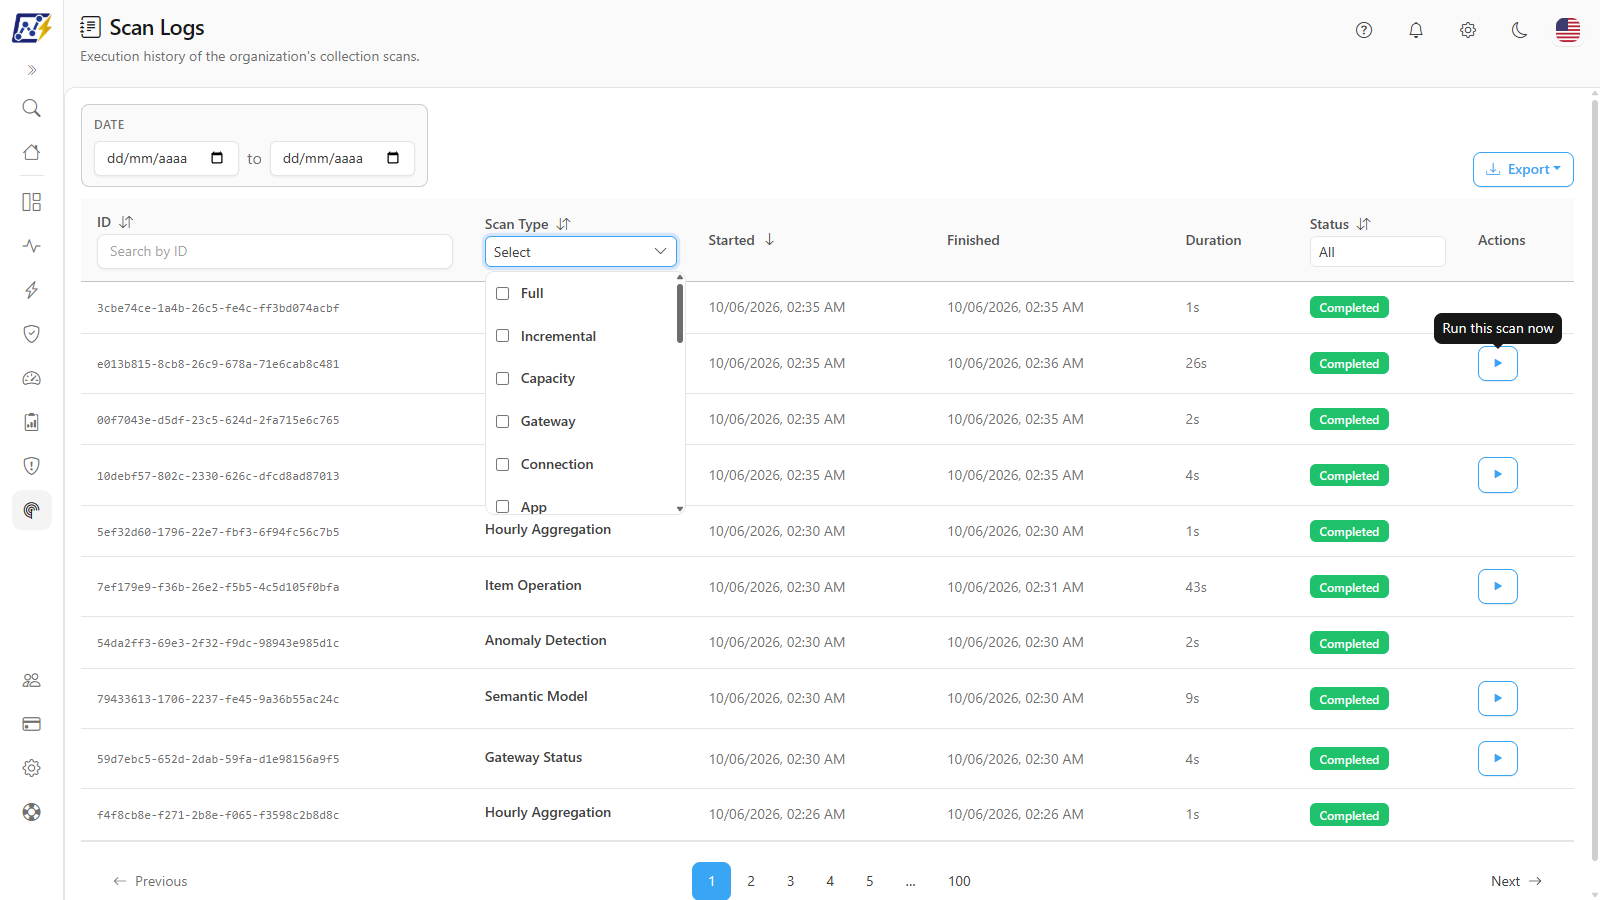
| **Scan Type** | Multiple selection of the types. With no selection, it shows **Select**; with a selection, it shows "{n} selected". |
| **Status** | **All**, **OK** (completed), **Failed**, **In Progress** (runs still running) or **Scheduled** (runs created that have not started yet). |
**How to use:**
1. To locate a run, paste the full ID in the **Search by ID** field of the **ID** column.
2. To filter by type, click the selector of the **Scan Type** column and check one or more types (click again to uncheck). Click outside the list to close it.
3. To see only failures, choose **Failed** in the **Status** column filter.
Selecting scan types
**How it works / rules:** filter changes are applied automatically, without an apply button.
### Date selector
**What it is:** a date range selector displayed above the table.
**What it is for:** look up runs from a specific period, including before the last 7 days (for example, to investigate a failure from last week).
**How to use:**
1. Click **Date**.
2. Choose the start date and the end date.
3. The list reloads automatically with the runs **started** within the period.
**How it works / rules:**
* **No date chosen:** the list shows the runs started in the **last 7 days**.
* **Date chosen:** the filter uses the run's **start** time. The end date includes the **whole day** chosen, in your browser's time zone. If you enter only the start date, the list brings everything from it onwards; only the end date, everything up to it.
* **Sorting:** when you enter a start date, sorting by **Started** becomes oldest to most recent; without a start date, it goes back to most recent first.
### Column sorting
**What it is:** the **ID**, **Scan Type**, **Started** and **Status** columns can be sorted by clicking the column name. The arrow icon shows the current column and direction.
**What it is for:** group runs of the same type or the same status, or see the oldest first.
**How to use:**
1. Click the column name to sort by it (descending).
2. Click again to reverse the direction.
**How it works / rules:** the default is **Started**, from most recent to oldest.
### Runs table
**What it is:** the list of runs, one row per attempt of each scan.
**What it is for:** have the consolidated view of all collection types, with time, duration and result.
| Column | Content |
| ----------------------------------------- | -------------------------------------------------------------------------------------------------------------------------------------------------------------------- |
| **ID** | Run identifier (hover to see it in full) |
| **Scan Type** | Collection type and, for inventory types, a second line with counts (for example, "N artifacts" and "{n} workspaces scanned" for Full; "{n} gateway(s)" for Gateway) |
| **Started** / **Finished** / **Duration** | Run times |
| **Status** | **Completed** (green), **Failed** (red) or **Running** (blue, run with no end time yet) |
| **Actions** | ▶ **Run this scan now** button, only on finished runs (see below) |
**How to use:** go through the list or combine it with the filters. Click a row to open the details.
**How it works / rules:**
* **Window displayed:** runs **started** in the last **7 days** (or in the period of the **Date** selector), up to 1,000 rows. Runs still in progress also appear, with status **Running** and no **Finished** time: this is where you spot a stuck scan.
* **Refresh:** the list does not refresh on its own for automatic runs; to see their result, reload the page or change a filter. A scan triggered by the ▶ is tracked until it finishes and, when it ends, the list is reloaded (see **Re-run a scan**, below).
* **Not run:** a run that finished without running (for example, because another one of the same type was already in progress) is never shown as a success: the notice says **Not run** and the reason.
* **Each attempt is a row:** when a scan fails and is retried automatically, each attempt generates its own row.
* **Monitoring collections:** **Semantic Model** (model refreshes), **Gateway Status**, **Fabric Job** and **Fabric Item Schedule** run in parallel, which makes collection faster. When one of them fails, the run ends as **Failed**, with the reason, and does not stay stuck as **Running**.
* **Monitoring collection timeout based on history:** these four routines run through the queue, like the inventory scans, one at a time, without a long routine holding up the others. The timeout of each run is calculated from your organization's duration history (about twice the usual duration, up to 100 minutes; 60 minutes while there is no history). This way, a long but legitimate run in a large environment is no longer cut off by a fixed ceiling.
* **Run interrupted only when it really stopped:** while it runs, the run records that it is making progress. Only when it goes without progress for longer than expected for that type is it closed as **Failed** with the message *Execução interrompida* (run interrupted), and the next run proceeds normally, instead of the type staying blocked for almost an hour. **Semantic Model** writes its results in blocks and, if a block fails, redoes it model by model, so that one problematic item does not bring down the others.
* **Fabric Job with no successful read:** when none of the job run reads worked, the run appears as **Failed**, with the reason, and not as **Completed** with zero items.
* **Incremental with a failed batch:** the Incremental Scan processes workspaces in batches. If any batch fails, the whole run is marked **Failed** and the next run covers the same period again, so that no change is silently lost.
* **Full Scan with a failed batch:** when a batch of up to 100 workspaces fails for a reason that splitting may solve (for example, a timeout, a Microsoft server error or a response that could not be read), the Full Scan finishes the other batches and then scans that batch again in halves, until it isolates the problematic workspace. Only that workspace keeps the data from the previous cycle (and is not marked as deleted); the others are updated normally. Permission failures (401/403) and request-limit failures left after the retries are not split, and the recovery stops when both halves fail (general failure) or when the scan is running out of time.
* **Dataset Connection:** semantic model connections are built from the data the Full Scan already collects, without one query per model. That is why the scan no longer suffers from request limits or timeouts in large tenants, and it reflects the last Full Scan (daily).
* **Right after installation or a secret change:** Microsoft may take a few minutes to accept a new Service Principal secret. In the first 15 minutes after the installation or the secret change, collections wait for the secret to be accepted instead of failing.
* **Scans with their own screen:** Model Mapping, Model Size, Report Structure, Capacity Cost, Domains, E-mail Subscriptions, Tenant Settings, Power BI Licenses, Azure Quotas, Workspace Git, Deployment operations and Spark Sessions keep their history on their own Mapping screens and do not appear in this list.
* **Shortcut from other scans:** on the Apps, Refreshes and Schedules and Capacity Metrics screens, the **View full history in Scan Logs →** link opens this screen already filtered by the types of that scan. The **Scan Type** filter comes pre-filled and can be adjusted.
### Run details
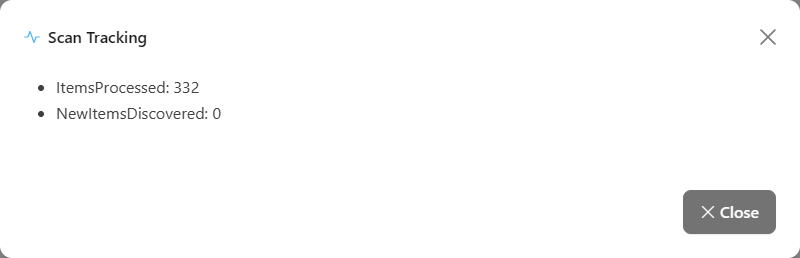
**What it is:** a modal opened by clicking a row, with the run's error message (if any) and the collected counts (for example, "Reports: 12").
**What it is for:** read the full error of a failure or confirm how many items of each type were collected.
Details of a run
**How to use:**
1. Click any cell of the row (except the ▶ button).
2. Read the error message and the counts.
3. Click **Close**.
**How it works / rules:** with no error or counts, the modal shows **All good**.
{% hint style="warning" %}
The run details and the exported files may contain workspace names and emails. Be careful when copying or sharing them outside your organization, including with support.
{% endhint %}
### Re-run a scan (▶ button)
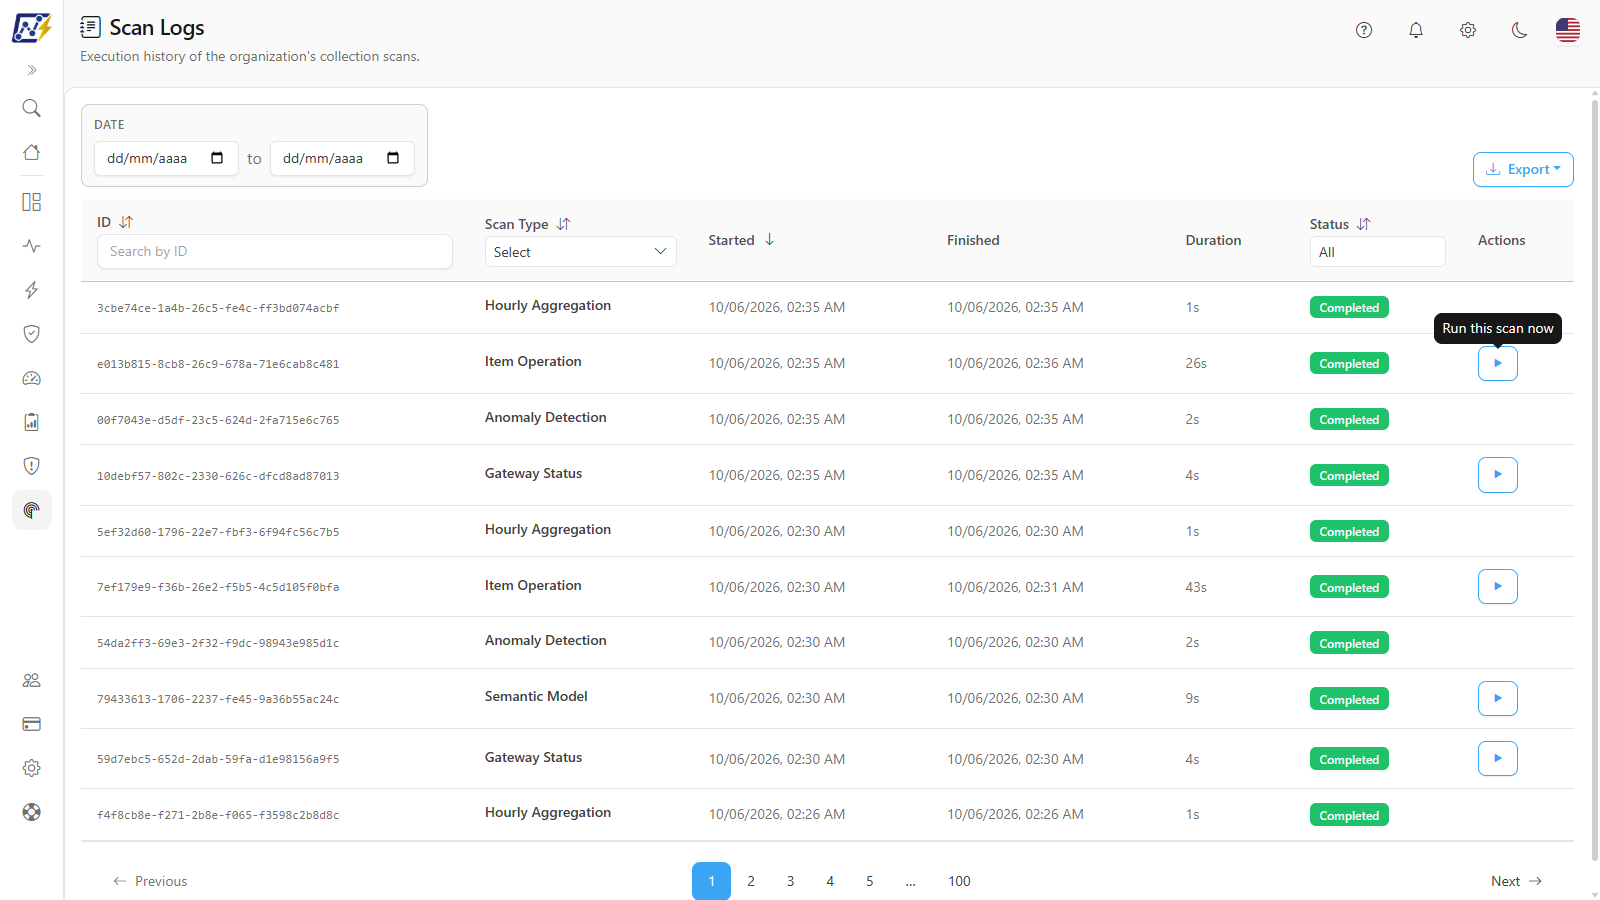
**What it is:** the ▶ button (**Run this scan now**) in the **Actions** column, available for the types that can be triggered manually.
**What it is for:** trigger again a scan type that failed, after fixing the cause, without having to go to the scan's screen.
Re-run button on the row
**How to use:**
1. Locate a row of the desired type (for example, the run that failed).
2. Click the ▶ (**Run this scan now**) in the **Actions** column. There is no confirmation: the trigger is immediate.
3. The message **Scan queued successfully** confirms it. If a run of that type is already running, **There's already a run in progress for this scan type** appears. In case of error: **Failed to start the scan**.
4. The screen tracks the scan until it finishes, without reloading: only the ▶ of the row you clicked shows the loading indicator and, while the scan waits for the collection service, the notice *{type}: Queued: waiting for the collection service. We keep tracking it until it finishes.* appears above the table. If you reload the page (F5), tracking resumes.
5. At the end, the list is reloaded and **Scan completed. The list has been updated.**, **The scan finished with a failure. See the error in the list.** or, when the scan finished without running, **Not run** with the reason (for example, *Not run: another run was already in progress.*) is displayed. The ▶ never changes the automatic daily routine.
**How it works / rules:** the ▶ triggers **the scan type**; it does not repeat exactly that run. That is why it appears only on **finished** runs (completed or failed): a **Running** row has no button, because that type is already running. If you click the ▶ of another row of a type the screen is already tracking, the **There's already a run in progress for this scan type** notice appears and nothing is queued again. For monitoring collections (**Semantic Model**, **Gateway Status**, **Fabric Job** and **Fabric Item Schedule**), a manual trigger made while another run of the same type is still running waits in the queue and runs after it, instead of showing as completed without collecting anything.
| Type | Re-run through ▶ |
| ---------------------------------------------------------------------------------------------------------- | ------------------------------------------------------------------------------------------- |
| **Full** | Yes. It always scans the entire tenant and makes the daily scan cover all workspaces again. |
| **Incremental** | Yes |
| **Capacity**, **Gateway**, **Connection**, **App**, **Dataset Connection** | Yes |
| **Gateway Status** | Yes |
| **Semantic Model**, **Capacity Consumption**, **Item Operation**, **Fabric Job**, **Fabric Item Schedule** | Yes |
| **Audit** | Yes (same effect as **Run now** in [Audit](/en/power-monitor/mapeamento/auditorias.md)) |
| **Anomaly Recalculation** | Yes (reprocesses the last 7 days) |
| **Hourly Aggregation**, **Consumption Baseline**, **Anomaly Detection** | No (they only run automatically) |
| **Dataflow Connection**, **Capacity Status**, **Connection Status** | No (discontinued types; old rows may appear) |
### Pagination
**What it is:** controls below the table, with 10 runs per page by default; the **Items per page** selector lets you choose 10, 25, 50 or 100.
**How to use:** use **Previous**, **Next** or the page numbers.
### Export
**What it is:** the **Export** menu, in the upper right corner of the table, which downloads the loaded list (with the filters applied).
**What it is for:** analyze the history in a spreadsheet or attach it to a support ticket.
Exporting the history
**How to use:**
1. Apply the desired filters.
2. Click **Export** and choose **CSV** or **JSON**.
**How it works / rules:**
* **CSV**: columns ID, Scan Type, Started, Finished, Duration and Status.
* **JSON**: all fields of each row, including counts and error message.
* The file is named `logs-de-scans-YYYY-MM-DD`.
## How to use: find and fix failed runs
{% stepper %}
{% step %}
### Filter by status
In *Mapping › Scan Logs*, in the **Status** filter, choose **Failed**.
{% endstep %}
{% step %}
### Narrow the type (optional)
In the **Scan Type** filter, check the types you want to analyze.
{% endstep %}
{% step %}
### Read the error
Click the row to open the details and read the error message. Check the corresponding scan's page to see the common causes.
{% endstep %}
{% step %}
### Fix and re-run
After fixing the cause (for example, a Service Principal permission), click the row's ▶ to trigger the scan again.
{% endstep %}
{% endstepper %}
## Frequently asked questions
A scan failed. Do I need to run a Full inventory Scan?
Not necessarily. Use the ▶ on the failed row to re-run only that scan type. First, check the error message: if the cause is a permission, the new run will fail the same way until the permission is fixed.
Why can't I see the scan I just triggered?
The list does not refresh on its own. Reload the page or change a filter: the run appears with status **Running** while it runs. Also check that the **Date** selector is not set to a period that excludes today. The detailed progress is on the scan's screen (for example, **Active Scans** on the Inventory screen).
How do I see runs older than 7 days?
Choose the period in the **Date** selector. With no date chosen, the list shows only the runs started in the last 7 days.
How do I spot a stuck scan?
In the **Status** filter, choose **In Progress**. A run that stays as **Running** well beyond the usual duration of that scan type has probably got stuck. For monitoring collections (**Semantic Model**, **Gateway Status**, **Fabric Job** and **Fabric Item Schedule**), a run that stopped making progress is closed automatically as *Execução interrompida* (run interrupted) and the next one proceeds. For the other types, write down the ID and contact support.
I have just installed Power Monitor. When do the monitoring collections show up?
Right after the first Full inventory Scan. As soon as it finishes, the monitoring routines (**Semantic Model**, **Gateway Status**, **Fabric Job** and **Fabric Item Schedule**) start running, including the first collection of Fabric schedules and, with Fabric Jobs monitoring turned on, of job runs. There is no need to wait for the next automatic cycle.
A gateway or a connection shows as removed, but it still exists in Power BI. Why?
Power Monitor only sees the gateways where the Service Principal is an administrator and the connections it has access to. A gateway or connection that the Service Principal can no longer see is treated as removed. To monitor it, give the Service Principal the gateway administrator role or access to the connection again (see [Gateways](/en/power-monitor/mapeamento/gateways.md)); it shows up again in the next cycle.
Where is the history of Model Mapping, Model Size and Report Structure?
Each one has its own runs table, with per-item failure details, on its respective screen in the Mapping menu.
## Related pages
* [Mapping](/en/power-monitor/mapeamento.md)
* [Inventory](/en/power-monitor/mapeamento/inventarios.md)
* [Audit](/en/power-monitor/mapeamento/auditorias.md)
* [Consumption Metrics](/en/power-monitor/mapeamento/metricas-de-consumo.md)
---
# Agent Instructions
This documentation is published with GitBook. GitBook is the documentation platform designed so that both humans and AI agents can read, navigate, and reason over technical content effectively. Learn more at gitbook.com.
## Querying This Documentation
If you need additional information that is not directly available in this page, you can query the documentation by asking a question.
Perform an HTTP GET request on the following URL with the `ask` and `goal` query parameters:
```
GET https://docs.powermonitor.com.br/en/power-monitor/mapeamento/logs-de-scans-e-re-execucoes.md?ask=&goal=
```
`ask` is the immediate question: it should be specific, self-contained, and written in natural language.
`goal` is what the user is ultimately trying to achieve, the reason they need the answer. Sharing it helps GitBook give you a better, more relevant answer. A goal is most helpful when it describes the outcome the user wants rather than restating the question. For example, with `ask=how do I create an API token`, a goal like `automate deployments from our CI pipeline` lets GitBook tailor the answer to that use case.
The response will contain a direct answer to the question and relevant excerpts and sources from the documentation.
Use this mechanism when the answer is not explicitly present in the current page, you need clarification or additional context, or you want to retrieve related documentation sections.