> For the complete documentation index, see [llms.txt](https://docs.powermonitor.com.br/llms.txt). Markdown versions of documentation pages are available by appending `.md` to page URLs; this page is available as [Markdown](https://docs.powermonitor.com.br/en/power-monitor/mapeamento/mapeamento-de-modelos.md).
# Model Mapping
Track and trigger the daily reading of semantic model definitions, which feeds the model diagram, the Best Practices Score and the Environment Inventory.
The **Model Mapping** collection reads the full definition of each semantic model in the monitored workspaces and complements the inventory with **relationships between tables**, **column descriptions**, **Q\&A synonyms** and the technical definition of the model. Without it, the model diagram is empty and several rules of the Best Practices Score and the AI Score cannot be evaluated.
**How to access:** *Mapping › Models and reports › Model Mapping*. Only **Administrators** can access the screen and its actions.
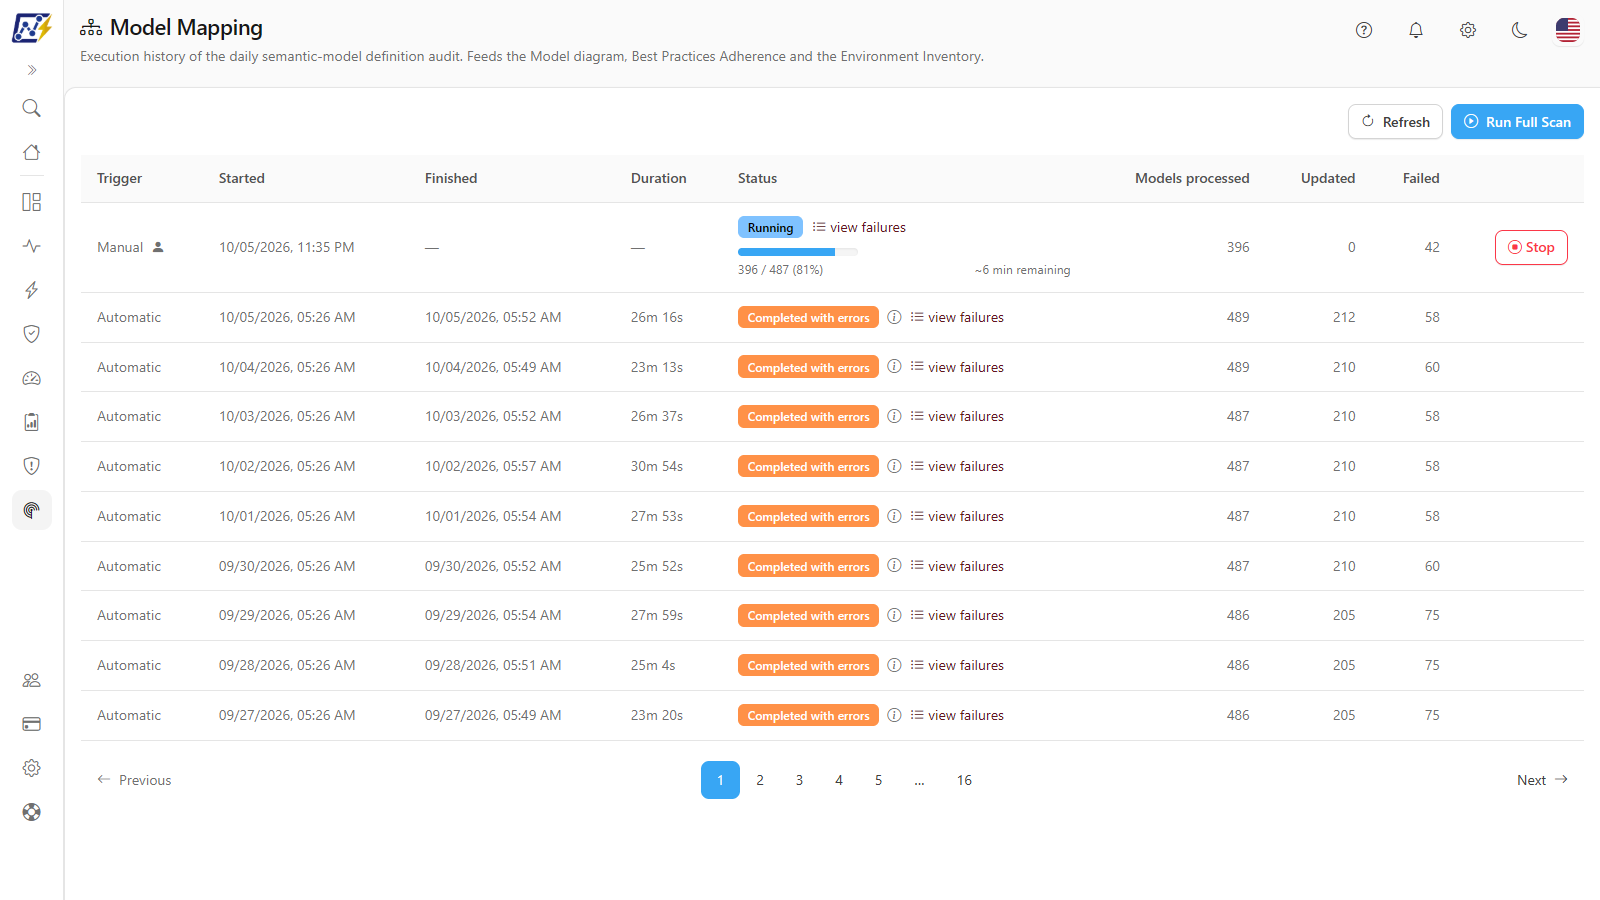
Model Mapping
## What it is for
* Check whether the models were read successfully in the last execution.
* Find out which models failed and why (usually a lack of Service Principal permission in the workspace).
* Force a new read after publishing structural changes to models, to update the scores without waiting for the daily execution.
## Features
The screen has five features: **Refresh**, **Run Full Scan**, the executions table (with real-time progress), the **Stop** button and the **view failures** modal.
Screen action buttons
### Refresh
**What it is:** button that reloads the executions table.
**What it is for:** see the latest state without reloading the whole page, for example right after an automatic execution.
**How to use:** click **Refresh**. While loading, the icon turns into a spinning indicator and the button is disabled.
**How it works / rules:** while an execution is in progress, the table already refreshes on its own every few seconds; the button is useful outside that period.
### Run Full Scan
**What it is:** button that triggers a manual read of all eligible models.
**What it is for:** update the diagram and scores after publishing structural changes to models, or after fixing the Service Principal's permission in a workspace, without waiting for the daily execution.
**How to use:**
{% stepper %}
{% step %}
### Open the screen
Go to *Mapping › Models and reports › Model Mapping* as an **Administrator**.
{% endstep %}
{% step %}
### Trigger it
Click **Run Full Scan**. There is no confirmation modal; the button shows **Starting...** and the message **Model mapping started. The history updates when it finishes.** confirms it. If an execution is already running, **A mapping is already in progress for this organization.** appears.
{% endstep %}
{% step %}
### Follow it
The new row appears as **Running**, with the progress bar and the estimated time. The table refreshes on its own; use **Refresh** if you want to reload.
{% endstep %}
{% step %}
### Check the result
At the end, check the status and, if there are failures, click **view failures**.
{% endstep %}
{% endstepper %}
**How it works / rules:** there is only one execution per organization at a time. The manual trigger works even when the automatic execution is turned off.
### Executions table
**What it is:** paginated table (10 per page by default; the **Items per page** selector in the footer lets you choose 10, 25, 50 or 100) with the mapping executions, from newest to oldest.
**What it is for:** know whether the daily read ran, how many models were read, how many changed and how many failed.
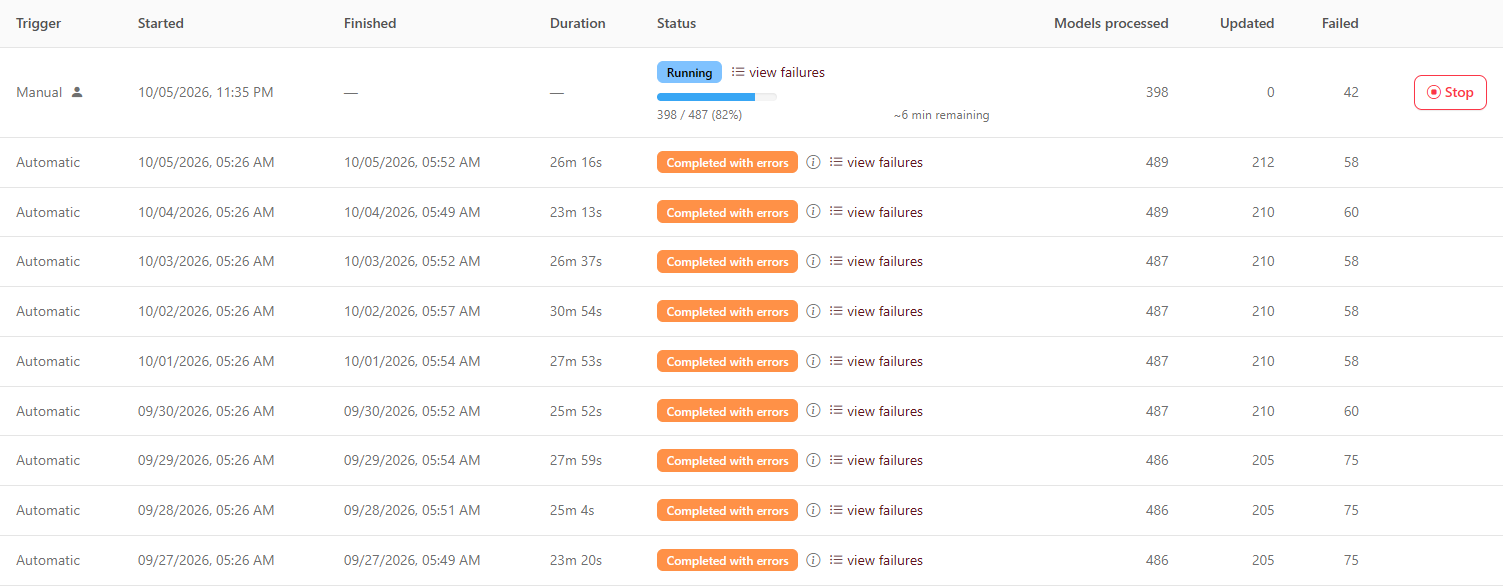
Executions table
| Column | Content |
| ----------------------------------------- | -------------------------------------------------------------------------------------------------------------------------------------------------------------------------------------------------- |
| **Trigger** | **Automatic** or **Manual** (for manual executions, hover over the person icon to see who triggered it) |
| **Started** / **Finished** / **Duration** | Execution times |
| **Status** | See the status table below; the ⓘ icon shows the execution message |
| **Models processed** | Models read so far. During the execution, a "processed / total (%)" bar appears with an estimate of the time remaining (**\~n min remaining**); before the total is known, **Starting...** appears |
| **Updated** | Models whose definition **changed** since the previous read. A model read without changes counts as processed, but not as updated |
| **Failed** | Models that could not be read. The **view failures** link opens the detail |
| Status | Color | Meaning |
| ------------------------- | ------ | ---------------------------------------------------------------------------- |
| **Running** | Blue | Execution running |
| **Completed** | Green | All models read without failure |
| **Completed with errors** | Yellow | Some of the models failed |
| **Failed** | Red | No model could be updated, or a general error (token, permission) |
| **Canceled** | Yellow | Stop requested by an administrator |
| **Interrupted** | Gray | The service was restarted or the execution stopped showing signs of activity |
**How to use:**
1. Find the execution by the **Started** column.
2. Hover over the ⓘ icon next to the status to read the general execution message.
3. Navigate through pages with **Previous**, **Next** or the numbers below the table.
**How it works / rules:** with no executions, the table shows **No executions yet.**; if the history cannot be loaded, **Failed to load the execution history.**
### Stop a running execution
**What it is:** **Stop** button that appears only on the **Running** row and requests the interruption of the execution.
**What it is for:** interrupt a long read triggered by mistake or at an inconvenient time.
**How to use:**
1. On the **Running** row, click **Stop** ("Request this run to stop").
2. Confirm in **Stop the run?** by clicking **Stop** (or **Cancel** to give up).
3. The message **Stop request sent.** confirms it; the current batch finishes and the execution becomes **Canceled**.
**How it works / rules:** the stop is applied at the end of the batch in progress; models already read remain saved. If the execution finishes first, **There is no run in progress to stop.** appears.
### view failures (failures modal)
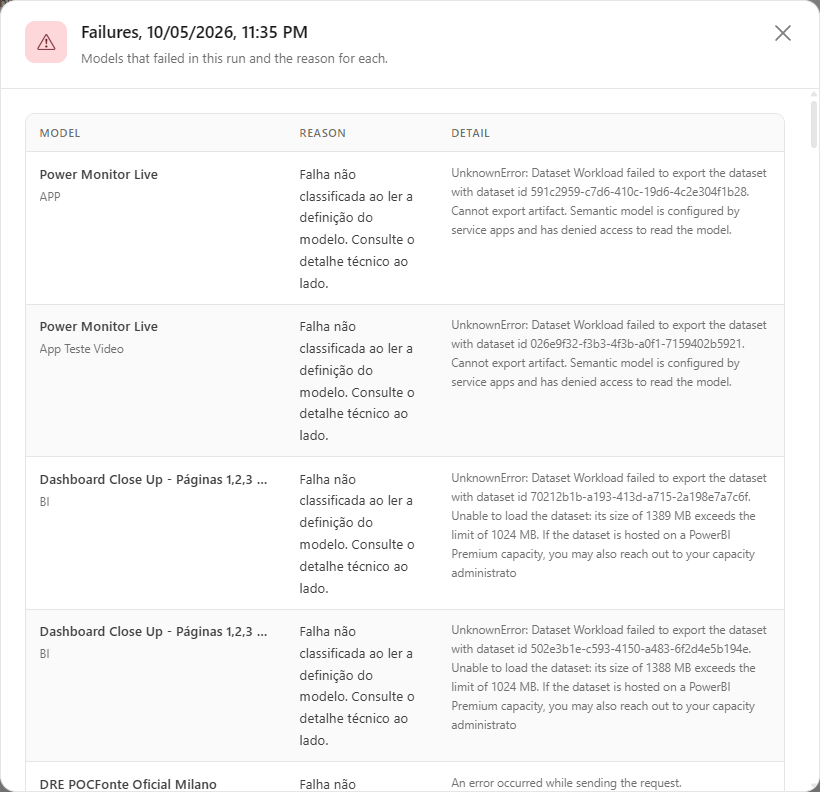
**What it is:** link in the status column of executions with failures that opens the **Failures, {date}** modal: "Models that failed in this run and the reason for each", with the columns **Model** (with the workspace below it), **Reason** and **Detail**.
**What it is for:** find out exactly which models were not read and what to fix (almost always the Service Principal's permission in the workspace).
Models that failed in an execution
**How to use:**
1. On the execution row, click **view failures**.
2. Read the **Reason** column of each model and the message in **Detail** (see [Common errors and how to fix them](#common-errors-and-how-to-fix-them)).
3. Fix the cause (for example, give the Service Principal the Contributor role in the workspace) and trigger **Run Full Scan** again, or wait for the daily execution.
**How it works / rules:** up to 200 items are stored per execution; the excess appears as **… and n more failure(s) not listed**.
## Rules and behavior
* **Where the data comes from:** Fabric API for reading the item definition (*getDefinition*, TMSL format), called with the Service Principal.
* **Automatic frequency:** daily at **00:26** (Brasília time, UTC-3) by default. In *Settings › Monitoring › Scans and Collections*, **Enrichment** group (**Semantic Model Mapping**), you can turn the scan off or choose the **Frequency** **Daily**, **Weekly** or **Monthly**. With the weekly and monthly frequencies, the automatic run happens on a day distributed per organization, and the setting shows the **Next expected run** and the **Last run**. **Run Full Scan** is not affected by the frequency and works even with the scan turned off.
* **Which models are included:** all semantic models in **monitored** workspaces where the Service Principal is a member. Models in workspaces the Service Principal cannot reach are left out of the total (they are not failures).
* **Large models:** a model larger than 1 GB (size captured by the [Model Size](/en/power-monitor/mapeamento/tamanho-de-modelos.md)) in a workspace without dedicated capacity is not read, because Microsoft does not allow exporting the definition in that case.
* **Processing:** models are read in batches of 100, with up to 10 reads in parallel and progress saved continuously; if the service is restarted, the execution is resumed or marked as **Interrupted**. An execution with no sign of activity for 5 minutes is marked as **Interrupted**.
* **Workspace without access:** when the Service Principal receives "access denied" in a workspace, the remaining models of that workspace in the same batch are not attempted (they appear with the detail "Not read: the workspace already failed due to lack of access in this batch.").
* **Concurrency:** there is only one execution per organization at a time.
### Where the data is used
| Data read | Where it appears |
| ------------------- | ----------------------------------------------------------------------------------------------------------------------------------------------------------------------------------------------------------------------------------------------------------------------------------------------------- |
| Relationships | Model diagram in [Governance › Semantic Models](/en/power-monitor/governanca/modelos-semanticos.md); rules of the [Best Practices Score](/en/power-monitor/qualidade-de-dados/score-de-boas-praticas-bpa.md); [Environment Inventory](/en/power-monitor/qualidade-de-dados/inventario-do-ambiente.md) |
| Column descriptions | [AI Score](/en/power-monitor/qualidade-de-dados/score-de-ia.md) and [Environment Inventory](/en/power-monitor/qualidade-de-dados/inventario-do-ambiente.md) |
| Model definition | Technical checks (for example, compatibility level) and the model version history, in *Governance › Operations › Model History* |
### Required permissions
The Service Principal must be a **member with write permission** (**Contributor** role or higher) in each workspace: Microsoft requires write permission on the item to read its definition and responds "not found" when the caller only has read access. Use **Add Service Principal** in the [Inventory](/en/power-monitor/mapeamento/inventarios.md#add-service-principal-to-workspaces) to add it to all workspaces at once.
## Common errors and how to fix them
| Reason / message | How to fix |
| -------------------------------------------------------------------------------------------------------------------------------------------------- | --------------------------------------------------------------------------------------------------------------------------------------------------------------------- |
| **No access to the model** | Grant the Service Principal the **Contributor** role (or higher) in the workspace. Microsoft responds "not found" when the item is not visible with write permission. |
| **This item does not support reading its definition** (template app, Microsoft-managed workspace, usage metrics model, internal dataflow artifact) | No action is required; it is a Microsoft limitation. |
| **Fabric API rate limit (429)** | Transient; the model is read again in the next execution. |
| **Model too large to export the definition** | Microsoft limitation for models above 1 GB outside dedicated capacity. |
| Large model moved between regions | Republish or restore the model in the capacity's current region. |
| **The Service Principal is not a member of any workspace: there is no model to map.** | Add the Service Principal to the monitored workspaces. |
| **Could not obtain the Service Principal token** | Review the Service Principal's App ID, secret and consent. |
| **Interrupted** status | The service was restarted during the execution. Trigger **Run Full Scan** again or wait for the daily execution. |
## Frequently asked questions
A model's Best Practices Score looks outdated.
Check whether the model appears in **view failures** of the last execution. While a model is not read successfully, the scores keep using the last successful read. Fix the permission and run **Run Full Scan**.
Why is "Updated" lower than "Models processed"?
"Updated" counts only the models whose definition changed since the previous read. Models read without changes count only as processed.
Are models in Pro workspaces also read?
Yes, as long as the workspace is monitored and the Service Principal has the Contributor role in it. Only models above 1 GB outside dedicated capacity are left out.
## Related pages
* [Governance › Semantic Models](/en/power-monitor/governanca/modelos-semanticos.md)
* [Best Practices Score (BPA)](/en/power-monitor/qualidade-de-dados/score-de-boas-praticas-bpa.md)
* [AI Score](/en/power-monitor/qualidade-de-dados/score-de-ia.md)
* [Environment Inventory](/en/power-monitor/qualidade-de-dados/inventario-do-ambiente.md)
* [Model Size](/en/power-monitor/mapeamento/tamanho-de-modelos.md)
---
# Agent Instructions
This documentation is published with GitBook. GitBook is the documentation platform designed so that both humans and AI agents can read, navigate, and reason over technical content effectively. Learn more at gitbook.com.
## Querying This Documentation
If you need additional information that is not directly available in this page, you can query the documentation by asking a question.
Perform an HTTP GET request on the following URL with the `ask` and `goal` query parameters:
```
GET https://docs.powermonitor.com.br/en/power-monitor/mapeamento/mapeamento-de-modelos.md?ask=&goal=
```
`ask` is the immediate question: it should be specific, self-contained, and written in natural language.
`goal` is what the user is ultimately trying to achieve, the reason they need the answer. Sharing it helps GitBook give you a better, more relevant answer. A goal is most helpful when it describes the outcome the user wants rather than restating the question. For example, with `ask=how do I create an API token`, a goal like `automate deployments from our CI pipeline` lets GitBook tailor the answer to that use case.
The response will contain a direct answer to the question and relevant excerpts and sources from the documentation.
Use this mechanism when the answer is not explicitly present in the current page, you need clarification or additional context, or you want to retrieve related documentation sections.