> For the complete documentation index, see [llms.txt](https://docs.powermonitor.com.br/llms.txt). Markdown versions of documentation pages are available by appending `.md` to page URLs; this page is available as [Markdown](https://docs.powermonitor.com.br/en/power-monitor/mapeamento/metricas-de-consumo.md).
# Consumption Metrics
Track the automatic executions of hourly aggregation, baseline calculation and detection of Capacity Units consumption anomalies.
The **Consumption Metrics** screen shows the history of three chained automatic processes that turn the **Capacity Units (CU)** consumption of your capacities into hourly metrics, into a baseline of expected consumption and into **consumption anomalies**. It is a **tracking-only** screen: these processes cannot be triggered manually.
**How to access:** *Mapping › Capacity and cost › Consumption Metrics* (page title: **Consumption Metrics Scan**). The link appears in the menu only for **Administrators**; since the screen has no actions, users with other profiles can also open it through the direct URL (`/map/consumption-metrics`), subject to per-user page blocking.
Consumption Metrics
## What it is for
* Confirm that the hourly consumption metrics are being calculated.
* Check whether the daily baseline was recalculated and for how many items.
* Understand why an expected anomaly did not appear (or was not notified).
## Features
The screen has three tabs, one per process. They all share the same features: the **Filter by start date** filter, the **Refresh** button, the **Run in progress** badge and the paginated executions table. On small screens, the tabs become a drop-down list.
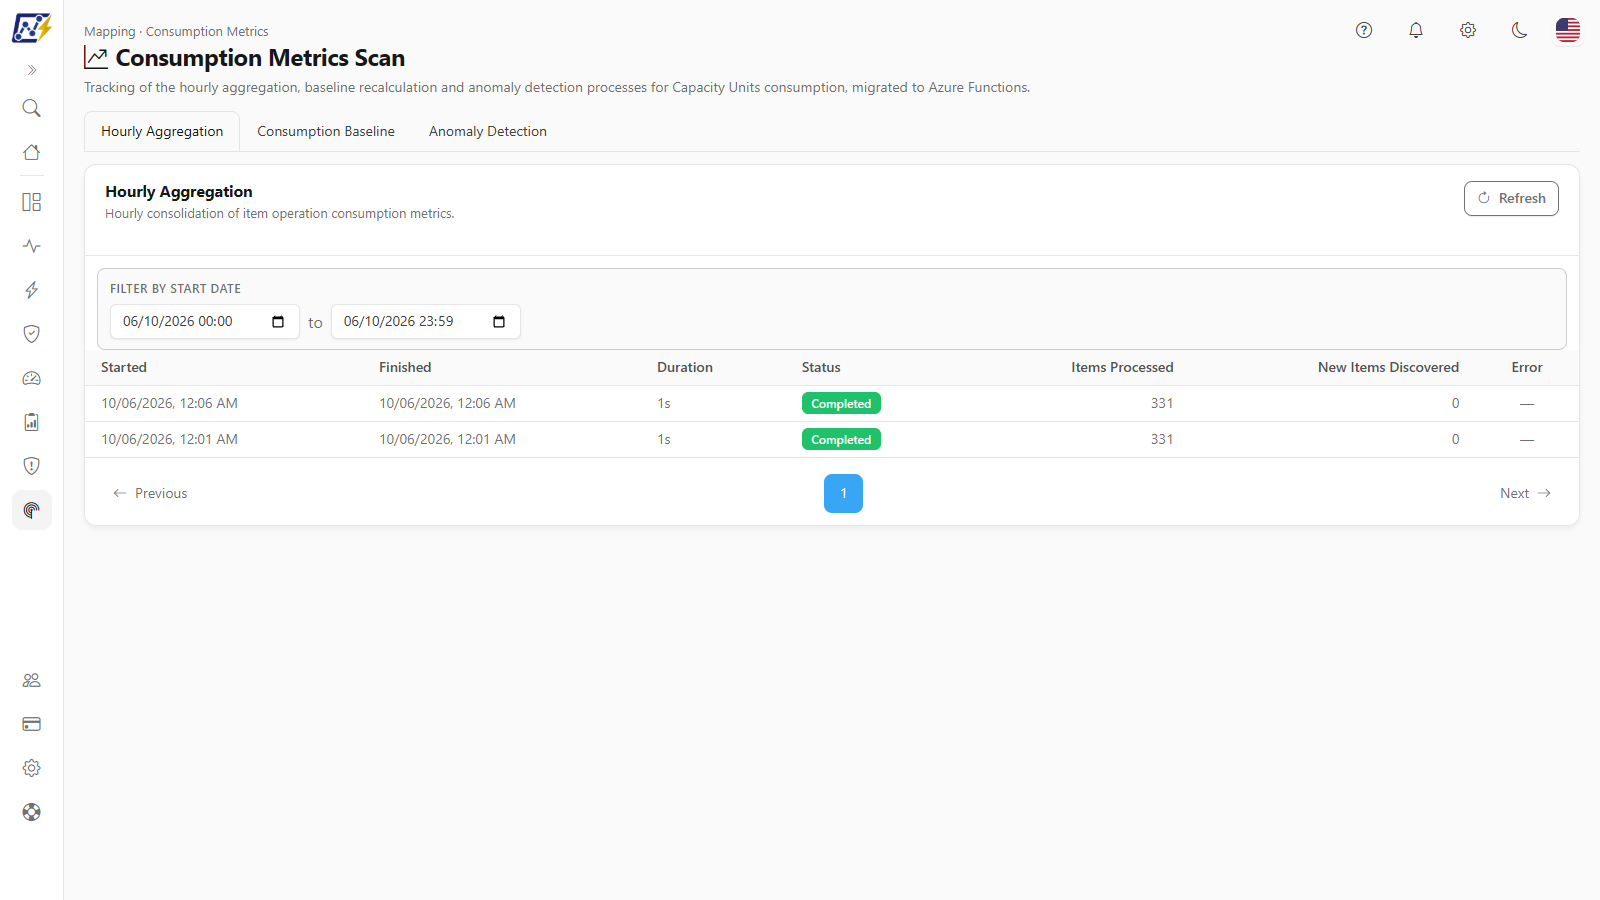
### Hourly Aggregation tab
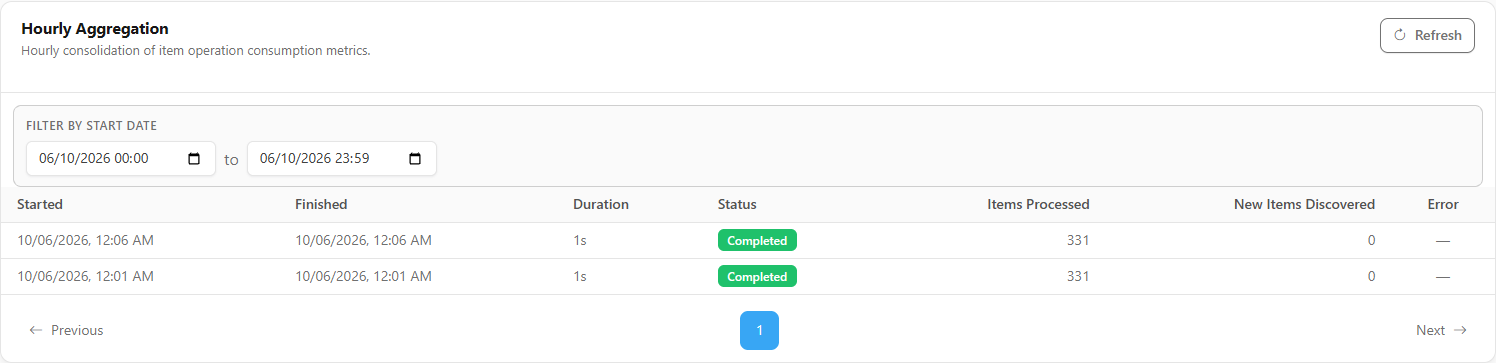
**What it is:** history of the "Hourly consolidation of item operation consumption metrics.", which runs every 5 minutes.
**What it is for:** confirm that the collected consumption is being turned into hourly metrics, the basis of the consumption screens and the baseline.
Hourly Aggregation tab
**How to use:**
1. Open the **Hourly Aggregation** tab (it is the initial tab).
2. Check that there are **Completed** executions every 5 minutes today.
3. Review **Items Processed** (items aggregated in the execution) and **New Items Discovered** (items that started having recorded consumption).
**How it works / rules:** each execution groups the daily consumption by item, operation and hour, updating the current and previous hour, and records new items.
### Consumption Baseline tab
**What it is:** history of the "Daily recalculation of the consumption baseline used to detect anomalies.", which runs daily at 23:30 (Brasília time, UTC-3).
**What it is for:** confirm that the expected consumption of each item was recalculated; without it, anomaly detection has no reference.
Consumption Baseline tab
**How to use:**
1. Click the **Consumption Baseline** tab.
2. Since the default filter is today, adjust **Filter by start date** to include the previous night (see [Filter by start date](#filter-by-start-date)).
3. Check **Items With Baseline**.
**How it works / rules:** the baseline of each item and operation is calculated based on the previous 7 days.
### Anomaly Detection tab
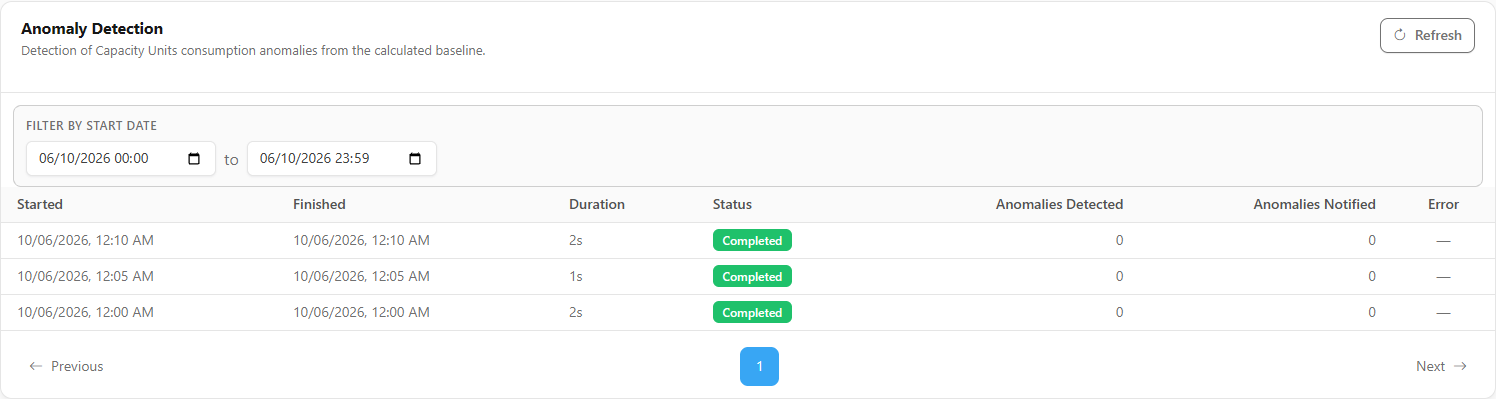
**What it is:** history of the "Detection of Capacity Units consumption anomalies from the calculated baseline.", which runs every 5 minutes.
**What it is for:** understand why an anomaly did or did not appear, and why it was or was not notified by email.
Anomaly Detection tab
**How to use:**
1. Click the **Anomaly Detection** tab.
2. Compare **Anomalies Detected** with **Anomalies Notified** in recent executions.
3. If there is detection without notification, review the anomaly notification settings.
**How it works / rules:** each execution compares the day's consumption with the baseline, records the anomalies and sends email notifications when the notification category is enabled and the severity reaches the configured threshold. The anomalies themselves are in [Consumption Anomalies](/en/power-monitor/monitoramento/anomalias-de-consumo.md).
### Filter by start date
**What it is:** date and time range filter (separated by "to") applied to the **start** of the executions in the open tab.
**What it is for:** look up executions from previous days, for example last night's baseline or the detection at the time of a peak.
**How to use:**
1. Click the **Filter by start date** field.
2. Enter the start and end date and time of the desired range.
3. The table is reloaded automatically, returning to the first page.
**How it works / rules:** the default is **today, from 00:00 to 23:59**, in your time zone. With no executions in the period, **No run recorded yet** is displayed.
### Refresh and Run in progress badge
**What it is:** the **Refresh** button, at the top of the card, reloads the table; the **Run in progress** badge appears when an execution is running.
**What it is for:** see the most recent executions; the screen does **not** refresh on its own.
**How to use:** click **Refresh** (the button shows **Refreshing…** while loading).
### Executions table
**What it is:** the list of executions of the tab's process, paginated, with 10 executions per page by default (the **Items per page** selector in the footer lets you choose 10, 25, 50 or 100).
**What it is for:** check the time, duration, result and counters of each execution.
| Column | Content |
| ----------------------------------------- | ------------------------------------------------------------------------------------------------------------------------------------------------- |
| **Started** / **Finished** / **Duration** | Execution times |
| **Status** | **Running**, **Completed**, **Failed** |
| Counters | Those of the tab: **Items Processed** and **New Items Discovered**; **Items With Baseline**; or **Anomalies Detected** and **Anomalies Notified** |
| **Error** | Icon with the error message, when there is one (hover over it to read) |
**How to use:**
1. Find the execution by the **Started** column.
2. On a **Failed** row, hover over the icon in the **Error** column to read the message.
3. Occasional failures are fixed by the next automatic execution. If they persist, contact support and provide the execution time.
4. Navigate through pages with the controls below the table.
## Rules and behavior
| Process | Frequency | What it does |
| ------------------------ | ------------------------------------- | ------------------------------------------------------------------------------------------------------------------------------------------------------------------------------------------------- |
| **Hourly Aggregation** | Every 5 minutes | Groups the daily consumption by item, operation and hour, updating the current and previous hour, and records new items |
| **Consumption Baseline** | Daily at 23:30 (Brasília time, UTC-3) | Calculates the expected consumption of each item and operation based on the previous 7 days |
| **Anomaly Detection** | Every 5 minutes | Compares the day's consumption with the baseline, records the anomalies and sends email notifications when the notification category is enabled and the severity reaches the configured threshold |
* The processes run for all active organizations; there is no per-organization on/off switch, and they do not appear in *Settings › Monitoring › Scans and Collections*, so they have no configurable **Frequency**.
* **Prerequisite:** the metrics depend on the capacity consumption collection, which only happens for capacities with **consumption monitoring enabled** and with the capacity metrics source available. Without it, executions finish as **Completed** with zeroed counters. See [Enable Capacity Monitoring](/en/power-monitor/monitoramento/capacidades/ativar-monitoramento-de-capacidade.md).
* Days and hours follow the time zone configured for the organization.
* An execution that stays running for more than 4 hours is closed as **Failed**.
* These executions also appear in [Scan Logs](/en/power-monitor/mapeamento/logs-de-scans-e-re-execucoes.md) (types **Hourly Aggregation**, **Consumption Baseline** and **Anomaly Detection**), with no re-run option.
## How to use: check whether consumption metrics are being processed
{% stepper %}
{% step %}
### Open the screen
Go to *Mapping › Capacity and cost › Consumption Metrics*.
{% endstep %}
{% step %}
### Check the aggregation
On the **Hourly Aggregation** tab, check that there are **Completed** executions every 5 minutes today and that **Items Processed** is greater than zero.
{% endstep %}
{% step %}
### Check the baseline
On the **Consumption Baseline** tab, adjust **Filter by start date** to include the previous night and check **Items With Baseline**.
{% endstep %}
{% step %}
### Check the detection
On the **Anomaly Detection** tab, see **Anomalies Detected** and **Anomalies Notified** for recent executions.
{% endstep %}
{% endstepper %}
## Frequently asked questions
All executions finish with zeroed counters. What should I do?
Probably no capacity has consumption monitoring enabled, or the capacity metrics source is not available. Enable monitoring in *Settings › Monitoring*. See [Enable Capacity Monitoring](/en/power-monitor/monitoramento/capacidades/ativar-monitoramento-de-capacidade.md).
An anomaly was detected, but I did not receive an email.
The notification is only sent when the anomaly notification category is enabled and the severity reaches the configured threshold. Compare **Anomalies Detected** with **Anomalies Notified** and review the notification settings. See [Consumption Anomalies](/en/power-monitor/monitoramento/anomalias-de-consumo.md).
Can I trigger these processes manually?
No. They run automatically. The screen is for tracking only.
## Related pages
* [Consumption Anomalies](/en/power-monitor/monitoramento/anomalias-de-consumo.md)
* [Consumption Metrics](/en/power-monitor/monitoramento/metricas-de-consumo.md)
* [Consumption History](/en/power-monitor/monitoramento/historico-de-consumo.md)
* [Enable Capacity Monitoring](/en/power-monitor/monitoramento/capacidades/ativar-monitoramento-de-capacidade.md)
---
# Agent Instructions
This documentation is published with GitBook. GitBook is the documentation platform designed so that both humans and AI agents can read, navigate, and reason over technical content effectively. Learn more at gitbook.com.
## Querying This Documentation
If you need additional information that is not directly available in this page, you can query the documentation by asking a question.
Perform an HTTP GET request on the following URL with the `ask` and `goal` query parameters:
```
GET https://docs.powermonitor.com.br/en/power-monitor/mapeamento/metricas-de-consumo.md?ask=&goal=
```
`ask` is the immediate question: it should be specific, self-contained, and written in natural language.
`goal` is what the user is ultimately trying to achieve, the reason they need the answer. Sharing it helps GitBook give you a better, more relevant answer. A goal is most helpful when it describes the outcome the user wants rather than restating the question. For example, with `ask=how do I create an API token`, a goal like `automate deployments from our CI pipeline` lets GitBook tailor the answer to that use case.
The response will contain a direct answer to the question and relevant excerpts and sources from the documentation.
Use this mechanism when the answer is not explicitly present in the current page, you need clarification or additional context, or you want to retrieve related documentation sections.