> For the complete documentation index, see [llms.txt](https://docs.powermonitor.com.br/llms.txt). Markdown versions of documentation pages are available by appending `.md` to page URLs; this page is available as [Markdown](https://docs.powermonitor.com.br/en/power-monitor/mapeamento/ontologias.md).
# Ontologies
Follow, trigger and pause the daily collection of the structure of Microsoft Fabric ontologies (entities, relationships, data bindings, rules and metrics).
The **Ontologies** collection reads, once a day, the definition of each Microsoft Fabric ontology in the monitored workspaces (entities, relationships, data bindings, rules and metrics) and points out the problems found. The result appears in [Governance › Ontologies](/en/power-monitor/governanca/dados-e-engenharia/ontologias.md); this screen shows the collection history and lets you trigger or pause it.
**How to access:** *Mapping › Models and reports › Ontologies*. Only **Administrators** can access the screen and the actions. On the data screen, all profiles with access see the **Collection** line with the date of the last run; the **View/manage collection →** link, which leads here, appears only for administrators.
Mapping › Models and reports › Ontologies
## What it is for
* Keep up to date the structure and the list of problems used in [Governance › Ontologies](/en/power-monitor/governanca/dados-e-engenharia/ontologias.md).
* Bring the collection forward when you have just created or changed an ontology and do not want to wait until the next day.
* Confirm that the collection is running and investigate ontologies that could not be read.
## Screen components
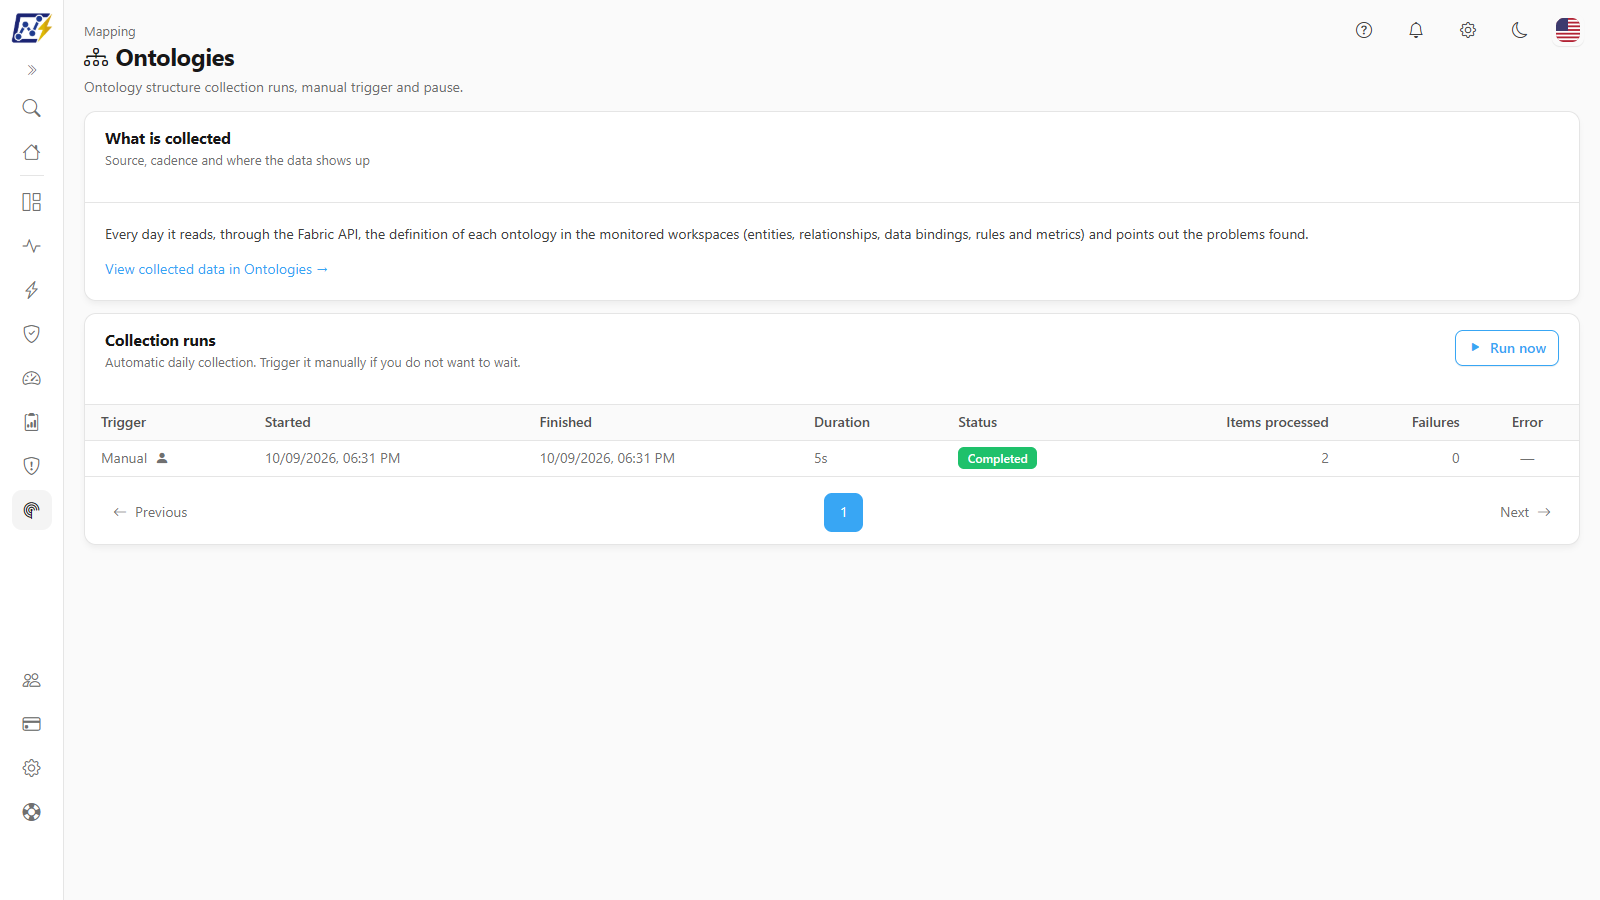
The screen has a header (*Mapping* and the subtitle **Ontology structure collection runs, manual trigger and pause.**) and two cards.
### What is collected card
Describes the source, the cadence and where the data shows up (*Source, cadence and where the data shows up*) and has, at the bottom, the **View collected data in Ontologies →** link, which leads to the data screen.
### Collection runs card
The **Collection runs** card (*Automatic daily collection. Trigger it manually if you do not want to wait.*) holds the buttons and the history, as in the other Mapping collections (see the details of each element in [Spark Sessions](/en/power-monitor/mapeamento/sessoes-spark.md#collection-runs-card)).
| Element | What it is for |
| ------------------------ | ----------------------------------------------------------------------------------------------------------------------------------------------------------------------------------------------------- |
| **Run now** / **Resume** | Triggers a manual collection. When there is a **Paused** run, the button is renamed **Resume** and continues from where it stopped. It works even with the automatic collection turned off. |
| **Pause** | Appears only during a run in progress; the run stops when it finishes the current ontology. |
| Runs table | History from the most recent to the oldest, with **Trigger**, **Started**, **Finished**, **Duration**, **Status**, **Items processed**, **Failures** (with the **View failures** link) and **Error**. |
## Rules and behavior
* **Where the data comes from:** Fabric API, queried with the organization's Service Principal. For each workspace with ontologies, a listing brings the generation (old or new experience); for each ontology, reading the definition brings the structure. Both experiences are interpreted.
* **What is read:** the ontologies already inventoried by the [Inventory Scan](/en/power-monitor/mapeamento/inventarios.md), not deleted, in **monitored** workspaces (see [Governance › Workspaces](/en/power-monitor/governanca/workspaces.md)).
* **Frequency:** automatic, once a day, at around **01:31** (Brasília time). It can be turned off or changed to **Weekly** or **Monthly** in [Settings › Monitoring](/en/power-monitor/configuracoes/monitoramento.md#scans-and-collections), **Scans and Collections** section, **Inventory** group, **Ontology structure** item (turned on by default). **Run now** works even with the switch turned off.
* **Limit per run:** up to **100 ontologies** per run, starting with those never read and then those read the longest time ago. The rest go into the next runs.
* **No change, no reprocessing:** when the definition has not changed since the last read, only the capture date is updated.
* **Service Principal permission:** to list the ontologies, being a **Viewer** of the workspace is enough; to read the definition, the Service Principal needs **read and write** on the item (**Contributor** or higher). Power Monitor recommends the Service Principal as an administrator of the workspaces, which already covers both cases. See [Additional Permissions › Add Service Principal to Workspaces](/en/power-monitor/configuracoes/permissoes-adicionais.md#add-service-principal-to-workspaces).
* **Ontologies that cannot be read:** without access, with an encrypted sensitivity label or when Fabric does not allow reading the definition, the ontology gets the **No access**, **Encrypted label** or **Not supported** status and does **not** count as a run failure.
* **Failures per item:** a failure on one ontology does not bring the collection down; it is counted in **Failures**, with the reason (failure reading the ontology definition, definition that could not be interpreted, structure that could not be saved or an unexpected failure while processing the ontology; the reasons are shown in Portuguese). The ontology keeps the last known structure.
* **Fabric request limit:** if Fabric throttles the calls, the run is paused and resumed later, without losing what was already saved.
* **Concurrency:** there is only one active run (in progress or paused) per organization.
## Frequently asked questions
The collection finished, but an ontology is still "No access".
The Service Principal does not have read and write permission on the ontology. Make it a **Contributor** or higher (preferably an administrator) of the workspace and trigger the collection again.
I created an ontology and it does not appear in this collection.
The collection only reads the ontologies that are already in the inventory. Wait for the next Inventory Scan (or trigger one in [Inventory](/en/power-monitor/mapeamento/inventarios.md)) and then for the ontology collection.
Does the collection consume Fabric capacity?
No. It only reads the definition of the ontologies through the Fabric API, without querying data.
## Related pages
* [Governance › Ontologies](/en/power-monitor/governanca/dados-e-engenharia/ontologias.md)
* [Governance › Data Science](/en/power-monitor/governanca/dados-e-engenharia/ciencia-de-dados.md)
* [Settings › Monitoring](/en/power-monitor/configuracoes/monitoramento.md)
* [Additional Permissions](/en/power-monitor/configuracoes/permissoes-adicionais.md)
* [Mapping](/en/power-monitor/mapeamento.md)
---
# Agent Instructions
This documentation is published with GitBook. GitBook is the documentation platform designed so that both humans and AI agents can read, navigate, and reason over technical content effectively. Learn more at gitbook.com.
## Querying This Documentation
If you need additional information that is not directly available in this page, you can query the documentation by asking a question.
Perform an HTTP GET request on the following URL with the `ask` and `goal` query parameters:
```
GET https://docs.powermonitor.com.br/en/power-monitor/mapeamento/ontologias.md?ask=&goal=
```
`ask` is the immediate question: it should be specific, self-contained, and written in natural language.
`goal` is what the user is ultimately trying to achieve, the reason they need the answer. Sharing it helps GitBook give you a better, more relevant answer. A goal is most helpful when it describes the outcome the user wants rather than restating the question. For example, with `ask=how do I create an API token`, a goal like `automate deployments from our CI pipeline` lets GitBook tailor the answer to that use case.
The response will contain a direct answer to the question and relevant excerpts and sources from the documentation.
Use this mechanism when the answer is not explicitly present in the current page, you need clarification or additional context, or you want to retrieve related documentation sections.