> For the complete documentation index, see [llms.txt](https://docs.powermonitor.com.br/llms.txt). Markdown versions of documentation pages are available by appending `.md` to page URLs; this page is available as [Markdown](https://docs.powermonitor.com.br/en/power-monitor/mapeamento/operacoes-de-deploy.md).
# Deployment operations
Follow, trigger, pause and resume the daily collection of the deployment operations of deployment pipelines, kept for 180 days.
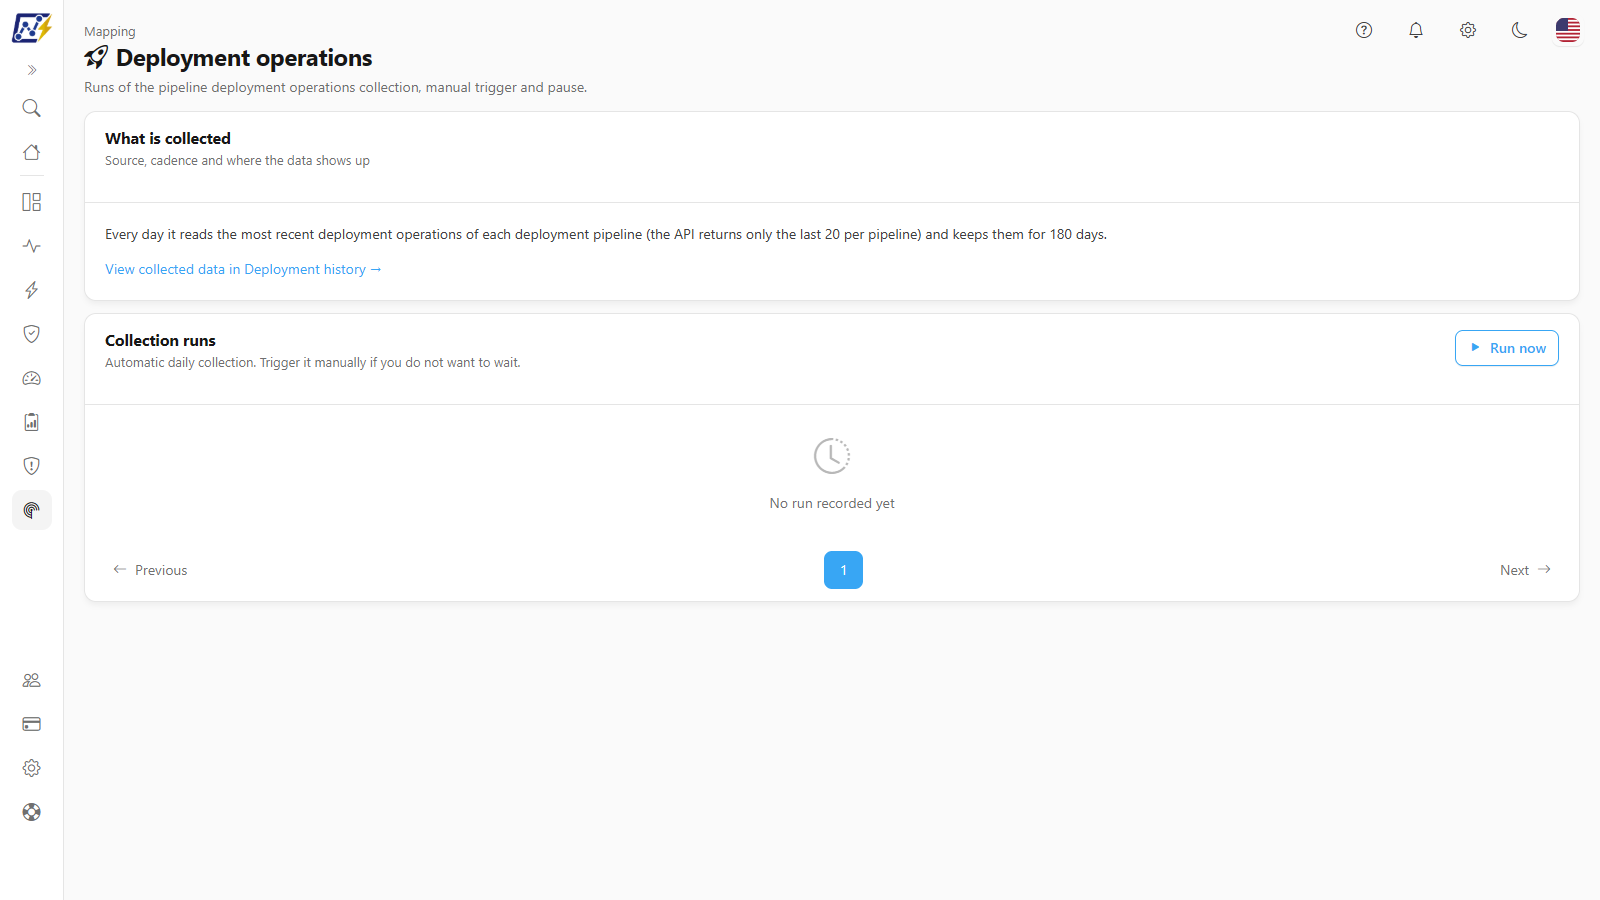
The Mapping **Deployment operations** screen controls the collection that reads, every day, the **most recent deployment operations of each deployment pipeline** in Fabric and accumulates them for **180 days**. This collection feeds the Deployment history in Governance. This screen shows the collection history and lets you trigger, pause and resume it.
**How to access:** *Mapping › Operations › Deployment operations*. Only **Administrators** can access the screen and the actions. On the Deployment history screen in Governance, the other profiles see only the **Collection** status line, without the link to this screen.
Deployment operations
## What it is for
* Confirm that the deployment operations of pipelines are being collected and that the last collection finished well.
* Record right away a deployment just made, without waiting for the daily collection.
* Find out why a pipeline does not appear in the Deployment history.
## Screen components
The screen has two cards: **What is collected** and **Collection runs** ("Automatic daily collection. Trigger it manually if you do not want to wait.").
### What is collected
**What it is:** a card with the description of the collection and, in the footer, the link **View collected data in Deployment history →**, which leads to the Governance screen.
### Run now / Resume
**What it is:** a button that triggers a manual collection. When there is a **Paused** collection, the same button is named **Resume** and continues where it stopped.
**What it is for:** seeing right away, in [Governance › Operations › Deployment history](/en/power-monitor/governanca/operacao/historico-de-deploys.md), the deployments made since the last collection.
**How to use:**
1. Click **Run now**. There is no confirmation modal; the button shows **Running…** while it sends the request.
2. The message **Run queued. The history updates when it starts.** confirms it; if a collection is already running, **A run is already in progress for this organization.** appears. While the collection service has not picked up the run, the button shows **Queued** and the card says *Run queued, waiting to start…*; then the button changes to **In progress** and the bar shows the processed items (for example, *12 of 40*) and the estimated time left (*\~3 min left*). The screen tracks the run until it finishes, without reloading.
3. Follow the **Run in progress** badge and the row in the history until **Completed**.
To resume a paused collection, click **Resume** (**Resuming…**). The message **Run resumed successfully.** confirms it.
**How it works / rules:**
* It works even with the automatic run turned off.
* There is only one active collection (running or paused) per organization.
### Pause
**What it is:** a button that appears only while a collection is running and asks it to stop.
**What it is for:** temporarily interrupting a long collection without losing what has already been read.
**How to use:**
1. During the collection, click **Pause** (**Pausing…**). The badge **Pause requested: the run stops after the next processed item** appears.
2. The run becomes **Paused** and the main button becomes **Resume**.
3. Click **Resume** to continue from where it stopped.
**How it works / rules:** the pause is cooperative: the pipeline being processed finishes and the collection stops at the next one. A paused collection does not expire.
### Collection state badges
At the top of the card the badges **Run in progress (n)** (blue, with a spinning indicator), **Run paused** (yellow) and **Pause requested…** (gray) appear. During a running collection, an animated progress bar appears above the table.
### Run history
**What it is:** a paginated table (10 per page; the **Items per page** selector below the table offers 10, 25, 50 or 100) with the runs, from the most recent to the oldest.
Run history
| Column | Content |
| ----------------------------------------- | ---------------------------------------------------------------------------------------------------- |
| **Trigger** | **Scheduled** or **Manual** (in manual runs, hover over the person icon to see who triggered it) |
| **Started** / **Finished** / **Duration** | Times of the run (no end or duration while it is active) |
| **Status** | **Running** (blue), **Paused** (yellow), **Completed** (green), **Failed** (red), **Stuck** (yellow) |
| **Items processed** | Number of pipelines read |
| **Failures** | Pipelines with an error; **View failures** link |
| **Error** | Icon with the general error message of the run (hover over it) |
While there is an active collection, the table refreshes automatically every 20 seconds. With no runs, **No run recorded yet** appears.
### View failures
**What it is:** a link in the **Failures** column that opens the **Failures for the {date} run** modal, with the columns **Item**, **Reason** and **Detail**.
**How to use:** click **View failures** in the run (available when it ended with failures), read the **Reason** and **Detail** of each item and click **Close**. If the run did not keep the detail, **No detail available for this run.** appears. When there are many failures, the end of the list shows **and n more not listed**.
## Rules and behavior
* **Where the data comes from:** first the Power BI Admin API, to list the deployment pipelines of the tenant; then the Power BI pipelines API, to read the deployment operations of each pipeline. Power Monitor does not keep the pipelines themselves, only the operations.
* **Automatic frequency:** once a day, at **06:45** (Brasília time), for active organizations with a configured Service Principal. In *Settings › Monitoring › Scans and Collections*, **Others** group, the scan appears as **Pipeline deployment operations**: there you can turn it off and choose the **Frequency** (**Daily**, **Weekly** or **Monthly**), with the **Next expected run** and the **Last run**. **Run now** works even with the switch turned off and does not change the configured frequency. See [Settings › Monitoring](/en/power-monitor/configuracoes/monitoramento.md).
* **Window of 20 operations:** the API returns, at most, the **20 most recent operations of each pipeline**. A pipeline with more than 20 deployments between two collections loses the oldest ones: the history is a best-effort accumulation, not a complete record. Therefore, for very active pipelines, the most frequent collection (**Daily**) is the most suitable.
* **Retention:** operations are kept for **180 days**; older ones are removed.
* **Pipelines without access:** Power Monitor can only read the operations of the pipelines the Service Principal can access. Pipelines without access are ignored and **do not count as a failure**.
* **Request limit:** if the API answers that the limit was reached (429), the run ends as **Failed** with the message of the point where it stopped; what was already saved is kept.
* **Stuck:** a collection with no progress for **10 minutes** is ended as **Stuck**.
* **Concurrency:** one active collection (running or paused) per organization.
### Required permission
To list the pipelines, the tenant setting **Service principals can access read-only admin APIs** is required, enabled for a security group that contains the Service Principal. If Fabric refuses the listing (403), the run ends as **Failed** with guidance to enable this setting. To read the operations, the Service Principal needs access to the pipeline itself. Power Monitor never changes these settings automatically.
## Step by step
{% stepper %}
{% step %}
### Open the screen
In *Mapping › Operations › Deployment operations* (or through the **View/manage collection →** link in Deployment history).
{% endstep %}
{% step %}
### Trigger the collection
Click **Run now** and follow the **Run in progress** badge until the history row is **Completed**.
{% endstep %}
{% step %}
### Check the failures
If the **Failures** column is greater than zero, click **View failures** and read the **Reason** and **Detail**.
{% endstep %}
{% step %}
### See the deployments
Click **View collected data in Deployment history →**.
{% endstep %}
{% endstepper %}
## Common errors and how to fix them
| Message / symptom | How to fix |
| -------------------------------------------------------------------------------- | ------------------------------------------------------------------------------------------------------------------------------------ |
| **Failed** status guiding you to enable the admin setting for Service Principals | Enable **Service principals can access read-only admin APIs** for the Service Principal's group, wait for propagation and run again. |
| **Failed** status due to request limit (429) | Wait and click **Run now** again. |
| A pipeline does not appear in the Deployment history | The Service Principal may not have access to it, or the pipeline has not had recent deployments. |
| **Stuck** status | The run stopped progressing. Click **Run now** again. |
## Frequently asked questions
Where do I see the collected deployment operations?
In [Governance › Operations › Deployment history](/en/power-monitor/governanca/operacao/historico-de-deploys.md), available to all profiles (respecting each user's workspace scope). This screen shows only the runs of the collection.
I made a deployment more than 180 days ago and it disappeared. Is it an error?
No. Retention is 180 days.
Why are deployments of a heavily used pipeline missing?
The Power BI API returns only the 20 most recent operations of each pipeline. If there were more than 20 deployments between two collections, the oldest ones cannot be recovered. Keep the **Frequency** at **Daily**.
## Related pages
* [Governance › Operations › Deployment history](/en/power-monitor/governanca/operacao/historico-de-deploys.md)
* [Governance › Operations › Deployment Pipelines](/en/power-monitor/governanca/operacao/pipelines-de-implantacao.md)
* [Settings › Monitoring](/en/power-monitor/configuracoes/monitoramento.md)
* [Scan Logs](/en/power-monitor/mapeamento/logs-de-scans-e-re-execucoes.md)
* [Mapping](/en/power-monitor/mapeamento.md)
---
# Agent Instructions
This documentation is published with GitBook. GitBook is the documentation platform designed so that both humans and AI agents can read, navigate, and reason over technical content effectively. Learn more at gitbook.com.
## Querying This Documentation
If you need additional information that is not directly available in this page, you can query the documentation by asking a question.
Perform an HTTP GET request on the following URL with the `ask` and `goal` query parameters:
```
GET https://docs.powermonitor.com.br/en/power-monitor/mapeamento/operacoes-de-deploy.md?ask=&goal=
```
`ask` is the immediate question: it should be specific, self-contained, and written in natural language.
`goal` is what the user is ultimately trying to achieve, the reason they need the answer. Sharing it helps GitBook give you a better, more relevant answer. A goal is most helpful when it describes the outcome the user wants rather than restating the question. For example, with `ask=how do I create an API token`, a goal like `automate deployments from our CI pipeline` lets GitBook tailor the answer to that use case.
The response will contain a direct answer to the question and relevant excerpts and sources from the documentation.
Use this mechanism when the answer is not explicitly present in the current page, you need clarification or additional context, or you want to retrieve related documentation sections.